SlideShare a Scribd company logo
1 of 5
Download to read offline
Brief Discussion on Receivables 
Turnover Ratio 
The receivables turnover ratio is just that, a measure of how many times your receivables turn over each 
year.  Some of the best in industry have ratios between 9 and 10.  Below that and you are spending too 
much on financing.  Above that and you are spending too much on receivables management.   
 
If your Receivables Turnover Ratio is 9, for example, your Accounts Receivables “turn over” roughly 9 
times annually.  This correlates to about 40 days (# of Days in one year/Ratio OR 365/9 = 40).  The days 
calculation means that every dollar that reaches the Receivables account will stay there for that many 
number of days before it is collected and deposited into the bank.  (36 days with a ratio of 10.)  The Days 
calculation can also be referred to as Days Sales Outstanding or DSO.  As your receivables ratio increases 
your # of Days Sales Outstanding decreases.   
 
This was something I began tracking at a company I worked for where I was managing the A/R.  What I 
would do is take a reading each month.  I would always use data from the 12 months leading up to that 
day I was taking the reading for.  For example if it was January 1, 2012 and we just closed December 
2011, the data I would use was January 2011 – December 2011.  This would give me the Receivables 
Turnover Ratio and DSO for the entire year 2011.  In February of 2012, I would use data from February 
2011 – January 2012 to incorporate the new month.  I would always track the ratio and the correlating 
number of days on a Chart in Excel so I could see my progress.  When I started tracking the data, I felt 
the DSO was too high, too far away from industry targets or optimum values.  Therefore, I began figuring 
out ways to reduce the average number of days dollars would remain in the Receivables Account.  Or in 
other words, figuring ways to increase our Receivables Turnover Ratio.  Through my collection and 
organizational efforts I was able to reach more optimum values for the company. 
 
The primary ways I was able to achieve my goals was through several methods: 
 
            Employing standard terms of Net 30 
            Moving customers to pay electronically (ACH transfers, deposit direct to bank checking 
             account) 
            Electronic delivery of invoices 
            Better review of the Purchaser Order (or Contract) prior to acceptance of the Purchase 
             Order 
            Better processes in transferring orders to invoices to decrease errors 
            Better processes in billing the customer 
            Creating new reports allowing more immediate tracking of unpaid invoices that exceeded 
             due date and/or days’ target 
              
Below is a very brief summary of how I was tracking the Receivables Turnover Ratio and Days Sales 
Outstanding values at this company.  The data has been completely fabricated for the purpose of this 
analysis.  One of the lessons I learned in doing this is that there is intrinsic value in quantitative surety. 
2010

Month                          January      February         March          April          May         June
Period Begin                     1/1/2009     2/1/2009      3/1/2009      4/1/2009      5/1/2009      6/1/2009
Period End                     12/31/2009    1/31/2010     2/28/2010     3/31/2010     4/30/2010     5/31/2010

Average A/R Balance
Period Start A/R Balance        $513,056     $500,961      $509,273      $485,323      $498,804     $491,972
Period End A/R Balance          $469,958     $458,879      $466,493      $444,555      $456,904     $450,645
Period Average                  $491,507     $479,920      $487,883      $464,939      $477,854     $471,308


Receivables Turnover Ratio
Period Net Credit Sales**      $4,000,000   $4,000,000    $4,000,000    $4,000,000    $4,000,000   $4,000,000
Period Average A/R Balance      $491,507     $479,920      $487,883      $464,939      $477,854     $471,308
Ratio                                8.14         8.33          8.20          8.60          8.37         8.49


Days In Period
Period Start                     1/1/2009     2/1/2009      3/1/2009      4/1/2009      5/1/2009      6/1/2009
Period End                     12/31/2009    1/31/2010     2/28/2010     3/31/2010     4/30/2010     5/31/2010
# of Days in Period                   364          364           364           364           364           364


Days Sales Outstanding (DSO)
# of Days in Period               364.00       364.00        364.00        364.00        364.00        364.00
Receivables Turnover Ratio          8.14         8.33          8.20          8.60          8.37          8.49
Days Sales Outstanding (DSO)       44.73         43.67         44.40         42.31         43.48        42.89


Month                               July     August      September      October      November      December
Period Begin                     7/1/2009     8/1/2009      9/1/2009     10/1/2009     11/1/2009     12/1/2009
Period End                      6/30/2010    7/31/2010     8/31/2010     9/30/2010    10/31/2010    11/30/2010

Average A/R Balance
Period Start A/R Balance        $478,852     $498,804      $478,852      $472,552      $466,415     $460,435
Period End A/R Balance          $438,627     $456,904      $438,627      $432,856      $427,235     $421,757
Period Average                  $458,740     $477,854      $458,740      $452,704      $446,825     $441,096


Receivables Turnover Ratio
Period Net Credit Sales*       $4,000,000   $4,000,000    $4,000,000    $4,000,000    $4,000,000   $4,000,000
Period Average A/R Balance      $458,740     $477,854      $458,740      $452,704      $446,825     $441,096
Ratio                                8.72         8.37          8.72          8.84          8.95         9.07


Days In Period
Period Start                     7/1/2009     8/1/2009      9/1/2009     10/1/2009     11/1/2009     12/1/2009
Period End                      6/30/2010    7/31/2010     8/31/2010     9/30/2010    10/31/2010    11/30/2010
# of Days in Period                   364          364           364           364           364           364


Days Sales Outstanding (DSO)
# of Days in Period               364.00       364.00        364.00        364.00        364.00        364.00
Receivables Turnover Ratio          8.72         8.37          8.72          8.84          8.95          9.07
Days Sales Outstanding (DSO)       41.75         43.48         41.75         41.20         40.66        40.14


* Period Year over
9.20 
                                                                                                           9.07 

 9.00                                                                                              8.95 

                                                                                        8.84 

 8.80 
                                                            8.72               8.72 

                                    8.60 
 8.60 
                                                    8.49 

                                            8.37                    8.37 
 8.40              8.33 


                            8.20 
 8.20      8.14 


 8.00 
         January           March            May             July            September           November


45.50 
45 50

          44.7
                           44.4
44.50 

                   43.7
                                            43.5                    43.5
43.50 
                                                    42 9
                                                    42.9


42.50                               42.3

                                                            41.7              41.7

41.50                                                                                   41.2

                                                                                                  40.7

40.50                                                                                                      40.1


39.50 
         January           March            May             July            September           November
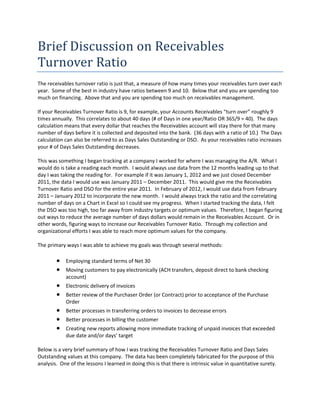
2011

Month                          January      February         March         April          May         June
Period Begin                     1/1/2010     2/1/2010      3/1/2010     4/1/2010      5/1/2010      6/1/2010
Period End                     12/31/2010    1/31/2011     2/28/2011    3/31/2011     4/30/2011     5/31/2011


Average A/R Balance
Period Start A/R Balance        $524,291     $528,146      $544,150     $536,029      $528,146     $520,492
Period End A/R Balance          $480,249     $483,780      $498,440     $491,001      $483,780     $476,769
Period Average                  $502,270     $505,963      $521,295     $513,515      $505,963     $498,630


Receivables Turnover Ratio
Period Net Credit Sales*       $4,800,000   $4,800,000    $4,800,000   $4,800,000    $4,800,000   $4,800,000
Period Average A/R Balance      $502,270     $505,963      $521,295     $513,515      $505,963     $498,630
Ratio                                9.56         9.49          9.21         9.35          9.49         9.63


Days In Period
Period Start                     1/1/2010     2/1/2010      3/1/2010     4/1/2010      5/1/2010      6/1/2010
Period End                     12/31/2010    1/31/2011     2/28/2011    3/31/2011     4/30/2011     5/31/2011
# of Days in Period                   364          364           364          364           364           364


Days Sales Outstanding (DSO)
# of Days in Period               364.00       364.00        364.00       364.00        364.00        364.00
Receivables Turnover Ratio          9.56         9.49          9.21         9.35          9.49          9.63
Days Sales Outstanding (DSO)        38.09        38.37         39.53        38.94         38.37        37.81


Month                               July     August      September     October      November      December
Period Begin                     7/1/2010     8/1/2010      9/1/2010    10/1/2010     11/1/2010     12/1/2010
Period End                      6/30/2011    7/31/2011     8/31/2011    9/30/2011    10/31/2011    11/30/2011


Average A/R Balance
Period Start A/R Balance        $513,056     $498,804      $495,023     $491,972      $498,804     $513,056
Period End A/R Balance          $469,958     $456,904      $453,440     $450,645      $456,904     $469,958
Period Average                  $491,507     $477,854      $474,231     $471,308      $477,854     $491,507


Receivables Turnover Ratio
Period Net Credit Sales**      $4,800,000   $4,800,000    $4,800,000   $4,800,000    $4,800,000   $4,800,000
Period Average A/R Balance      $491,507     $477,854      $474,231     $471,308      $477,854     $491,507
Ratio                                9.77        10.04         10.12        10.18         10.04         9.77


Days In Period
Period Start                     7/1/2010     8/1/2010      9/1/2010    10/1/2010     11/1/2010     12/1/2010
Period End                      6/30/2011    7/31/2011     8/31/2011    9/30/2011    10/31/2011    11/30/2011
# of Days in Period                   364          364           364          364           364           364


Days Sales Outstanding (DSO)
# of Days in Period               364.00       364.00        364.00       364.00        364.00        364.00
Receivables Turnover Ratio          9.77        10.04         10.12        10.18         10.04          9.77
Days Sales Outstanding (DSO)        37.27        36.24         35.96        35.74         36.24        37.27


* Period Year Over
10.30 
                                                                                         10.18 
                                                                               10.12 
10.10                                                               10.04                           10.04 


 9.90 
                                                            9.77                                             9.77 

 9.70                                               9.63 
           9.56 
                   9.49                     9.49 
 9.50 

                                    9.35 

 9.30 
                            9.21 


 9.10 
         January           March            May             July             September            November


40.00 
                           39.5
39.50 
                                    38.9
39.00 

                   38.4                     38.4
38.50 
          38.1
38.00
38.00                                               37.8


37.50                                                       37.3                                             37.3

37.00 

36.50                                                               36.2                            36.2
                                                                               36.0
36.00 
36 00                                                                                    35.7

35.50 

35.00 
         January           March            May             July             September            November

More Related Content

What's hot

Account receivable ar incoming payment process in sap
Account receivable ar incoming payment process in sapAccount receivable ar incoming payment process in sap
Account receivable ar incoming payment process in sapKrishnam Raju
 
SAP Controlling overview
SAP Controlling overviewSAP Controlling overview
SAP Controlling overviewMohamed Hani
 
P2P Cycle -Oracle Apps
P2P Cycle -Oracle AppsP2P Cycle -Oracle Apps
P2P Cycle -Oracle AppsManu MK
 
Accounting entries for procure to pay
Accounting entries for procure to payAccounting entries for procure to pay
Accounting entries for procure to payAntony Samuel
 
Designing a Chart of Accounts and Enterprise Structure in Oracle Fusion ERP C...
Designing a Chart of Accounts and Enterprise Structure in Oracle Fusion ERP C...Designing a Chart of Accounts and Enterprise Structure in Oracle Fusion ERP C...
Designing a Chart of Accounts and Enterprise Structure in Oracle Fusion ERP C...Prithis Das, PMP, OCS ☁️
 
Organization Setup in R12
Organization Setup in R12Organization Setup in R12
Organization Setup in R12eprentise
 
All About Multi Organization Access
All About Multi Organization AccessAll About Multi Organization Access
All About Multi Organization AccessAhmed Elshayeb
 
Accounting and financial statements
Accounting and financial statementsAccounting and financial statements
Accounting and financial statementsAwais Chaudhary
 
financial statement analysis ppt
 financial statement analysis ppt financial statement analysis ppt
financial statement analysis pptsaikrishnabachuwar
 
Accounting Concepts And Accounting Entries In Oracle V1.0
Accounting Concepts And Accounting Entries In Oracle V1.0Accounting Concepts And Accounting Entries In Oracle V1.0
Accounting Concepts And Accounting Entries In Oracle V1.0Mahmoud Fawzy
 
How to configure LCM After receiving
How to configure LCM After receivingHow to configure LCM After receiving
How to configure LCM After receivingAhmed Elshayeb
 
Understanding Financial Statements
Understanding Financial StatementsUnderstanding Financial Statements
Understanding Financial StatementsCBIZ, Inc.
 
Overcoming the Top 7 Intercompany Accounting Challenges in SAP ERP Financials
Overcoming the Top 7 Intercompany Accounting Challenges in SAP ERP FinancialsOvercoming the Top 7 Intercompany Accounting Challenges in SAP ERP Financials
Overcoming the Top 7 Intercompany Accounting Challenges in SAP ERP FinancialsSAPinsider Events
 
Oracle Receivables ivas
Oracle Receivables ivasOracle Receivables ivas
Oracle Receivables ivasAli Ibrahim
 

What's hot (20)

Procurement of Services using Oracle EBS
Procurement of Services using Oracle EBSProcurement of Services using Oracle EBS
Procurement of Services using Oracle EBS
 
Encumbrance Accounting
Encumbrance AccountingEncumbrance Accounting
Encumbrance Accounting
 
Account receivable ar incoming payment process in sap
Account receivable ar incoming payment process in sapAccount receivable ar incoming payment process in sap
Account receivable ar incoming payment process in sap
 
SAP Controlling overview
SAP Controlling overviewSAP Controlling overview
SAP Controlling overview
 
Order to cash
Order to cashOrder to cash
Order to cash
 
P2P Cycle -Oracle Apps
P2P Cycle -Oracle AppsP2P Cycle -Oracle Apps
P2P Cycle -Oracle Apps
 
Accounting entries for procure to pay
Accounting entries for procure to payAccounting entries for procure to pay
Accounting entries for procure to pay
 
Designing a Chart of Accounts and Enterprise Structure in Oracle Fusion ERP C...
Designing a Chart of Accounts and Enterprise Structure in Oracle Fusion ERP C...Designing a Chart of Accounts and Enterprise Structure in Oracle Fusion ERP C...
Designing a Chart of Accounts and Enterprise Structure in Oracle Fusion ERP C...
 
Organization Setup in R12
Organization Setup in R12Organization Setup in R12
Organization Setup in R12
 
All About Multi Organization Access
All About Multi Organization AccessAll About Multi Organization Access
All About Multi Organization Access
 
Accounting and financial statements
Accounting and financial statementsAccounting and financial statements
Accounting and financial statements
 
P2P & O2C
P2P & O2CP2P & O2C
P2P & O2C
 
financial statement analysis ppt
 financial statement analysis ppt financial statement analysis ppt
financial statement analysis ppt
 
Accounting Concepts And Accounting Entries In Oracle V1.0
Accounting Concepts And Accounting Entries In Oracle V1.0Accounting Concepts And Accounting Entries In Oracle V1.0
Accounting Concepts And Accounting Entries In Oracle V1.0
 
How to configure LCM After receiving
How to configure LCM After receivingHow to configure LCM After receiving
How to configure LCM After receiving
 
Understanding Financial Statements
Understanding Financial StatementsUnderstanding Financial Statements
Understanding Financial Statements
 
Overcoming the Top 7 Intercompany Accounting Challenges in SAP ERP Financials
Overcoming the Top 7 Intercompany Accounting Challenges in SAP ERP FinancialsOvercoming the Top 7 Intercompany Accounting Challenges in SAP ERP Financials
Overcoming the Top 7 Intercompany Accounting Challenges in SAP ERP Financials
 
Oracle fixed assets
Oracle fixed assetsOracle fixed assets
Oracle fixed assets
 
Accounting in Oracle Inventory
Accounting in Oracle InventoryAccounting in Oracle Inventory
Accounting in Oracle Inventory
 
Oracle Receivables ivas
Oracle Receivables ivasOracle Receivables ivas
Oracle Receivables ivas
 

Viewers also liked

Ppt bab 11 neraca saldo setelah penyesuaian
Ppt bab 11 neraca saldo setelah penyesuaianPpt bab 11 neraca saldo setelah penyesuaian
Ppt bab 11 neraca saldo setelah penyesuaianIndah Rohmatullah
 
Ratio analysis theory-prime
Ratio analysis  theory-primeRatio analysis  theory-prime
Ratio analysis theory-primeSahil Shaikh
 
Account receivable manager
Account receivable managerAccount receivable manager
Account receivable managerhughjackman261
 
Receivables
ReceivablesReceivables
Receivablesmscuttle
 
Account receivable presentation
Account receivable presentationAccount receivable presentation
Account receivable presentationckeebakhattak
 

Viewers also liked (6)

Ppt bab 11 neraca saldo setelah penyesuaian
Ppt bab 11 neraca saldo setelah penyesuaianPpt bab 11 neraca saldo setelah penyesuaian
Ppt bab 11 neraca saldo setelah penyesuaian
 
Ratio Analysis
Ratio AnalysisRatio Analysis
Ratio Analysis
 
Ratio analysis theory-prime
Ratio analysis  theory-primeRatio analysis  theory-prime
Ratio analysis theory-prime
 
Account receivable manager
Account receivable managerAccount receivable manager
Account receivable manager
 
Receivables
ReceivablesReceivables
Receivables
 
Account receivable presentation
Account receivable presentationAccount receivable presentation
Account receivable presentation
 

Similar to Accounts Receivable Turnover Ratio

Excel charts lesson 8
Excel charts lesson 8Excel charts lesson 8
Excel charts lesson 8Tellez16
 
Excel charts lesson 8
Excel charts lesson 8Excel charts lesson 8
Excel charts lesson 8Tellez16
 
Interim report January – June 2011
Interim report January – June 2011Interim report January – June 2011
Interim report January – June 2011Sweco
 
Middlesex Water Company Shareholder Presentation
Middlesex Water Company Shareholder PresentationMiddlesex Water Company Shareholder Presentation
Middlesex Water Company Shareholder PresentationCompany Spotlight
 
Supplemental Fourth Quarter 2005 Financial Information
	Supplemental Fourth Quarter 2005 Financial Information	Supplemental Fourth Quarter 2005 Financial Information
Supplemental Fourth Quarter 2005 Financial InformationQuarterlyEarningsReports3
 
Lesson 8 excel and survey’s rsj p.2
Lesson 8 excel and survey’s rsj p.2Lesson 8 excel and survey’s rsj p.2
Lesson 8 excel and survey’s rsj p.2Ramon Sahagun
 
School disctrict powerpoint
School disctrict powerpointSchool disctrict powerpoint
School disctrict powerpointStephanie Perez
 
Team b wk 6
Team b wk 6Team b wk 6
Team b wk 6Jay Glow
 
Team b wk 6
Team b wk 6Team b wk 6
Team b wk 6Jay Glow
 
pint state.ia.us tax forms educate
pint state.ia.us tax forms  educatepint state.ia.us tax forms  educate
pint state.ia.us tax forms educatetaxman taxman
 
Lesson 8 excel and survey’s
Lesson 8 excel and survey’sLesson 8 excel and survey’s
Lesson 8 excel and survey’sRamon Sahagun
 
Lesson 8 excel and survey’s rsj
Lesson 8 excel and survey’s rsjLesson 8 excel and survey’s rsj
Lesson 8 excel and survey’s rsjRamon Sahagun
 
Lesson 8 excel and survey’s
Lesson 8 excel and survey’sLesson 8 excel and survey’s
Lesson 8 excel and survey’sRamon Sahagun
 
A Statistical Analysis of the Performance of Castleton State College's Sports...
A Statistical Analysis of the Performance of Castleton State College's Sports...A Statistical Analysis of the Performance of Castleton State College's Sports...
A Statistical Analysis of the Performance of Castleton State College's Sports...Bryce Kaler
 

Similar to Accounts Receivable Turnover Ratio (20)

Excel charts lesson 8
Excel charts lesson 8Excel charts lesson 8
Excel charts lesson 8
 
Excel charts lesson 8
Excel charts lesson 8Excel charts lesson 8
Excel charts lesson 8
 
Interim report January – June 2011
Interim report January – June 2011Interim report January – June 2011
Interim report January – June 2011
 
Middlesex Water Company Shareholder Presentation
Middlesex Water Company Shareholder PresentationMiddlesex Water Company Shareholder Presentation
Middlesex Water Company Shareholder Presentation
 
Graphs CHSZ
Graphs CHSZGraphs CHSZ
Graphs CHSZ
 
Supplemental Fourth Quarter 2005 Financial Information
	Supplemental Fourth Quarter 2005 Financial Information	Supplemental Fourth Quarter 2005 Financial Information
Supplemental Fourth Quarter 2005 Financial Information
 
Lesson 8 excel and survey’s rsj p.2
Lesson 8 excel and survey’s rsj p.2Lesson 8 excel and survey’s rsj p.2
Lesson 8 excel and survey’s rsj p.2
 
School disctrict powerpoint
School disctrict powerpointSchool disctrict powerpoint
School disctrict powerpoint
 
Team b wk 6
Team b wk 6Team b wk 6
Team b wk 6
 
Team b wk 6
Team b wk 6Team b wk 6
Team b wk 6
 
Sample Budget
Sample BudgetSample Budget
Sample Budget
 
pint state.ia.us tax forms educate
pint state.ia.us tax forms  educatepint state.ia.us tax forms  educate
pint state.ia.us tax forms educate
 
Graphs 12345 12345
Graphs 12345 12345Graphs 12345 12345
Graphs 12345 12345
 
Lesson 8 excel and survey’s
Lesson 8 excel and survey’sLesson 8 excel and survey’s
Lesson 8 excel and survey’s
 
Lesson 8 excel and survey’s rsj
Lesson 8 excel and survey’s rsjLesson 8 excel and survey’s rsj
Lesson 8 excel and survey’s rsj
 
Lesson 8 excel and survey’s
Lesson 8 excel and survey’sLesson 8 excel and survey’s
Lesson 8 excel and survey’s
 
Redux at mart v1
Redux at mart v1Redux at mart v1
Redux at mart v1
 
2010 HAR REALTOR® Expo- Ted Jones, PhD
2010 HAR REALTOR® Expo- Ted Jones, PhD2010 HAR REALTOR® Expo- Ted Jones, PhD
2010 HAR REALTOR® Expo- Ted Jones, PhD
 
St louis parcel negotiating 2012
St louis parcel negotiating 2012St louis parcel negotiating 2012
St louis parcel negotiating 2012
 
A Statistical Analysis of the Performance of Castleton State College's Sports...
A Statistical Analysis of the Performance of Castleton State College's Sports...A Statistical Analysis of the Performance of Castleton State College's Sports...
A Statistical Analysis of the Performance of Castleton State College's Sports...
 

Accounts Receivable Turnover Ratio