1. N AT I O N A L C E N T E R F O R P O L I C Y A N A LY S I S
Solar Power Prospects
Policy Report No. 334 by H. Sterling Burnett May 2011
The production of electricity from renewable energy technologies is growing much faster
than the electric power supply as a whole, and solar power is among the fastest growing
segments of the renewable energy market. Public policy concerns and economics are
driving this growth. Some analysts and politicians believe that increasing solar power
use will enhance U.S. national security by reducing dependence on imported energy —
primarily oil from the Organization of Petroleum Exporting Countries (OPEC) and Russia.
Executive Summary
The production of electricity from renewable energy technologies is growing
much faster than the electric power supply as a whole. Solar power is among
the fastest growing segments of the renewable energy market. Centralized
solar power is produced on large farms and fed into an electrical grid — a
network of wires and transformers that allows electricity produced by multiple
sources to be transported to industrial, commercial and residential consumers.
Globally, grid-connected solar capacity increased an average of 60 percent
annually from 2004 to 2009, faster than any other energy source. Solar
electricity production grew 15.5 percent in 2009 alone. Today, however, solar
power still accounts for less than one-half of one percent of the world’s electric
Dallas Headquarters: power output.
12770 Coit Road, Suite 800
Dallas, TX 75251
Despite its impressive growth, and even with significant subsidies, solar
972.386.6272 power is substantially more expensive than conventional power sources in
Fax: 972.386.0924 most locations. This is true of solar thermal systems that use lenses or mirrors
www.ncpa.org
and tracking systems to focus sunlight into a small beam to heat a fluid that
turns steam-powered turbines. It is also true of solar photovoltaic power, in
Washington Office: which panels or modules of cells fabricated from semiconducting materials
601 Pennsylvania Avenue NW, generate electrical power by converting solar radiation into direct-current
Suite 900, South Building
Washington, DC 20004
electricity. This study focuses on solar photovoltaic (“solar”), the more mature,
202.220.3082 more widespread and historically easier to build form of solar generation.
Fax: 202.220.3096 Analysts agree that if solar is to become a significant power source, it
must compete with other energy sources — in markets without subsidies to
ISBN #1-56808-212-6
any form of energy, barriers to the entry of new producers or discriminatory
www.ncpa.org/pub/st334
price regulations. When the price at which customers in a particular area can
purchase electricity generated by solar power is about the same as the aver-
age price of electricity generated by conventional sources, it is said to have
reached grid parity.
U.S. Energy Subsidies Are Substantial. In the United States, federal
energy subsidies have amounted to hundreds of billions of dollars. Refined
coal receives more subsidies than any other single energy source. According to
a 2008 Energy Information Administration (EIA) report:
2. Solar Power Prospects
■■ Federal subsidies to all energy sources topped to determine the dollar value of the energy that could be
$16.6 billion in 2007 alone, more than double the produced in a city, based on current average electric prices
$8.2 billion spent in 1999. in that state. Other factors, such as the derate — the per-
centage of a cell’s rated output capacity that it will actually
■■ Nonrenewable energy sources, including fossil
produce — can also be input. The result is a measure of the
fuels and nuclear power, received the majority of
revenue potential of the installation.
subsidies — slightly more than $6.7 billion.
Using the PVWatts calculator, at what price might solar
■■ By comparison, renewable fuels including solar,
become profitable? For example, take a 1,000 kilowatt
hydroelectric, wind, biofuels and geothermal,
system, with construction and installation financed at a 6.25
received $4.8 billion.
percent interest rate. The cost of the project would depend
In addition, some states have subsidies and mandates for on the price of solar panels. At an installed cost of $3.90 per
renewable energy. Currently, subsidized solar energy costs watt, the project would cost $3.9 million. At $2.50 per watt,
between $0.22 per kilowatt-hour and $0.30 per kilowatt- the project would cost $2.5 million. At $1.50 per watt, the
hour, according to independent analyses. By contrast, project would cost $1.5 million. Using three different prices
the average cost of electricity nationwide is expected to for the solar cell modules in a selection of 13 U.S. cities:
remain roughly $0.11 per kilowatt-hour through 2015, ■■ At a cost of $3.90 per watt, only Hawaii generates
according to an August 2010 White House report. enough income to cover its annual loan payments.
Solar Power Has Reached Parity in Some Areas. ■■ At $2.50 per watt and the higher 0.825 derate
The price point for grid parity varies by location, due to factor, San Diego also barely covers its note.
such factors as the amount of sunlight an area receives, the
orientation of the solar array, whether the solar arrays are By contrast, when solar panels reach $1.50 per watt, sev-
fixed or track the sun, construction costs, rate structure and en of the cities examined generate enough income to cover
financing options. As a result, according to the National their financing even at the lower derate factor; as the derate
Renewable Energy Laboratory, breakeven costs vary by factor improves, eight cities can cover their loan payments.
more than a factor of 10 in the United States. Thus: These scenarios are consistent with projections of future
energy costs by the International Energy Agency (IEA) in
■■ Solar power has already reached grid parity in 2010. The IEA concluded that:
Hawaii, where the average price for electricity
was $0.25 per kilowatt-hour in 2010 — with ■■ Over the next decade, with continued government
the average residential price topping $0.28 per support, solar power prices will decline sufficiently
kilowatt-hour. to compete with conventional electric retail
prices in a “few” countries by 2015 and “several”
■■ In some parts of the country, solar may approach countries by 2020.
grid parity soon.
■■ The IEA projects that the cost of solar electricity in
■■ In other locations, such as Arizona, that have 2020 will range from $0.13 to $0.26 per kilowatt-
abundant sunlight but limited transmission access hour for commercially produced solar power
and low electricity prices, solar is not competitive. and $0.16 to $0.31 for electricity produced by
Solar Power Must Be Profitable in Order to Com- residential systems.
pete. Most analysts agree that solar will reach grid parity in ■■ If the IEA’s estimates are correct, the price of
a wide range of locations if the price for solar panels falls solar power will still be higher than the cost of
toward $1 per watt. Indeed, at $1.50 per watt, solar might conventionally produced electricity in 2020.
be competitive with conventional generation sources in
With major technological breakthroughs that signifi-
locations with a combination of high average electric costs
cantly reduce the cost of solar power production and the
and/or good average sunlight — producing power at $0.10
imposition of new environmental mandates that raise the
to $0.15 per kilowatt-hour.
price of electricity generated by other sources, solar could
An online calculator called PVWatts, developed by reach grid parity in some areas of the United States by the
the National Renewable Energy Laboratory, can be used end of the decade.
2
3. Introduction efficiency, reducing the cost of solar study, the price of electricity from
panels considerably. newly constructed solar facilities
The production of electricity will be compared with prices from
from renewable energy technologies However, in most locations
other new generating sources.
is growing much faster than the solar is still substantially more
electric power supply as a whole, expensive than conventional power This study will also consider:
and solar power is among the sources. Analysts agree that if solar What would be necessary for solar
fastest growing segments of the is to become a significant power power to compete as a significant
renewable energy market. Public source, it must compete with other energy source with other new
policy concerns and economics energy sources — in markets sources of electric power? When is
are driving this growth. Some without subsidies to any form of widespread parity likely? When will
analysts and politicians believe energy, barriers to the entry of new the annualized cost of solar power
that increasing solar power use will producers or discriminatory price be competitive with other sources
enhance U.S. national security by regulations. When the price at of electric power over the life of the
reducing dependence on imported which customers in a particular area generation facility?
energy — primarily oil from can purchase electricity generated
by solar power is about the same In Hawaii, for example, due to
the Organization of Petroleum favorable climatic conditions and
Exporting Countries (OPEC) and as the average price of electricity
generated by conventional sources, high energy costs, solar power,
Russia. Environmentalists argue with present subsidies, is already
that solar power will improve air it is said to have reached grid parity.
cost competitive with electricity
quality by reducing the use of from other sources. In other areas
fossil fuels — primarily coal — for with a combination of consistently
electric power production. They sunny days and high energy costs,
claim this would reduce emissions “Solar power has grown solar power could become cost
of a variety of air pollutants, competitive as additional power to
including greenhouse gases. rapidly, but still accounts
the grid by, say, late in this decade.
Insert callout here.
for less than one-half of However, analysis of the available
These concerns have led to 1 percent of U.S. evidence indicates that unless
favorable tax treatment, price electricity output.” the substantial subsidies recently
supports and direct subsidies for available in the United States and in
renewable energy by both federal Europe are continued, widespread
and state governments. Some grid parity for solar power is a
states have implemented mandates decade or more away.
— called renewable portfolio It is important to compare the
standards — for production and/or projected cost of solar power Note that regulations that affect
use of electricity from renewables. from new installations with power the costs and viability of energy
Tens of billions of dollars in public generated from new conventional production are in constant flux.
spending and renewable energy power plants rather than existing Some environmental regulations
mandates have encouraged private conventional plants. Power — such as increasingly stringent
investment in solar power. Indeed, generators already in operation air pollution limits, for example
in the United States, solar electricity represent sunk costs, and the — will raise the costs of fossil
production grew 55 percent from capital costs to build those plants fuels, especially in comparison to
2004 to 2008, and 15.5 percent in have been partially or completely solar and other energy sources.
2009 alone.1 Today, however, solar amortized. Since new solar power Other regulations might never be
power still accounts for less than plants will compete with other implemented. Thus, in this study,
one-half of one percent of U.S. renewable energy sources, new it is assumed that current laws and
electric power output. Public and fossil fuel plants and new nuclear standards will continue. It is on
private investment has encouraged facilities, the costs of new power that basis that the future price of
innovation and increased production plants should be compared. In this electricity generated by fossil fuel
3
4. Solar Power Prospects
and nuclear powered plants will be ■■ Between 2004 and 2009, Solar photovoltaic is a more mature
compared with solar power. grid-connected solar capacity technology, easier to build and
increased an average of 60 in much wider use. Most recent
Solar Power Output, percent annually, to some 21 solar power installations are
gigawatts (21 billion watts — solar photovoltaic. Thus, unless
Technology and or units of electric power).3 otherwise noted, in this study
Efficiency ■■ As of 2010, solar power “solar” refers to solar photovoltaic.
Earth receives more energy
generated electricity in more Solar Cell Technology. There
than 100 countries. are two main types of solar
from the sun in one hour than the
amount of energy the world uses This paper focuses on centralized photovoltaic technologies: silicon
in one year. The amount of solar solar power production. Off-grid wafer and thin film. Silicon wafer
energy reaching the surface of the photovoltaic, such as rooftop panels technology is the one used in most
planet in one year is about twice that generate power for on-site solar power plants. Indeed, silicon
as much as will ever be obtained consumption, accounts for an wafer makes up 82 percent of the
from all of Earth’s nonrenewable additional 3 to 4 gigawatts. installed solar market.6 Thin film is
resources of coal, oil, natural gas less expensive, and accounts for a
and mined uranium combined.2 growing share of the market. Sales
Even under the best circumstances, of thin film are growing 50 percent
only a small part of this energy per year, while silicon wafer solar
would be available for solar power is growing approximately 30
use, because much of it is naturally “Earth receives more percent per year. This paper focuses
consumed by plant photosynthesis. energy from the sun in one on common silicon wafer panels
But this small amount could,
Insert callout here.
hour than the amount the or modules, rather than thin film
in theory, be transformed into a world uses in one year.” technologies, because silicon wafers
significant amount of electricity. convert sunlight to electricity more
efficiently and therefore will likely
Solar Power Output. Solar continue to dominate the market:
power includes both centralized and
decentralized solar power sources ■■ Silicon wafer technologies
and different technologies for Thermal versus Photovoltaic convert 13 percent to 20
generating power (which includes Solar. Two main types of solar percent of the sunlight hitting
electricity and heat). Centralized power are used to produce them into electricity whereas
solar power is produced on large electricity. Thermal solar power thin film technologies often
farms and fed into an electrical systems generally use lenses or convert just 4 percent.7
grid — a network of wires and mirrors and tracking systems to
transformers that allows electricity ■■ Under artificial laboratory
focus a large area of sunlight into conditions, research scientists
produced by multiple sources a small beam to heat a fluid that
to be transported to industrial, have produced 41 percent
turns steam-powered turbines.4 The conditions from certain types
commercial and residential most familiar solar technology,
consumers. Globally, solar-powered of layered solar cells, but such
however, is solar photovoltaic advances will not be available
electricity production has grown in technology used to produce
recent years: commercially for years.
electricity in calculators, yard
■■ Solar power is a tiny frac- lights and rooftop panels. Solar ■■ Absent a significant
tion of the 4,800 gigawatt panels consist of a number of cells technological breakthrough,
total global electricity fabricated from semiconducting the inherent physical char-
generating capacity, but it materials that generate electrical acteristics of crystal silicon
is the fastest growing power by converting solar radiation mean that energy conversion
technology in the world. into direct-current electricity.5 will top out at 30 percent.8
4
5. Solar cells last 20 to 25 years; price ceilings on oil and Refined coal receives more
however, even if solar panels are gas consumed in countries subsidies than any other single
cleaned periodically to maintain like Bolivia, Venezuela and energy source — mostly tax credits
peak efficiency, output declines by Iran — according to the for research and development of
approximately 0.5 percent per year. Global Subsidies Initiative, so-called clean coal, carbon-capture
Thus, after 20 years they will only a collaborative effort of the and storage technologies, and
produce 80 percent of their rated environmentalist Institute for synthetic fuels from coal to improve
capacity. Less efficient cells may Sustainable Development and air quality, lower carbon emissions
cost less per module, but are not the Earth Council.10 or reduce energy dependence.
necessarily less expensive to use Renewable energy is the second
■■ Subsidies in developed
because more have to be installed to most subsidized energy type, and
countries have shifted from
get the same amount of energy. receives more subsidies than all
fossil fuels and nuclear power
the other (noncoal) fossil fuels and
toward renewable energy
nuclear power combined.
Energy Subsidies sources in recent years — U.S.
subsidies to renewables, for The installed base of solar and
Fossil fuels, nuclear and example, grew from 17 percent other renewables is small compared
renewable energy sources — of total energy subsidies in to fossil fuels. As a result, measured
including solar power — are 1999 to 29 percent in 2007.11 by the energy delivered per dollar
subsidized worldwide. Government of subsidy, solar is among the most
subsidies tend to encourage ■■ More recently, from 2008 to
highly subsidized power sources.
increased investment in production 2009, renewable energy sub-
According to the EIA:
and/or reduce the cost of a sidies increased from approxi-
good or service to consumers. mately $46 billion worldwide ■■ Natural gas and petroleum
The cost of subsidies are less to more than $57 billion.12 subsidies amount to $0.25 per
visible than the lower prices megawatt-hour of electricity
U.S. Energy Subsidies. In
paid by consumers. They include produced.
the United States, federal energy
costs to taxpayers and market subsidies have amounted to hun- ■■ Coal subsidies amount to
distortions, which tend to protect dreds of billions of dollars. Accord- $0.44 per megawatt-hour.
less efficient technologies and ing to a 2008 Energy Information ■■ Biomass (including biofuels)
reduce or undermine innovation. Administration (EIA) report:13 subsidies amount to $0.89 per
Global Energy Subsidies. ■■ Federal subsidies to all energy megawatt-hour.15
Globally, fossil fuels are the most sources topped $16.6 billion in
heavily subsidized energy source: 2007 alone, more than double
the $8.2 billion spent in 1999.
■■ Developing countries annually
■■ Nonrenewable energy sources,
spend $220 billion on subsi-
including fossil fuels and “Refined coal receives
dies for all forms of energy, of
nuclear power, received the more federal subsidies
which more than $170 billion
is spent on fossil fuel subsi- majority of subsidies — Insertany other single
than callout here.
dies, according to International slightly more than $6.7 billion. energy source.”
Energy Administration ■■ By comparison, renewable fu-
(IEA) estimates.9 els including solar, hydroelec-
■■ Worldwide energy subsidies tric, wind, biofuels and geo-
topped $490 billion in thermal, received $4.8 billion.
By contrast:
2007 — of which more than Most federal energy subsidies
$400 billion were fossil ($10.4 billion) are tax expenditures ■■ Nuclear power subsidies
fuel subsidies in developing (tax credits and other preferences) amount to $1.59 per megawatt-
countries and mostly through rather than direct expenditures.14 hour of electricity produced.
5
6. Solar Power Prospects
■■ Wind subsidies amount to was in states with mandatory Long-Distance Transmission
$23.37 per megawatt-hour. renewable portfolio standards. Lines. Locations for centralized
■■ Since 2002, 60 percent of photovoltaic solar farms are
■■ Solar subsidies amount to somewhat limited. They require
$24.34 per megawatt-hour.16 the renewable additions
have been in states with much more land than conventional
State Subsidies and Indirect mandatory standards. electric power plants to produce
Subsidies. A majority of states the same amount of electricity. The
■■ In 2007 alone, approximately land must be relatively inexpensive
and many localities subsidize 76 percent of all nonhydro
various forms of renewable energy since it is an additional cost. In
renewable capacity addition, solar farms must be in
production. These subsidies additions were in states
include state grants, tax incentives, sunny areas, and they receive more
with these programs.18 energy closer to the tropic zones.
electricity purchase provisions, and
rebates or property tax deductions In order to diversify supplies, Though solar panels generate
for home photovoltaic installations. states are increasingly encouraging some power on overcast days, too
or requiring utilities to meet a much rain or too many cloudy
State Renewable Portfolio portion of their portfolio standard days reduce the amount of power
Standards. State renewable through renewable technologies generated below the level needed
portfolio standards have proliferated or applications that are often to cover costs and increases the
since the 1990s and, along with more costly. This support includes variability of the power supplied.19
federal subsidies, have become the credit multipliers, which give Thus, solar farms are usually
key driver of U.S. renewable energy favored renewables more credit located hundreds or even thousands
growth. By 2008, 25 states and the toward the requirements than of miles from the cities and suburbs
District of Columbia had mandatory other technologies, and specific where the power is consumed.
renewable power standards for set-asides, in which some fraction
electricity providers, and four more The cost of high-voltage
of the portfolio must be met with power lines to carry power long
states had nonbinding goals.17 The favored technologies.
standards vary, but generally require distances tops $1.5 million per
retail electric suppliers to provide mile, assuming flat, rural terrain.20
a minimum quantity or percentage Obtaining permits and rights of way
of electric power from renewable increases the cost. In addition, if
resources. In many states, the terrain is hilly, mountainous or
“State portfolio standards forested, the cost can rise to 1.2 to
requirements increase over time.
and federal subsidies are 1.5 times the average cost.21 Power
Renewable portfolio standards
Insert callout here.
key drivers of renewable lines have to be built at least to
are, in one sense, more powerful energy growth.” the nearest main transmission line,
than subsidies. Subsidies only which may have to be upgraded
encourage utilities, firms and to handle the additional flow and
individuals to adopt, develop or to regulate the variability of solar
use renewable power, but portfolio power. For example, thousands of
standards require electric suppliers miles of new power line would have
to purchase (and thus consumers to Both centrally generated and to be constructed at a cost of tens of
pay for) renewable, regardless of distributed (residential) solar billions of dollars to deliver power
the cost. This strategy appears to be generation have especially benefited from Midwest solar farms to East
working: from such set-asides. Indeed, 12 and West coast cities.
of the 26 U.S. renewable portfolio
■■ Over 50 percent of the standard programs have set-asides Renewables benefit from
nonhydro renewable capacity for solar power, and four of these subsidies for the construction
added in the United States states combine set-asides with some of new transmission lines
from 1998 through 2007 form of credit multipliers. and associated infrastructure.
6
7. Traditionally, public or private extended losses of power. Passing have been made in the past. [See
utilities built the transmission clouds only affect a few panels or the sidebar, “Solar Power: Promises
lines serving a particular area and small portions of the full array at a and Subsidies.”] When are these
passed on the cost to customers. time. Even on days with little wind, more recent predictions likely to
However, at the behest of the if clouds are sporadic, large solar come true?
renewable power industry and arrays produce near rated capacity.24
Currently, subsidized solar
with the support of the Obama
energy costs between $0.22
administration, the Federal Energy
per kilowatt-hour and $0.30
Regulatory Commission (FERC)
per kilowatt-hour, according to
has drafted a rule that could “The Obama independent analyses.33 Projections
basically nationalize transmission administration predicts of future energy costs by the
infrastructure development costs
by requiring either taxpayers Insert callout solar
electricity from here. International Energy Agency (IEA)
in 2010 indicate that:
or electric power consumers to power will be price
pay for new transmission lines competitive by 2015.” ■■ Over the next decade, with
to bring remote wind and solar continued government
power to the national grid.22 support, solar power prices
Governors throughout the will decline sufficiently to
compete with conventional
country object to the plan. A When Will Solar electric retail prices in a “few”
joint letter from the governors of
Arizona, Nevada, Washington, Power Reach countries by 2015 and
Oregon and California says that it “several” countries by 2020.
Grid Parity?
would be “inappropriate to assess ■■ The IEA projects that the
the cost of transmission build-out A common theme in many of cost of solar electricity in
to customers that cannot make use President Obama’s speeches is 2020 will range from $0.13
of the facilities, or who elect not to that government subsidies will to $0.26 per kilowatt-hour for
because they can access more cost make a variety of “clean” energy commercially produced solar
effective options that do not rely on technologies cost competitive. An power and $0.16 to $0.31
large, new transmission investments August 2010 White House report for electricity produced by
to meet environmental goals.”23 singled out solar power produced residential systems.
by rooftop residential installations.
Stabilizing Power. Renewables ■■ If the IEA’s estimates are cor-
also benefit from the availability of In 2009, electricity produced by
rect, the price of solar power
on-demand stabilizing and fill-in such systems cost the equivalent of
will still be higher than the cost
power from other sources. Fossil more than $0.21 per kilowatt-hour
of conventionally produced
fuel or nuclear-powered generating (including installation but not
electricity, and thus solar will
plants run as spinning reserve at less maintenance costs), whereas the
not reach grid parity in much
than peak efficiency in order to be average retail price of electricity
of the United States by 2020.
brought on-line if the variable flow nationwide was $0.11 per kilowatt-
from a solar farm falls precipitously hour.25 However, the report predicts However, the price point for
over a short period of time. Some the average cost of residential solar grid parity varies by location,
portion of these plants’ cost should will fall to $0.10 per kilowatt-hour due to such factors as the amount
be counted against the solar facility by 2015, while the average cost of of sunlight an area receives, the
since they make it possible. electricity nationwide will remain orientation of the solar array,
roughly $0.11 per kilowatt-hour. whether the solar arrays are fixed
However, at locations where solar This would be grid parity. Other or track the sun, construction
is ideal or nearly ideal, the larger administration studies make similar costs, rate structure and financing
the array, the less problem there is claims for commercially produced options. As a result, according to
with power spikes or significant, solar power. Similar predictions the National Renewable Energy
7
8. Solar Power Prospects
Laboratory, breakeven costs vary
by more than a factor of 10 in the
Solar Power: Promises and Subsidies United States.34 Thus:
Harnessing sunlight for heating and other power purposes is not new.
Solar collection devices were developed in the 17th century to protect ■■ Solar power has already
plants brought from the tropics to northern countries, and both the first reached grid parity in
solar water heater and the first solar oven were developed the 18th Hawaii, where the average
century. Indeed, the solar power revolution has been on the verge of price for electricity was
taking off for centuries.26 $0.25 per kilowatt-hour in
In response to the Arab Oil Embargo, in part, the relatively new 2010 — with the average
U.S. Department of Energy (along with other agencies) began a residential price topping
slew of programs to fund solar energy research, deployment and $0.28 per kilowatt-hour.
commercialization. Based strictly on performance, these programs ■■ In some parts of the
have failed at the cost of billions of dollars of taxpayers’ money. country, solar may approach
No one has ever lost money betting against the predictions that grid parity soon.
widespread, cost-competitive solar power was just “a few years”
away.27 The hyping of solar power’s near-term potential as a source of In other locations, such as
electricity increased exponentially with the advent of large government Arizona, that have abundant
grants and subsidies for solar power research in the 1970s. In 1976, sunlight but limited transmission
for example, noted environmental author Barry Commoner stated access and low electricity prices,
that mixed solar/conventional installations could become the most solar is not competitive.35
economical alternative in most parts of the United States within the
next few years.28 In 1987 the head of the Solar Energy Industries What Is the
Association stated: “I think frankly, the…consensus as far as I can see
is after the year 2000, somewhere between 10 and 20 percent of our Breakeven Cost of
energy could come from solar technologies, quite easily.”29
Solar Power?
Why haven’t these and other similar predictions come true? The
answer of many advocates has been simple: inadequate government In order to determine whether a
support. solar power plant is competitive in a
particular area, one must determine
A 1983 study by the Booz Allen Hamilton consulting firm for the if the electricity it produces can
Solar Energy Industries Association, the American Wind Energy
be sold at a profit, given average
Association and the Renewable Energy Institute found that solar and
electric power prices in the region,
wind technologies would become competitive and self-supporting
by the end of the 1980s, if “assisted by tax credits and augmented by the amount of power the plant could
federally sponsored R&D [research and development].”30 Just three produce and capital costs (including
years later, long-time green energy booster Amory Lovins, of the interest) of construction.
Rocky Mountain Institute, decried what became a temporary scaling The Photovoltaic Watts
back of tax breaks for renewable energy, since the competitive viability Calculator. An online calculator
of wind and solar technologies was “one to three years away.”31 And called PVWatts, developed by
in 1990, with sufficient government support, the Worldwatch Institute the National Renewable Energy
predicted an almost complete displacement of fossil fuels for the Laboratory, allows nonexperts
electric power generation market by approximately 2010.32 to quickly obtain performance
It seems hardly fair, however, to claim that solar power has failed estimates for grid-connected
to reach widespread commercialization in the marketplace due to lack photovoltaic systems. The PVWatts
of subsidies since, by some measures, solar power is one of the most calculator shows the dollar value of
highly subsidized power sources on Earth. the energy that could be produced
in a city, based on current average
electric prices in that state. This is a
8
9. TABLE I
Hypothetical Solar Power Plant Revenue for Select Cities
Average State Price
City per Kilowatt Hour At 0.77 Derate* At 0.825 Derate*
El Paso, Texas 9.36 ¢ $155,097 $166,285
Austin, Texas 9.36 ¢ $127,528 $136,849
Bridgeport, Conn. 17.42 ¢ $208,172 $223,533
Columbus, Ohio 9.13 ¢ $102,665 $110,254
San Diego, Calif. 13.97 ¢ $209,339 $224,528
Miami, Fla. 10.61 ¢ $142,098 $152,549
Nashville, Tenn. 8.66 ¢ $110,636 $118,763
Phoenix, Ariz. 9.78 ¢ $158,138 $169,522
Anchorage, Alaska 14.86 ¢ $117,998 $126,953
Honolulu, Hawaii 25.03 ¢ $365,423 $392,157
New York, N.Y. 16.37 ¢ $199,459 $214,172
Charleston, W. Va. 7.42 ¢ $ 83,975 $ 90,185
Rapid City, S.D. 7.78 ¢ $109,547 $117,543
* The percentage of rated capacity a solar power plant is expected to produce.
Source: National Renewable Energy Laboratory, “PVWatts Calculator,” available at http://www.nrel.gov/rredc/pvwatts/, and
author’s calculations.
measure of the revenue potential of conditions. The average cost of the old PVWatts factor. This derate
the installation. electricity for each state is the also accounts for the fact that some
most recent estimate from the U.S. solar farm developers might use
The calculator automatically Department of Energy. higher rated (but more expensive)
adjusts for a number of variables, equipment, while others use less
It is necessary to consider two
including the type of solar power expensive, less efficient solar
system (fixed axis versus tracking), scenarios to account for the fact
arrays. As Table I shows, the dollar
the average amount of sunlight in that a solar cell will deliver less
value of the electricity produced by
a particular area and the angle of power than its rated capacity,
solar power varies dramatically by
the sun. Note, however, that the due to such factors as dust and
region and, more importantly, by
PVWatts calculations do not include dirt, shade and power losses in
the average price of electric power
the operating and maintenance the wiring. This “derate factor”
in a state:
costs of the systems (see additional is a percentage of the cell’s rated
capacity. The first scenario uses ■■ Due to high energy prices and
considerations below).
PVWatts’ default derate factor of favorable climatic conditions,
Solar Competition under 0.77. The PVWatts derate factor is a 1,000 kilowatt solar array
Two Scenarios. Following are still commonly used, but it has not in Hawaii delivers the highest
two exercises using the PVWatts been updated since 2007. Some dollar value of electricity in a
calculator, for a 1,000 kilowatt (1 solar cell manufacturers now claim year, ranging from $365,423 to
megawatt) system using a fixed a 0.90 derate factor. The second $392,157.
array at various locations, with a scenario adjusts the PVWatts derate ■■ Low electric power prices
wide range of energy costs, and to 0.825, splitting the difference and less available sunlight
different geographic and climatic between manufacturers’ claims and on average means that a
9
10. Solar Power Prospects
TABLE II
Annual Revenue Net of Capital Costs for a
Solar Power Plant in Various Cities
(Installed Capital Cost of $3.90 per Watt)
City Annual Financing Cost* 0.77 Derate 0.825 Derate
El Paso, Texas $348,928.20 -$193,831.20 -$182,643.20
Austin, Texas $348,928.20 -$221,400.20 -$212,079.20
Bridgeport, Conn. $348,928.20 -$140,756.20 -$125,395.20
Columbus, Ohio $348,928.20 -$246,263.20 -$238,674.20
San Diego, Calif. $348,928.20 -$139,589.20 -$124,400.20
Miami, Fla. $348,928.20 -$206,830.20 -$196,379.20
Nashville, Tenn. $348,928.20 -$238,292.20 -$230,165.20
Phoenix, Ariz. $348,928.20 -$190,790.20 -$179,406.20
Anchorage, Alaska $348,928.20 -$230,930.20 -$221,975.20
Honolulu, Hawaii $348,928.20 $ 16,494.80 $ 43,228.80
New York, N.Y. $348,928.20 -$149,469.20 -$134,756.20
Charleston, W. Va. $348,928.20 -$264,953.20 -$258,743.20
Rapid City, S.D. $348,928.20 -$239,381.20 -$231,385.20
*Note: $3,900,000 loan at 6.5 percent interest.
Source: National Renewable Energy Laboratory, “PVWatts Calculator,” available at http://www.nrel.gov/rredc/pvwatts/, and
author’s calculations.
1,000 kilowatt array in West The 2008 decline in incentives shift in production of solar panels to
Virginia generates less was reversed, and their value rose China caused the cost per kilowatt-
than $100,000 a year. in 2009 and 2010. hour for solar cells to fall:38
Installed Cost per Watt. The The lower the price for ■■ In 2009, the average installed
cost of new solar power plants fell solar materials, assembly and cost of solar cells fell to $3.90
and rose in recent years along with construction, the greater the net per watt and in some cases
incentives, subsidies, mandates and revenue at any electric power price nearly fell to $2.33 per watt.
other policies that encourage solar point. Solar panels can make up
power use: nearly half the cost of solar systems. ■■ The cost of solar photovoltaic-
■■ For commercial solar, the Over the past 15 years, the cost generated electricity in sunny
installed cost of solar with of solar photovoltaic systems fell locations would have been
incentives fell from $5.50 per an average of 4 percent per year, approximately $0.22 to $0.25
watt to $3.60 per watt in 2006. whereas the price of electric power per kilowatt-hour in 2009,
has generally risen. In 2009 alone, absent subsidies and incentives
■■ By 2008 the installed cost prices for solar panels dropped — well above the average
rose to $4.80 per watt as cash approximately 40 percent, notes residential price of electric
incentives and government Navigant Consulting.37 The most power in most locations.
subsidies declined.36 recent steep decline is due largely to
■■ Net of incentives, installed the tremendous growth in China’s However, in 2009, as wages in
costs ranged from $7.30 per solar panel production, which China rose, and higher priced panel
watt to $9.90 per watt in 2008. resulted in a glut in the market. This makers in the United States and
10
11. TABLE III
Annual Revenue Net of Capital Costs for a
Solar Power Plant in Various Cities
(Installed Capital Cost of $2.50 per Watt)
City Annual Financing Cost* 0.77 Derate 0.825 Derate
El Paso, Texas $223,671.96 -$ 68,574.96 -$ 57,386.96
Austin, Texas $223,671.96 -$ 96,143.96 -$ 86,822.96
Bridgeport, Conn. $223,671.96 -$ 15,499.96 -$ 138.96
Columbus, Ohio $223,671.96 -$121,006.96 -$113,417.96
San Diego, Calif. $223,671.96 -$ 14,332.96 $ 856.04
Miami, Fla. $223,671.96 -$ 81,573.96 -$ 71,122.96
Nashville, Tenn. $223,671.96 -$113,035.96 -$104,908.96
Phoenix, Ariz. $223,671.96 -$ 65,533.96 -$ 54,149.96
Anchorage, Alaska $223,671.96 -$105,673.96 -$ 96,718.96
Honolulu, Hawaii $223,671.96 $141,751.04 $168,485.04
New York, N.Y. $223,671.96 -$ 24,212.96 -$ 9,499.96
Charleston, W. Va. $223,671.96 -$139,696.96 -$133,486.96
Rapid City, S.D. $223,671.96 -$114,124.96 -$106,128.96
*Note: $2,500,000 loan at 6.5 percent interest.
Source: National Renewable Energy Laboratory, “PVWatts Calculator,” available at http://www.nrel.gov/rredc/pvwatts/, and
author’s calculations.
abroad closed, the flood of low-cost developer obtains financing that able? Take a 1,000 kilowatt system,
panels ebbed. Thus, prices are carries an interest rate higher or with construction and installation
likely to rise. lower than the 6.25 percent rate financed at a 6.25 percent interest
used below, the price per watt rate using three different prices
Most analysts agree that solar at which solar power becomes for installed solar cell modules:
will reach grid parity in a wide profitable also changes. As the 2009 estimated average price
range of locations if the price discussed below, the cost of of $3.90 per watt, $2.50 per watt
for panels falls toward $1 per borrowing to finance large solar and $1.50 per watt. The results are
watt. Indeed, at $1.50 per watt, farms can be considerably higher shown in Tables II, III and IV.
solar might be competitive with than for other electric power
conventional generation sources ■■ At a cost of $3.90 per watt,
developments. In addition, there
in locations with high average only Hawaii generates enough
is the uncertainty of continuing
income to cover its annual loan
electric costs and/or good average subsidies in the current fiscal
sunlight — producing power at payments. [Table II.]
situation. Indeed, some utilities
$0.10 to $0.15 per kilowatt-hour.39 are cancelling their contracts ■■ At $2.50 per watt and the
This is in the range of Obama with solar developers.41 higher 0.825 derate factor, San
administration estimates.40 Diego also barely covers its
Profitability under Differ- note. [Table III.]
Assumed Interest Rate on ent Installed Cost and Derate
Financing. The profit point is Assumptions. In the same cities ■■ By contrast, when solar panels
significantly affected by changes examined using PVWatts, at what reach $1.50 per watt, seven of
in interest rates. If a solar farm price might solar become profit- the cities examined generate
11
12. Solar Power Prospects
TABLE IV
Annual Revenue Net of Capital Costs for a
Solar Power Plant in Various Cities
(Installed Capital Cost of $1.50 per Watt)
City Annual Financing Cost* 0.77 Derate 0.825 Derate
El Paso, Texas $134,203.20 $ 20,893.80 $ 32,081.80
Austin, Texas $134,203.20 -$ 6,675.20 $ 2,645.80
Bridgeport, Conn. $134,203.20 $ 73,968.80 $ 89,329.80
Columbus, Ohio $134,203.20 -$ 31,538.20 -$ 23,949.20
San Diego, Calif. $134,203.20 $ 75,135.80 $ 90,324.80
Miami, Fla. $134,203.20 $ 7,894.80 $ 18,345.80
Nashville, Tenn. $134,203.20 -$ 23,567.20 -$ 15,440.20
Phoenix, Ariz. $134,203.20 $ 23,934.80 $ 35,318.80
Anchorage, Alaska $134,203.20 -$ 16,205.20 -$ 7,250.20
Honolulu, Hawaii $134,203.20 $231,219.80 $257,953.80
New York, N.Y. $134,203.20 $ 65,255.80 $ 79,968.80
Charleston, W. Va. $134,203.20 -$ 50,228.20 -$ 44,018.20
Rapid City, S.D. $134,203.20 -$ 24,656.20 -$ 16,660.20
*Note: $1,500,000 loan at 6.5 percent interest.
Source: National Renewable Energy Laboratory, “PVWatts Calculator,” available at http://www.nrel.gov/rredc/pvwatts/, and
author’s calculations.
enough income to cover their its capital costs at more locations lower operating costs than solar
financing even at the lower and deliver greater income. — until the cost of fuel is factored
derate factor; as the derate in. Still, though low, operations
factor improves, eight cities Additional Considerations. and maintenance do add to the cost
can cover their loan payments. There are a number of caveats to and could push solar into the red
[Table IV.] consider regarding the estimates in those locations where profits
above. at $1.50 per megawatt-hour are
Only in Hawaii, however, do extremely modest.
the solar arrays deliver more than PVWatts calculations do not
$100,000 in value above their include operation and maintenance The profit point is also
annual loan payment. costs of the systems. One of the significantly affected by even
selling points of fixed solar systems modest changes in the interest
The preceding examples used the (as opposed to tracking arrays) is rate obtained by the solar farm
2010 average price of electricity that, at $4.17 per megawatt-hour, developer. If it is higher or lower
for the state of each city examined. its operating costs are lower than than the one chosen for testing,
Electric power prices fell in most any competing energy source.42 then the price per watt at which
of those locations from 2009 to For instance, a solar farm, unlike a minimum profit is obtained
2010. But in almost all instances, nuclear power plant or a coal-fired changes. [See the sidebar,
prices have risen over the past power plant, does not require up to “Financing Electric Power Plants.”]
decade. If average electric power hundreds of highly paid engineers
prices rise, solar power could for its daily operations. Combined Note that the calculations above
generate enough income to cover cycle natural gas plants have even do not include the substantial
12
13. cost involved in permitting,
environmental assessments and land
purchases or leases. They also do Financing Electric Power Plants
not include the cost of transmission Financing costs are important to the viability of solar photovoltaic
lines or the rights of way, the power plants. These cost vary considerably, depending on which type
share of the costs that should be of entity develops the plant.
apportioned to a particular solar
development for redundant power Publicly-Owned Utilities. Publicly-owned utilities include
or spinning reserves, or the costs nonprofit electric cooperatives, and utilities owned by municipalities,
involved with fighting potential states and the federal government. They have guaranteed service
lawsuits aimed at halting the territories and face limited competition, but unlike investor-owned
construction of the solar farm. utilities set their own rates and make their own decisions to build
Land conversion is especially an power plants. A public utility usually finances a project with 100
issue where the use of public land percent debt because it can obtain an interest rate below those charged
is proposed for a solar farm.44 [See to publicly traded corporations due to the very low risk of defaulting
Appendix A, “Environmental and on debt payments, and because the interest it pays is exempt from
National Security Considerations.”] federal or state income taxes.
Investor-Owned Utilities. State utility commissions set electric
Some of these costs would
rates and conditions of service of investor-owned utilities. Investor-
exist for almost any proposed
owned utilities have guaranteed service territories and face limited
new power plant. For instance,
competition. Investor-owned utilities must obtain the approval of
both nuclear and coal-fired power
state utility commissions to build new power plants. Privately-owned
plants have substantial permitting
power plants are financed with a mix of debt and equity. The cost of
and environmental assessment
borrowing is higher because their debt is not tax exempt and they
costs, and each proposed plant has
usually have lower credit ratings. The debt of the average electric
recently faced substantial legal
utility is in the lower tier of investment grade (BBB) bonds.
challenges. In the case of nuclear
power, some states have banned the Independent Power Producers. Most solar energy projects are
construction of new facilities. developed by independent power producers, who sell wholesale power
to utility and industrial buyers. They make their own decisions to build
power plants and, within limits, can sell power at whatever price the
Comparisons of market will bear. They do not have guaranteed service territories and
can face intense competition for power sales. They face more financial
Current and Projected risk than regulated utilities — but can also earn larger profits.
Costs of Solar and However, the debt of independent power producers often falls in
Other Power Plants the speculative category and carriers a higher interest rate. As a result,
even with federal grants covering 30 percent of the construction costs,
The Obama administration and it is difficult for solar companies whose projects have been approved
the most optimistic of solar power to find additional financing.43
proponents argue that solar power
will reach widespread grid parity
in 2013 to 2015. However, recent
and Other Generating Plants. cycle natural gas power plant
studies projecting solar power costs
A 2008 Congressional Research being brought on-line in 2015.45
compared to other types of genera-
Service (CRS) report compared
tion indicate that widespread grid
the current dollar cost of building, The study examined the demand
parity is much further in the future.
operating and maintaining a for and costs of new power plants
A 2008 Projection of the variety of electric power facilities under a variety of conditions,
Cost of Solar Power Systems to the cost of a new combined including higher and lower natural
13
14. Solar Power Prospects
TABLE V
Capital Cost per Kilowatt
Advanced IGCC Natural Solar
Coal* Coal* Gas Nuclear Wind Photovoltaic
National Base Project Cost $2,844 $3,221 $ 978 $5,335 $2,438 $4,755
Anchorage, Alaska $3,890 $4,252 $1,306 $6,208 $3,055 $5,702
Phoenix, Ariz. $2,689 $3,074 $1,005 $5,214 $2,382 $4,461
Los Angeles, Calif. $3,488 $3,858 $1,264 $5,845 $2,744 $5,213
Hartford, Conn. $3,688 $4,057 $1,254 $6,124 $2,602 $5,094
Tampa, Fla. $2,696 $3,078 $ 922 $5,226 $2,387 $4,539
Honolulu, Hawaii $ 0 $ 0 $1,472 $ 0 $3,108 $6,526
New York, N.Y. $3,842 $4,170 $1,650 $6,058 $3,040 $6,494
Cincinnati, Ohio $2,863 $3,246 $ 963 $5,385 $2,393 $4,535
Rapid City, S.D. $2,519 $2,912 $ 902 $5,103 $2,457 $4,363
Knoxville, Tenn. $2,574 $2,965 $ 896 $5,140 $2,329 $4,272
Houston, Texas $2,555 $2,946 $ 893 $5,130 $2,322 $4,274
Charleston, W. Va. $2,791 $3,172 $ 981 $5,298 $2,437 $4,652
* Note: Advanced Pulverized Coal (APC) project cost was estimated, since there were no operating APC plants. IGCC is
Integrated Gasification Combined Cycle (IGCC) Coal.
Source: U.S. Energy Information Administration, “Updated Capital Cost Estimates for Electricity Generation Plants,” November
2010. Available at http://tonto.eia.doe.gov/oiaf/beck_plantcosts/index.html.
gas prices, requirements for carbon hour ($255.41) for solar prices, lower financing costs, lower
capture, increases or decreases in photovoltaic was two-and-a capital costs and carbon capture and
capital costs relative to a combined half times more than its nearest storage requirements), solar power
cycle gas power plant (used as competing technology (solar plants had significantly higher
a “base case” for comparison), thermal). annualized costs than competing
and changes in financing terms electricity sources.
relative to natural gas prices. The ■■ It was four times more
expensive than a pulverized Natural gas power plants are
results of the CRS comparison are inexpensive to build relative to
expressed as annualized costs: the coal plant, and more than
two-and-a-half times more other major sources for electricity
present value of the total cost of but the variability of natural gas
building, operating and maintaining expensive than either an
integrated combined cycle coal prices can make the plants a very
an electricity generating facility expensive power source. However,
over its financial life converted to plant, a nuclear power plant or
a land-based wind power plant. the price of natural gas would have
equal annual payments, amortized to rise to and remain at 635 percent
over the expected annual power ■■ It was more than four times as of its 2008 level in order for solar
generation from an expected duty expensive as a combined cycle to match the price of electricity
cycle. Among the results: gas plant. produced by a natural gas plant.
■■ In the base case, the total Even under conditions most The only change the CRS
annualized cost per megawatt- favorable to solar (higher gas examined that raised the cost of
14
15. the other electric power sources including labor costs and inflation. Solar’s annualized cost is
within less than half of the Since many of the EIA’s locations significantly higher than almost
annualized cost of a solar plant were not an exact match to the every other generating technology,
were carbon controls. Assuming cities simulated in the PVWatts due primarily to three factors: a
the government set a requirement calculations above, the in-state low capacity factor (the relatively
that fossil fuel power plants location closest to the comparable small amount of energy it can
capture 90 percent of the carbon PVWatts location is used. As shown be expected to deliver daily), a
produced, the CRS estimates that in Table V: higher than average transmission
solar would still be two-and-a-half cost and a shorter useful life
■■ The projected average capital
times as expensive as its closest than comparable facilities. For
cost for natural gas is $978
rival, integrated combined cycle instance, using EIA data, the
per kilowatt-hour, and the
coal. Under this scenario, if price Institute for Energy Research, a
location-specific estimated cost
were the only consideration, private group that analyzes the
ranges from $893 in Houston,
geothermal power would become economics of energy, estimates:47
Texas, to $1,650 in New York
the electric provider of choice.
City, New York. ■■ The average annualized cost of
A More Recent Projection of an advanced combined cycle
■■ The average cost for wind
the Cost of Solar Power Farms natural gas plant is $63.10 per
power is $2,438 and ranges
and Other Generating Plants. megawatt-hour.
from $2,322 in Houston,
The price of solar cells has fallen
Texas, to $3,108 in Honolulu, ■■ The average annualized cost
considerably since the CRS report.
Hawaii.
Moreover, the efficiency of solar of an advanced nuclear plant is
cells has improved. Thus, recent ■■ The average for solar $113.90 per megawatt-hour.
reports indicate that the cost of photovoltaic power is $4,755
■■ The average annualized cost of
centralized solar has fallen relative and ranges from $4,272 in
an advanced coal-fired power
to other sources. Knoxville, Tenn., to $6,526 in
plant (with carbon capture
Honolulu, Hawaii.
In November 2010, the EIA technology) is $136.20 per
issued “Updated Capital Cost Table V shows that even with megawatt-hour.
Estimates for Electricity Generation increased costs associated with coal,
Plants.” While the costs for nuclear and wind power plants, and ■■ The average annualized cost
natural gas plants remained largely substantial declines in the cost of of a solar photovoltaic plant is
unchanged, the capital costs for solar, there is no location where $210.70 per megawatt-hour.
new coal-fired, nuclear and even solar’s capital costs match or beat Thus, while the average
wind power plants increased any competing electric generating annualized cost of solar power has
considerably — on average, 25 technology, with the exception of declined markedly since 2008 from
percent higher for coal-fired and nuclear power. $255.41 to $210.70, it is still much
nuclear power plants, and 21 more expensive than other electric
percent higher for wind farms. By Annualized Cost of a Solar
Power System over Its Operating power generating technologies.
contrast, solar fell 10 percent due
to increasing economies of scale Life. As the EIA notes, and as Since costs vary considerably
and falling component costs.46 discussed above, capital costs are within regions, the EIA also
only one factor in determining provided a minimum and a
The 2010 EIA report provides the viability and attractiveness of maximum estimated cost for each
both a national base case, or competing generating technologies. of the generating technologies. As
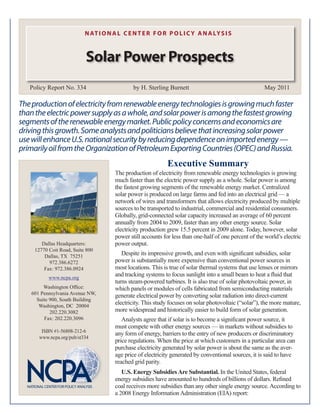
average estimated cost, and Many might argue that the shown in Figure I:
location-specific estimated costs annualized cost of newly built
for varying electric generating electricity generating facilities is ■■ Total annualized costs for
technologies. The EIA’s calculations the most important measure of the natural gas range from $57 to
consider a variety of factors viability of solar power. $71 per megawatt-hour.
15
16. Solar Power Prospects
FIGURE I
Range for Total System Annualized Cost (2009 $/megawatt-hour)
$324
Minimum Maximum
$155 $159
$126 $121
$111 $110 $115
$86 $82
$71
$57
Coal Advanced Coal Natural Gas Advanced Wind Solar
Nuclear Photovoltaic
Source: U.S. Energy Information Administration, “Levelized Cost of New Electricity Generating Technologies,” Table 2, 2010.
Available at http://www.eia.doe.gov/oiaf/aeo/electricity_generation.html.
■■ Total costs range from $86 to Grid Parity: When? to secure long-term financing and
$111 per megawatt-hour for investment.49 These subsidies are,
coal-fired power plants. Based on the EIA’s most recent in fact, driving the cost declines in
assessment of annualized costs, solar materials. Artificial demand
■■ Annualized costs for advanced solar is unlikely to be competitive is stoking expanded production,
nuclear power plants range with conventional generating which is in turn lowering the costs
from $110 to $121 per technologies by 2015 — the Obama of delivered solar arrays.
megawatt-hour. administration’s optimistic forecast.
Indeed, to be competitive by 2015, Even with subsidies, a 20 percent
■■ And total annualized costs range solar’s annualized costs would average decline in price is unlikely.
from $159 to $324 per megawatt have to decline approximately A 10 percent average decline might
hour for solar power plants. 10 percent each year. To reach be possible, but subsidies would
Even under the best conditions, widespread grid parity by 2013, have to remain at or above where
solar’s minimum annualized cost it would have to fall nearly 20 they are currently. [See Appendix
($158.70 per megawatt-hour) is percent each year. For solar to reach B, “The End of Subsidies.”]
Conclusion
higher than the maximum cost for widespread grid parity in such a
each of the technologies considered, short time would require continued
though only slightly so in the case of substantial government support and, Grid parity will be reached in
advanced coal with carbon capture as importantly, the expectation that some locations sooner than in
($154.50 per megawatt-hour).48 such support will continue in order others, but it is still at least a decade
16
17. away in most places. It will be but this expansion comes at the significantly displace species by
reached sooner if electric power expense of native plant and animal making the land permanently
prices begin to rise again, rather habitats. The Mojave Solar Park uninhabitable. Surveys have found
than falling in conjunction with the under construction in Southern 25 desert tortoises on the site.58
price of natural gas as they have California is one such example. It Attempting to assuage critics,
in the last two years. Widespread will require up to 6,000 acres for Brightsource Energy, the project
parity in either 2013 or 2015 is an expected 553 megawatts of solar developer, has agreed to acquire
highly unlikely. power.50 In contrast, a coal-fired thousands of acres of habitat to
plant can generate over 6,000 offset the damage. However, it is
It is also important to note that
megawatts of power on less than unclear that this will halt the lawsuit
if and when solar photovoltaic-
1,000 acres.51 or, more importantly, protect
generated electric power reaches
widespread grid parity, it will still In the rush to get large solar the tortoise. Animal relocations
make up only a small part of the projects approved before a 30 are not always successful and
overall electric power mix. Thus, percent federal grant program for it is uncertain whether the
it will always be supplemental construction costs expired at the desert tortoises will thrive on
to generating technologies that end of 2010, a number of new the proposed set-aside land.
can provide consistent baseload and existing companies applied
Plants May Need to Be Bigger.
power or on-demand peaking to build solar farms on public
The large solar developments
power — neither of which solar land in California.52 There were
proposed on federal lands in
photovoltaic can satisfy. nine projects approved in 2010,
California are solar thermal
encompassing over 40,000 acres
rather than solar photovoltaic.
and able to produce roughly 4,500
Appendix A megawatts.53 Though approved
This is important because solar
thermal plants require fewer acres
Environmental and initially, concern over the risk to
to produce the same amount of
various threatened and endangered
National Security species and historic cultural
electricity. If plans for the solar
thermal plants are revised and
Considerations artifacts threaten to block the solar photovoltaic is used instead,
projects. Environmental groups
Some advocate solar power for hundreds of acres more could be
fear the desert tortoise — listed as
perceived environmental and energy needed for each project.59
“vulnerable” by the International
security-related benefits rather than Union for Conservation of In addition, rated capacity is not
economic considerations. However, Nature — and other species, the same as expected power output.
these advocates largely ignore the ranging from reptiles to sheep, are For instance, the capacity factor for
negative environmental impacts at risk.54, 55 Some environmental coal-fired plants is 85 percent, so
that solar power generation has on groups have filed lawsuits against a 1,200 megawatt plant would on
the environment. Like any power the federal government over average produce 1,020 megawatts
source, there are both benefits and its approval of the projects. of electricity.
costs associated with electric power The proposed Ivanpah solar plant By contrast, solar photovoltaic’s
generated from solar photovoltaic is at the center of a suit filed against capacity factor is quite low. Areas
technology. the U.S. Department of the Interior, of high sunlight might have a
Solar Sprawl. The term solar the Bureau of Land Management capacity factor of 23 percent, but in
sprawl has been used to refer to and the Fish and Wildlife Service. areas of only moderate sunlight the
the large land and resource usage The plaintiffs argue that the 370 capacity factor falls to 11 percent.60
that accompanies expanding solar megawatt operation was approved Thus, to produce the same amount
energy projects. Solar farms often without adequate attention to of energy on average as a typical
require huge tracts of land in the effect on animals, as well as nuclear or coal-fired power plant, a
previously undeveloped areas in plants and groundwater.56, 57 The solar photovoltaic farm would have
order to maximize energy output, suit claims construction could to be more than three times larger
17