

Recommended
Recommended
More Related Content
Viewers also liked
Viewers also liked (18)
Similar to CellViz
Similar to CellViz (20)
More from Sean Barbeau
More from Sean Barbeau (20)
Recently uploaded
Recently uploaded (20)
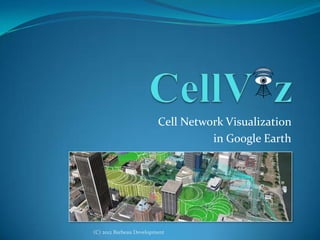
CellViz
- 1. Visualize your cell network using a mobile app (C) 2012 Barbeau Development
- 2. How does it work? CellViz is a mobile app that collects GPS and cell signal information simulatenously To collect data, run the CellViz mobile app (e.g., Android) on the device Click “Start” to begin recording Click “Stop” to stop recording The app collects the data, and emails you the results: CSV file – can be imported into any spreadsheet software KML file – can be visualized in Google Earth (C) 2012 Barbeau Development
- 3. What cell networks are supported? CellViz can potentially be used to analyze any type of cellular network that is exposed via a developer API. CellViz has been implemented on Android v2.1 and higher for: CDMA, 1xRTT, EVDO, and WiMax GSM iDEN (C) 2012 Barbeau Development
- 4. What data is collected? (1) CellViz collects the following values for each GPS fix: Latitude and Longitude (in decimal degrees), and Altitude (in meters) Timestamp (to the millisecond) Speed (meters/sec) Bearing (i.e., Heading) in 0-359 degrees Estimated Horizontal Accuracy (i.e., how accurate the positioning technology thinks the position is) Number of Satellites used to calculate the position (C) 2012 Barbeau Development
- 5. What data is collected? (2) CellViz is capable of collecting the following cell signal data (if available) simultaneous to each GPS fix: RSSI EC/IO Bit Error Rate Signal-to-Noise ratio base station ID base station location network ID sector ID (continued on next slide…) (C) 2012 Barbeau Development
- 6. What data is collected? (3) CellViz is capable of collecting the following signal data (if available) related to each GPS fix: … MAC address Frequency Channel IP address NAPID Connection time CINR Link speed NSPID Transmission power (C) 2012 Barbeau Development
- 7. Visualize results in Google Earth Google Earth allows 4D visualization of your cell network data, including: 3D camera orientation Time-lapse for handoffs 3D tower models 3D building models 3D terrain modeling Some screenshots follow (C) 2012 Barbeau Development
- 8. See each cell signal sample with lines drawn to serving tower (C) 2012 Barbeau Development
- 9. Folders on the left organize data (C) 2012 Barbeau Development
- 10. Callouts show data for each sample (C) 2012 Barbeau Development
- 11. See 3D buildings and their effect on signal strength (C) 2012 Barbeau Development
- 12. Color and altitude of circles represent signal strength (C) 2012 Barbeau Development
- 13. Diameter of circle represents accuracy of GPS (C) 2012 Barbeau Development
- 14. View 3D terrain’s effect on signals As the mountain blocks the phone’s line-of-sight with the tower, cell signal quality decreases (C) 2012 Barbeau Development
- 15. View 3D terrain’s effect on signals (C) 2012 Barbeau Development
- 16. Bird’s Eye view shows coverage per tower (C) 2012 Barbeau Development
- 17. Each tower has info in callout (C) 2012 Barbeau Development
- 18. View complex handoffs in time-lapse (C) 2012 Barbeau Development
- 19. Questions? sean@cellviz.com http://www.cellviz.com (C) 2012 Barbeau Development