SlideShare a Scribd company logo
1 of 10
Download to read offline
For useful Documents like this and Lots of more Educational and Technological Stuff...
Visit... www.thecodexpert.com

                                  Microsoft Excel 2003
                                   Charts and Graphs

Chart Examples and Brief Descriptions

   Area: line chart showing total area and trends
    (series order is important – large to small)
   Bar/Column: differences shown by length – shows
    trend differences of same category or comparison
    between two or more categories
   Line: shows trend data
   Pie: compares all parts of a whole (totals)
   Combination: (not an actual type) you must
    physically select different categories to be shown
    by different types (right click on that series and
    change chart type)
   3-D: similar to Bar/Column/Line but gives depth
    and may add to appearance
     Order is important
     Can “twist” or rotate chart (corner handle) to give a better view


Create a Column Graph

Open the file named Excel-OfficeTreats. We will use this file to create and edit charts (graphs).
Change the Zoom to 75% to make it easier to select data and view charts.

1. Do some prior thinking about what type chart/graph that will best show what you want (see
   some basic examples and their description on top of next page)
2. Highlight the data that you want to be graphically
   represented on your chart
    Do not include totals unless you want totals for
       point of comparison
    You will be able to edit this info later
    As data changes, this chart will also change to
       reflect the new data
3. Use the Chart Wizard Button (Insert-Chart) – it is
   very valuable in setting up the majority of the
   information you want – then you can “fine-tune” it
   later

   The wizard has 4 steps:
          Type of chart (see listing at end of these
           notes)
          Data Range (should have already “pre”- selected in 1st step above)
For useful Documents like this and Lots of more Educational and Technological Stuff...          1
Visit... www.thecodexpert.com
For useful Documents like this and Lots of more Educational and Technological Stuff...
Visit... www.thecodexpert.com

        Add Title and Axis labels (X is horizontal, Y is vertical for 2-D graphs)
        Choose where you want the graph (same sheet or its own sheet)
4. Select the Range A5 to G9. (Do not include the totals.)

5. Click the Chart Wizard button.

6. A dialog box will appear. Make sure that the Chart type says Column, and the Chart sub-
   type is Clustered column with 3-D visual effect. (Middle Left).

7. Use the push button to preview your chart. Click Next.

8. Verify the Data range in Step 2 of 4 of the Chart Wizard. Click Next.

9. Step 3 of 4 will allow you to add a
   Chart Title and Axis labels.

10. Type Treats by Month in the
    Chart Title box.

11. Type the X axis label (for
    horizontal info. Note that is the
    labels of the data columns. (See
    example for axis labels.)

12. Type the Z axis label (for vertical
    info. Note that is the labels of the
    data rows. (See example for axis
    labels.)

   Notice the preview window as you type your titles.
   (NOTE: Y is used for depth)

13. Click Next when finished.

14. No changes are necessary on the next screen
    (4 of 4). Click Finish.

Move the Chart:
The chart will be placed in your worksheet. Notice the handles for sizing and moving.
 Click anywhere in the white area of the chart and drag to cell A12.

Change the Background:
 Right click anywhere on the chart and then click Format Chart Area.
 Click Custom in the Borders field. Then choose Red in the Colors field.
 Click Shadow and Rounded Corners. (Notice the sample in the lower right corner.)
 Click OK.
For useful Documents like this and Lots of more Educational and Technological Stuff...       2
Visit... www.thecodexpert.com
For useful Documents like this and Lots of more Educational and Technological Stuff...
Visit... www.thecodexpert.com

   Click on any cell outside of the chart to deselect the chart.
   Remember to use Undo if you don't like the results!


For useful Documents like this and Lots of more Educational and Technological Stuff...   3
Visit... www.thecodexpert.com
For useful Documents like this and Lots of more Educational and Technological Stuff...
Visit... www.thecodexpert.com

Resize:
 Hold down shift key while stretching bottom right corner “handle” to keep from distorting
   the proportions

Formatting Individual Parts of Your Graph:
 Bring up Chart Toolbar –
     VIEW  Toolbars  Chart
     (or Click within the chart) (or Right click
     on the toolbars and select Chart.)

   Toolbar buttons: Format, Chart Type, Legend,
    Data Table, By Row, By Column, Angle Text
    Downward, Angle Text Upward

   Formatting Individual parts of your graph – select the part from the Chart Objects drop-down
    then click on the Format button (1st button to the right of the Object drop-down)
         Category Axis (“x”axis) – Pattern (tick marks), Scale, Font, Number/Text Format,
             and Alignment
         Chart Area – Patterns, Font
         Legend – Patterns, Font, Placement
         Plot Area- Patterns
         Value Axis (“y”axis) – Pattern (tick marks), Scale, Font, Number/Text Format,
             Alignment
         Value Axis (“y”) Major Gridlines – Patterns,
         Series – Patterns, Axis (separate axis), Y-Error Bars (amount), Data Labels, Series
             Order, Options (overlap, gap width)
         Drawing: VIEW  Toolbars  Drawing
             Add other drawing features to existing chart (shapes, text, etc)

            NOTE: You may also click on the area of the chart that you wish to change and go
            to the format button.

                        LET’S SELECT VALUES AND CLICK ICONS

Changing Chart Types:
 Chart Type, Legend, Data Table, By Row, and By Column can be clicked/un-clicked at any
   time
    Type – was selected during wizard (highly recommended) but can be altered by clicking
         on small drop-down arrow to the right of the Chart Type button. You may also
         click on the chart and click the chart wizard icon to select a new type.
    Legend – toggles back-and-forth showing/not-showing the legend in the graph
    Data Table – toggles back-and-forth showing/not-showing the data table within the graph
    By Row/By Column – allows you to change which header is on which axis – select one
         or the other (can be toggled at any time)
 Format, Angle Text Downward/Upward are used to format individual parts of the chart (see
   below)
For useful Documents like this and Lots of more Educational and Technological Stuff...     4
Visit... www.thecodexpert.com
For useful Documents like this and Lots of more Educational and Technological Stuff...
Visit... www.thecodexpert.com


For useful Documents like this and Lots of more Educational and Technological Stuff...   5
Visit... www.thecodexpert.com
For useful Documents like this and Lots of more Educational and Technological Stuff...
Visit... www.thecodexpert.com

Printing:
    Click on any empty cell outside of chart
    FILE  Page Setup – make any necessary changes
    If you just want the chart, click on it and then FILE  Print

Connecting Charts to Word:
Linking vs. Embedding in Word
    Embedding: Places a copy into Word that will not change regardless of any subsequent
       changes you make to he original Excel Worksheet
    Linking: Allows Word to reflect any changes made to original Excel Worksheet.
       Choosing to link creates a “path” to the source file – if you change the name of the source
       file or move it to another location the link/path will be broken.

Copying the Graph
    Click on the graph and choose copy
    Open Word document you want to paste into
       Embed: EDIT  PASTE
       Link: EDIT  PASTE SPECIAL *Must have Link box checked

Click File, then Close. You do not need to save your changes.


Create a Pie Chart for One Data Range:

1. Open Excel-Sales
2. Select the range A4 to A8. Now, press and hold the Ctrl key and then select the second range
    - H4 to H8.
3. Click the Chart Wizard button.
4. Change the Chart type to Pie, and select the Pie with 3D visual effect from the upper middle.
5. Click Next.
6. Verify the range in Step 2 of 4 of the Chart Wizard. Click Next.
7. Type Total Pizza Sales by Flavor for a Chart Title, then click Next.
8. On the next screen, click Finish.
9. The chart will be added to your worksheet. Notice the handles for sizing.
10. Click anywhere in the white area of the chart and drag the new Pie chart to a location just
    below your Column Chart.
11. Click anywhere off the chart to deselect.
12. Click Print Preview to see how the Charts will look in your document.
    13. Click the Close button to exit Print Preview.

Click File, then Close. You do not need to save your changes.


For useful Documents like this and Lots of more Educational and Technological Stuff...          6
Visit... www.thecodexpert.com
For useful Documents like this and Lots of more Educational and Technological Stuff...
Visit... www.thecodexpert.com

Create an Organization Chart

You can use the diagramming tool on the Drawing toolbar          to create an organization chart to
illustrate hierarchical relationships, such as department managers and employees within a
company. (This works both in Word and Excel)
Click on the Insert diagram or org
chart icon.
Insert the desired chart, and simply
click on the boxes to enter the text.
Insert Shapes: Click on the
desired box, and add Subordinates,
Co-workers, and Assistants
Layout: Allows for formatting
justification (left, right, etc)
Select: Select a level or a branch,
etc, and make changes (such as size or font) that are applied to all.
AutoFormat: Allows for several formatting schemes.
Zoom: Changes appearance for ease of use.

When you add or change an organization chart, the organization chart appears with drawing
space around it, outlined by a non-printing border and sizing handles. You can size the
organization chart by using sizing commands to make the drawing area larger so you have more
room to work, or you can get rid of extra space by fitting the border more closely to the diagram.

Format the entire organization with preset styles; or, format pieces of it like you format shapes—
add color and text, change line weight and style, and add fills, textures, and backgrounds. Add
shapes— such as manager (superior), employee (subordinate), assistant, or coworker— or
change branch layout options with the Organization Chart toolbar, which appears when you
insert or select the diagram.

1. On the Drawing toolbar, click Diagram or Organizational Chart
2. Click the Organization Chart diagram, and then click OK.
3. Do one or more of the following:
    If you want to add text to a shape, right-click the shape, click Edit Text, and type the
       text.
    Text cannot be added to lines or connectors in organization charts.
    If you want to add a shape, select the shape you want to add the new shape under or next
       to, click the arrow on the Insert Shape button on the Organization Chart toolbar, and
       then click one or more of the following:

         NOTE: You must uncheck “Auto Format” to change the format of a level or branch.
For useful Documents like this and Lots of more Educational and Technological Stuff...            7
Visit... www.thecodexpert.com
For useful Documents like this and Lots of more Educational and Technological Stuff...
Visit... www.thecodexpert.com

       Coworker— to place the shape next to the selected shape and connect it to the same
       superior shape.
       Subordinate— to place the new shape below and connect it to the selected shape.
       Assistant— to place the new shape below the selected shape with an elbow connector.
    If you want to add a preset design scheme, click AutoFormat on the Organization
       Chart toolbar, and select a style from the Organization Chart Style Gallery.
4. Click outside the drawing when you are finished.


Create a Flowchart

Create a work flowchart by assembling various shapes and connectors. Some templates are
available through the Help feature. (This works both in Word and Excel)

Move a shape
Select the shape and when the pointer becomes a four-headed arrow, drag it to a new location.

Note The locked connectors attached to the shape move with the shape. To unlock a connector,
select the connector and the connection point and drag it off the shape.

Add or delete a shape
On the Drawing toolbar, click AutoShapes, point to Flowchart, and then click the shape you
want. Click where you want to insert the flowchart shape.

Note If you want to delete a shape, select the shape and press DELETE.

Change the color of a line or connector
Select the line or connector you want to change.
On the Drawing toolbar, click the arrow next to Line Color.
Do one of the following:
        To change to the default color, click Automatic.
        To change to another color, click one of the colors below Automatic.

Change the style of a line or connector
Select the line or connector you want to change.
On the Drawing toolbar, click Line Style.
Click the style you want; or click More Lines, and then click a style.

Add or delete a connector
On the Drawing toolbar, click AutoShapes, point to Connectors, and then click the connector line
you want.
Point to where you want to lock the connector.
Connection sites appear as blue circles as you pass the pointer over a shape.
Click the first connection site you want, point to the other shape, and then click the second
connection site.
Locked or attached connectors will keep the shapes connected even when you move the shapes.
For useful Documents like this and Lots of more Educational and Technological Stuff...         8
Visit... www.thecodexpert.com
For useful Documents like this and Lots of more Educational and Technological Stuff...
Visit... www.thecodexpert.com

Locked connector
Unlocked connector

Note To delete a connector, select the connector and press DELETE.

Move a connector
Do one of the following:

Reroute a connector to the closest points between shapes
      Select one of the connected shapes.
      On the Drawing toolbar, click Draw, and then click Reroute Connectors.
      If more than one connector line is attached to an object and you don't want to reroute all
      the lines, select only the ones you want to reroute, and then click Reroute Connectors.

Move a connector
      Do one or both of the following:
      To move the connector line, drag one of its ends and connect it to another site or shape.
      To override the automatic locking of the end, hold down ALT as you drag the end. You
      can place the end wherever you want on the object, but the end will not be connected.
      To detach the entire line, drag its middle.

       Note If the connector line has a yellow “adjustment handle”, dragging the handle will
       change the shape of the connector line but not detach it.

Hold it all together
1. Hold the shift key down and click on each of the objects in the group.
2. Let go of shift key
3. Right click anywhere on objects
4. Click Grouping  Group


For useful Documents like this and Lots of more Educational and Technological Stuff...             9
Visit... www.thecodexpert.com
For useful Documents like this and Lots of more Educational and Technological Stuff...
Visit... www.thecodexpert.com


    For useful Documents
         like this and
        Lots of more
      Educational and
    Technological Stuff...

                                  Visit...

www.thecodexpert.com


For useful Documents like this and Lots of more Educational and Technological Stuff...   10
Visit... www.thecodexpert.com

More Related Content

What's hot

What's hot (20)

Excel bacis
Excel bacisExcel bacis
Excel bacis
 
Excel 2007 Unit C
Excel 2007 Unit CExcel 2007 Unit C
Excel 2007 Unit C
 
Excel Basic Knowledge
Excel Basic KnowledgeExcel Basic Knowledge
Excel Basic Knowledge
 
Basic Ms excel
Basic Ms excelBasic Ms excel
Basic Ms excel
 
Getting Started with MS Access and Pivot Tables
Getting Started with MS Access and Pivot TablesGetting Started with MS Access and Pivot Tables
Getting Started with MS Access and Pivot Tables
 
Excel Intro Part1
Excel Intro Part1Excel Intro Part1
Excel Intro Part1
 
MS Excel Tips & Tricks
MS Excel Tips & TricksMS Excel Tips & Tricks
MS Excel Tips & Tricks
 
MS Excel 2010 training module
MS Excel 2010 training moduleMS Excel 2010 training module
MS Excel 2010 training module
 
MS Excel Learning for PPC Google AdWords Training Course
MS Excel Learning for PPC Google AdWords Training CourseMS Excel Learning for PPC Google AdWords Training Course
MS Excel Learning for PPC Google AdWords Training Course
 
MS Excel Basics
 MS Excel Basics MS Excel Basics
MS Excel Basics
 
Productivity programs excel assignment 1
Productivity programs excel assignment 1Productivity programs excel assignment 1
Productivity programs excel assignment 1
 
Microsoft excel training module
Microsoft excel training moduleMicrosoft excel training module
Microsoft excel training module
 
Ms excel training
Ms excel training   Ms excel training
Ms excel training
 
get_more_from_excel
get_more_from_excelget_more_from_excel
get_more_from_excel
 
Basics of Ms Excel Office Tool
Basics of Ms Excel Office ToolBasics of Ms Excel Office Tool
Basics of Ms Excel Office Tool
 
Unit 4 ms excel of class 8
Unit 4 ms excel of class 8Unit 4 ms excel of class 8
Unit 4 ms excel of class 8
 
E-Book 25 Tips and Tricks MS Excel Functions & Formulaes
E-Book 25 Tips and Tricks MS Excel Functions & FormulaesE-Book 25 Tips and Tricks MS Excel Functions & Formulaes
E-Book 25 Tips and Tricks MS Excel Functions & Formulaes
 
Excel formulas tf-jul1605
Excel formulas tf-jul1605Excel formulas tf-jul1605
Excel formulas tf-jul1605
 
ITT PROJECT IN EXCEL AND WORD
ITT PROJECT IN EXCEL AND WORDITT PROJECT IN EXCEL AND WORD
ITT PROJECT IN EXCEL AND WORD
 
Excel Training
Excel TrainingExcel Training
Excel Training
 

Viewers also liked

Extent Of Job Discrimination
Extent Of Job DiscriminationExtent Of Job Discrimination
Extent Of Job Discriminationsimply_coool
 
Excel 2003 Charts
Excel 2003 ChartsExcel 2003 Charts
Excel 2003 Chartsbdthang
 
Excel graphs & charts
Excel graphs & chartsExcel graphs & charts
Excel graphs & chartsjmd197961
 
Teaching Excel
Teaching ExcelTeaching Excel
Teaching Excelsam ran
 
Functions and formulas of ms excel
Functions and formulas of ms excelFunctions and formulas of ms excel
Functions and formulas of ms excelmadhuparna bhowmik
 
MS EXCEL PPT PRESENTATION
MS EXCEL PPT PRESENTATIONMS EXCEL PPT PRESENTATION
MS EXCEL PPT PRESENTATIONMridul Bansal
 

Viewers also liked (8)

Extent Of Job Discrimination
Extent Of Job DiscriminationExtent Of Job Discrimination
Extent Of Job Discrimination
 
Excel 2003 Charts
Excel 2003 ChartsExcel 2003 Charts
Excel 2003 Charts
 
Excel graphs & charts
Excel graphs & chartsExcel graphs & charts
Excel graphs & charts
 
Teaching Excel
Teaching ExcelTeaching Excel
Teaching Excel
 
Ppt on ms excel
Ppt on ms excelPpt on ms excel
Ppt on ms excel
 
Functions and formulas of ms excel
Functions and formulas of ms excelFunctions and formulas of ms excel
Functions and formulas of ms excel
 
Ms excel 2007
Ms excel 2007Ms excel 2007
Ms excel 2007
 
MS EXCEL PPT PRESENTATION
MS EXCEL PPT PRESENTATIONMS EXCEL PPT PRESENTATION
MS EXCEL PPT PRESENTATION
 

Similar to Excel Graphs Charts

Creating & Editing Charts In Microsoft Excel 2003
Creating & Editing Charts In Microsoft Excel 2003Creating & Editing Charts In Microsoft Excel 2003
Creating & Editing Charts In Microsoft Excel 2003bud_00
 
Lesson11 working with charts
Lesson11 working with chartsLesson11 working with charts
Lesson11 working with chartsricsanmae
 
Excel 2003 tutorial 2
Excel 2003 tutorial 2Excel 2003 tutorial 2
Excel 2003 tutorial 2catacata1976
 
Lesson 11 working with charts
Lesson 11   working with chartsLesson 11   working with charts
Lesson 11 working with chartsguevarra_2000
 
Lesson 10 working with charts
Lesson 10   working with chartsLesson 10   working with charts
Lesson 10 working with chartsguevarra_2000
 
4 4 making changes to graphs
4 4 making changes to graphs4 4 making changes to graphs
4 4 making changes to graphsQondileRamokgadi
 
Making a Chart Using Excel
Making a Chart Using ExcelMaking a Chart Using Excel
Making a Chart Using Excelrebelbrindley
 
excel charts and graphs.ppt
excel charts and graphs.pptexcel charts and graphs.ppt
excel charts and graphs.pptChemOyasan1
 
Introduction to Excel
Introduction to ExcelIntroduction to Excel
Introduction to ExcelNajma Alam
 
Creating charts and graphics
Creating charts and graphicsCreating charts and graphics
Creating charts and graphicsum5ashm
 
Creating charts and graphics
Creating charts and graphicsCreating charts and graphics
Creating charts and graphicsum5ashm
 
Lesson 16 Working With Charts
Lesson 16   Working With ChartsLesson 16   Working With Charts
Lesson 16 Working With Chartsguevarra_2000
 
Basics of Creating Graphs / Charts using Microsoft Excel
Basics of Creating Graphs / Charts using Microsoft ExcelBasics of Creating Graphs / Charts using Microsoft Excel
Basics of Creating Graphs / Charts using Microsoft ExcelTope Osanyintuyi
 
Exp2003 exl ppt_03
Exp2003 exl ppt_03Exp2003 exl ppt_03
Exp2003 exl ppt_03lonetree
 

Similar to Excel Graphs Charts (20)

Creating & Editing Charts In Microsoft Excel 2003
Creating & Editing Charts In Microsoft Excel 2003Creating & Editing Charts In Microsoft Excel 2003
Creating & Editing Charts In Microsoft Excel 2003
 
Print16
Print16Print16
Print16
 
Lesson11 working with charts
Lesson11 working with chartsLesson11 working with charts
Lesson11 working with charts
 
Excel 2003 tutorial 2
Excel 2003 tutorial 2Excel 2003 tutorial 2
Excel 2003 tutorial 2
 
Lesson 11 working with charts
Lesson 11   working with chartsLesson 11   working with charts
Lesson 11 working with charts
 
Lesson 10 working with charts
Lesson 10   working with chartsLesson 10   working with charts
Lesson 10 working with charts
 
Advanced excel
Advanced excelAdvanced excel
Advanced excel
 
4 4 making changes to graphs
4 4 making changes to graphs4 4 making changes to graphs
4 4 making changes to graphs
 
Making a Chart Using Excel
Making a Chart Using ExcelMaking a Chart Using Excel
Making a Chart Using Excel
 
excel charts and graphs.ppt
excel charts and graphs.pptexcel charts and graphs.ppt
excel charts and graphs.ppt
 
excel.ppt
excel.pptexcel.ppt
excel.ppt
 
Introduction to Excel
Introduction to ExcelIntroduction to Excel
Introduction to Excel
 
excell.pdf
excell.pdfexcell.pdf
excell.pdf
 
Spreadsheets 2
Spreadsheets 2Spreadsheets 2
Spreadsheets 2
 
MS Excel 2010 tutorial 6
MS Excel 2010 tutorial 6MS Excel 2010 tutorial 6
MS Excel 2010 tutorial 6
 
Creating charts and graphics
Creating charts and graphicsCreating charts and graphics
Creating charts and graphics
 
Creating charts and graphics
Creating charts and graphicsCreating charts and graphics
Creating charts and graphics
 
Lesson 16 Working With Charts
Lesson 16   Working With ChartsLesson 16   Working With Charts
Lesson 16 Working With Charts
 
Basics of Creating Graphs / Charts using Microsoft Excel
Basics of Creating Graphs / Charts using Microsoft ExcelBasics of Creating Graphs / Charts using Microsoft Excel
Basics of Creating Graphs / Charts using Microsoft Excel
 
Exp2003 exl ppt_03
Exp2003 exl ppt_03Exp2003 exl ppt_03
Exp2003 exl ppt_03
 

More from simply_coool

Excel Printing Tips2007
Excel Printing Tips2007Excel Printing Tips2007
Excel Printing Tips2007simply_coool
 
Excel Formulas Functions 2007
Excel Formulas Functions 2007Excel Formulas Functions 2007
Excel Formulas Functions 2007simply_coool
 
Excel Formulas Functions
Excel Formulas FunctionsExcel Formulas Functions
Excel Formulas Functionssimply_coool
 
Excel Formatting 2007
Excel Formatting 2007Excel Formatting 2007
Excel Formatting 2007simply_coool
 
Ethics In Various Religions
Ethics In Various ReligionsEthics In Various Religions
Ethics In Various Religionssimply_coool
 
Intro To BUSINESS ETHICS
Intro To BUSINESS ETHICSIntro To BUSINESS ETHICS
Intro To BUSINESS ETHICSsimply_coool
 
Ethics Of Conserving Depletable Resources
Ethics Of Conserving Depletable ResourcesEthics Of Conserving Depletable Resources
Ethics Of Conserving Depletable Resourcessimply_coool
 
Firm’S Duties To The Employee
Firm’S Duties To The EmployeeFirm’S Duties To The Employee
Firm’S Duties To The Employeesimply_coool
 
Ethics And Values In Business
Ethics And Values In BusinessEthics And Values In Business
Ethics And Values In Businesssimply_coool
 
Descriptive Ethics Encyclopedia Of Business Ethics
Descriptive Ethics   Encyclopedia Of Business EthicsDescriptive Ethics   Encyclopedia Of Business Ethics
Descriptive Ethics Encyclopedia Of Business Ethicssimply_coool
 
Elements Of Tqm Framework
Elements Of Tqm FrameworkElements Of Tqm Framework
Elements Of Tqm Frameworksimply_coool
 
Business Ethics Session2
Business Ethics Session2Business Ethics Session2
Business Ethics Session2simply_coool
 
Dimensions Of Pollution Control
Dimensions Of Pollution ControlDimensions Of Pollution Control
Dimensions Of Pollution Controlsimply_coool
 

More from simply_coool (20)

Excel Printing Tips2007
Excel Printing Tips2007Excel Printing Tips2007
Excel Printing Tips2007
 
Excel Formulas Functions 2007
Excel Formulas Functions 2007Excel Formulas Functions 2007
Excel Formulas Functions 2007
 
Excel Formulas Functions
Excel Formulas FunctionsExcel Formulas Functions
Excel Formulas Functions
 
Excel Formatting 2007
Excel Formatting 2007Excel Formatting 2007
Excel Formatting 2007
 
Hr Ethical Issues
Hr Ethical IssuesHr Ethical Issues
Hr Ethical Issues
 
Ethics In Various Religions
Ethics In Various ReligionsEthics In Various Religions
Ethics In Various Religions
 
Imp Of Be
Imp Of BeImp Of Be
Imp Of Be
 
Intro To BUSINESS ETHICS
Intro To BUSINESS ETHICSIntro To BUSINESS ETHICS
Intro To BUSINESS ETHICS
 
Ethics Of Conserving Depletable Resources
Ethics Of Conserving Depletable ResourcesEthics Of Conserving Depletable Resources
Ethics Of Conserving Depletable Resources
 
Firm’S Duties To The Employee
Firm’S Duties To The EmployeeFirm’S Duties To The Employee
Firm’S Duties To The Employee
 
Ethics
EthicsEthics
Ethics
 
Ethics And Values In Business
Ethics And Values In BusinessEthics And Values In Business
Ethics And Values In Business
 
Ethics In Hrm
Ethics In HrmEthics In Hrm
Ethics In Hrm
 
Codes Of Ethics
Codes Of EthicsCodes Of Ethics
Codes Of Ethics
 
Descriptive Ethics Encyclopedia Of Business Ethics
Descriptive Ethics   Encyclopedia Of Business EthicsDescriptive Ethics   Encyclopedia Of Business Ethics
Descriptive Ethics Encyclopedia Of Business Ethics
 
Elements Of Tqm Framework
Elements Of Tqm FrameworkElements Of Tqm Framework
Elements Of Tqm Framework
 
Decision Making
Decision MakingDecision Making
Decision Making
 
Business Ethics Session2
Business Ethics Session2Business Ethics Session2
Business Ethics Session2
 
Business Ethics
Business  EthicsBusiness  Ethics
Business Ethics
 
Dimensions Of Pollution Control
Dimensions Of Pollution ControlDimensions Of Pollution Control
Dimensions Of Pollution Control
 

Recently uploaded

Active Learning Strategies (in short ALS).pdf
Active Learning Strategies (in short ALS).pdfActive Learning Strategies (in short ALS).pdf
Active Learning Strategies (in short ALS).pdfPatidar M
 
ClimART Action | eTwinning Project
ClimART Action    |    eTwinning ProjectClimART Action    |    eTwinning Project
ClimART Action | eTwinning Projectjordimapav
 
Congestive Cardiac Failure..presentation
Congestive Cardiac Failure..presentationCongestive Cardiac Failure..presentation
Congestive Cardiac Failure..presentationdeepaannamalai16
 
How to Manage Buy 3 Get 1 Free in Odoo 17
How to Manage Buy 3 Get 1 Free in Odoo 17How to Manage Buy 3 Get 1 Free in Odoo 17
How to Manage Buy 3 Get 1 Free in Odoo 17Celine George
 
Grade Three -ELLNA-REVIEWER-ENGLISH.pptx
Grade Three -ELLNA-REVIEWER-ENGLISH.pptxGrade Three -ELLNA-REVIEWER-ENGLISH.pptx
Grade Three -ELLNA-REVIEWER-ENGLISH.pptxkarenfajardo43
 
How to Fix XML SyntaxError in Odoo the 17
How to Fix XML SyntaxError in Odoo the 17How to Fix XML SyntaxError in Odoo the 17
How to Fix XML SyntaxError in Odoo the 17Celine George
 
31 ĐỀ THI THỬ VÀO LỚP 10 - TIẾNG ANH - FORM MỚI 2025 - 40 CÂU HỎI - BÙI VĂN V...
31 ĐỀ THI THỬ VÀO LỚP 10 - TIẾNG ANH - FORM MỚI 2025 - 40 CÂU HỎI - BÙI VĂN V...31 ĐỀ THI THỬ VÀO LỚP 10 - TIẾNG ANH - FORM MỚI 2025 - 40 CÂU HỎI - BÙI VĂN V...
31 ĐỀ THI THỬ VÀO LỚP 10 - TIẾNG ANH - FORM MỚI 2025 - 40 CÂU HỎI - BÙI VĂN V...Nguyen Thanh Tu Collection
 
How to Make a Duplicate of Your Odoo 17 Database
How to Make a Duplicate of Your Odoo 17 DatabaseHow to Make a Duplicate of Your Odoo 17 Database
How to Make a Duplicate of Your Odoo 17 DatabaseCeline George
 
Grade 9 Quarter 4 Dll Grade 9 Quarter 4 DLL.pdf
Grade 9 Quarter 4 Dll Grade 9 Quarter 4 DLL.pdfGrade 9 Quarter 4 Dll Grade 9 Quarter 4 DLL.pdf
Grade 9 Quarter 4 Dll Grade 9 Quarter 4 DLL.pdfJemuel Francisco
 
Tree View Decoration Attribute in the Odoo 17
Tree View Decoration Attribute in the Odoo 17Tree View Decoration Attribute in the Odoo 17
Tree View Decoration Attribute in the Odoo 17Celine George
 
4.9.24 School Desegregation in Boston.pptx
4.9.24 School Desegregation in Boston.pptx4.9.24 School Desegregation in Boston.pptx
4.9.24 School Desegregation in Boston.pptxmary850239
 
4.11.24 Mass Incarceration and the New Jim Crow.pptx
4.11.24 Mass Incarceration and the New Jim Crow.pptx4.11.24 Mass Incarceration and the New Jim Crow.pptx
4.11.24 Mass Incarceration and the New Jim Crow.pptxmary850239
 
ESP 4-EDITED.pdfmmcncncncmcmmnmnmncnmncmnnjvnnv
ESP 4-EDITED.pdfmmcncncncmcmmnmnmncnmncmnnjvnnvESP 4-EDITED.pdfmmcncncncmcmmnmnmncnmncmnnjvnnv
ESP 4-EDITED.pdfmmcncncncmcmmnmnmncnmncmnnjvnnvRicaMaeCastro1
 
Oppenheimer Film Discussion for Philosophy and Film
Oppenheimer Film Discussion for Philosophy and FilmOppenheimer Film Discussion for Philosophy and Film
Oppenheimer Film Discussion for Philosophy and FilmStan Meyer
 
MS4 level being good citizen -imperative- (1) (1).pdf
MS4 level   being good citizen -imperative- (1) (1).pdfMS4 level   being good citizen -imperative- (1) (1).pdf
MS4 level being good citizen -imperative- (1) (1).pdfMr Bounab Samir
 
Blowin' in the Wind of Caste_ Bob Dylan's Song as a Catalyst for Social Justi...
Blowin' in the Wind of Caste_ Bob Dylan's Song as a Catalyst for Social Justi...Blowin' in the Wind of Caste_ Bob Dylan's Song as a Catalyst for Social Justi...
Blowin' in the Wind of Caste_ Bob Dylan's Song as a Catalyst for Social Justi...DhatriParmar
 
BIOCHEMISTRY-CARBOHYDRATE METABOLISM CHAPTER 2.pptx
BIOCHEMISTRY-CARBOHYDRATE METABOLISM CHAPTER 2.pptxBIOCHEMISTRY-CARBOHYDRATE METABOLISM CHAPTER 2.pptx
BIOCHEMISTRY-CARBOHYDRATE METABOLISM CHAPTER 2.pptxSayali Powar
 
Unraveling Hypertext_ Analyzing Postmodern Elements in Literature.pptx
Unraveling Hypertext_ Analyzing  Postmodern Elements in  Literature.pptxUnraveling Hypertext_ Analyzing  Postmodern Elements in  Literature.pptx
Unraveling Hypertext_ Analyzing Postmodern Elements in Literature.pptxDhatriParmar
 

Recently uploaded (20)

Active Learning Strategies (in short ALS).pdf
Active Learning Strategies (in short ALS).pdfActive Learning Strategies (in short ALS).pdf
Active Learning Strategies (in short ALS).pdf
 
ClimART Action | eTwinning Project
ClimART Action    |    eTwinning ProjectClimART Action    |    eTwinning Project
ClimART Action | eTwinning Project
 
Congestive Cardiac Failure..presentation
Congestive Cardiac Failure..presentationCongestive Cardiac Failure..presentation
Congestive Cardiac Failure..presentation
 
How to Manage Buy 3 Get 1 Free in Odoo 17
How to Manage Buy 3 Get 1 Free in Odoo 17How to Manage Buy 3 Get 1 Free in Odoo 17
How to Manage Buy 3 Get 1 Free in Odoo 17
 
Grade Three -ELLNA-REVIEWER-ENGLISH.pptx
Grade Three -ELLNA-REVIEWER-ENGLISH.pptxGrade Three -ELLNA-REVIEWER-ENGLISH.pptx
Grade Three -ELLNA-REVIEWER-ENGLISH.pptx
 
How to Fix XML SyntaxError in Odoo the 17
How to Fix XML SyntaxError in Odoo the 17How to Fix XML SyntaxError in Odoo the 17
How to Fix XML SyntaxError in Odoo the 17
 
31 ĐỀ THI THỬ VÀO LỚP 10 - TIẾNG ANH - FORM MỚI 2025 - 40 CÂU HỎI - BÙI VĂN V...
31 ĐỀ THI THỬ VÀO LỚP 10 - TIẾNG ANH - FORM MỚI 2025 - 40 CÂU HỎI - BÙI VĂN V...31 ĐỀ THI THỬ VÀO LỚP 10 - TIẾNG ANH - FORM MỚI 2025 - 40 CÂU HỎI - BÙI VĂN V...
31 ĐỀ THI THỬ VÀO LỚP 10 - TIẾNG ANH - FORM MỚI 2025 - 40 CÂU HỎI - BÙI VĂN V...
 
How to Make a Duplicate of Your Odoo 17 Database
How to Make a Duplicate of Your Odoo 17 DatabaseHow to Make a Duplicate of Your Odoo 17 Database
How to Make a Duplicate of Your Odoo 17 Database
 
Mattingly "AI & Prompt Design: Large Language Models"
Mattingly "AI & Prompt Design: Large Language Models"Mattingly "AI & Prompt Design: Large Language Models"
Mattingly "AI & Prompt Design: Large Language Models"
 
INCLUSIVE EDUCATION PRACTICES FOR TEACHERS AND TRAINERS.pptx
INCLUSIVE EDUCATION PRACTICES FOR TEACHERS AND TRAINERS.pptxINCLUSIVE EDUCATION PRACTICES FOR TEACHERS AND TRAINERS.pptx
INCLUSIVE EDUCATION PRACTICES FOR TEACHERS AND TRAINERS.pptx
 
Grade 9 Quarter 4 Dll Grade 9 Quarter 4 DLL.pdf
Grade 9 Quarter 4 Dll Grade 9 Quarter 4 DLL.pdfGrade 9 Quarter 4 Dll Grade 9 Quarter 4 DLL.pdf
Grade 9 Quarter 4 Dll Grade 9 Quarter 4 DLL.pdf
 
Tree View Decoration Attribute in the Odoo 17
Tree View Decoration Attribute in the Odoo 17Tree View Decoration Attribute in the Odoo 17
Tree View Decoration Attribute in the Odoo 17
 
4.9.24 School Desegregation in Boston.pptx
4.9.24 School Desegregation in Boston.pptx4.9.24 School Desegregation in Boston.pptx
4.9.24 School Desegregation in Boston.pptx
 
4.11.24 Mass Incarceration and the New Jim Crow.pptx
4.11.24 Mass Incarceration and the New Jim Crow.pptx4.11.24 Mass Incarceration and the New Jim Crow.pptx
4.11.24 Mass Incarceration and the New Jim Crow.pptx
 
ESP 4-EDITED.pdfmmcncncncmcmmnmnmncnmncmnnjvnnv
ESP 4-EDITED.pdfmmcncncncmcmmnmnmncnmncmnnjvnnvESP 4-EDITED.pdfmmcncncncmcmmnmnmncnmncmnnjvnnv
ESP 4-EDITED.pdfmmcncncncmcmmnmnmncnmncmnnjvnnv
 
Oppenheimer Film Discussion for Philosophy and Film
Oppenheimer Film Discussion for Philosophy and FilmOppenheimer Film Discussion for Philosophy and Film
Oppenheimer Film Discussion for Philosophy and Film
 
MS4 level being good citizen -imperative- (1) (1).pdf
MS4 level   being good citizen -imperative- (1) (1).pdfMS4 level   being good citizen -imperative- (1) (1).pdf
MS4 level being good citizen -imperative- (1) (1).pdf
 
Blowin' in the Wind of Caste_ Bob Dylan's Song as a Catalyst for Social Justi...
Blowin' in the Wind of Caste_ Bob Dylan's Song as a Catalyst for Social Justi...Blowin' in the Wind of Caste_ Bob Dylan's Song as a Catalyst for Social Justi...
Blowin' in the Wind of Caste_ Bob Dylan's Song as a Catalyst for Social Justi...
 
BIOCHEMISTRY-CARBOHYDRATE METABOLISM CHAPTER 2.pptx
BIOCHEMISTRY-CARBOHYDRATE METABOLISM CHAPTER 2.pptxBIOCHEMISTRY-CARBOHYDRATE METABOLISM CHAPTER 2.pptx
BIOCHEMISTRY-CARBOHYDRATE METABOLISM CHAPTER 2.pptx
 
Unraveling Hypertext_ Analyzing Postmodern Elements in Literature.pptx
Unraveling Hypertext_ Analyzing  Postmodern Elements in  Literature.pptxUnraveling Hypertext_ Analyzing  Postmodern Elements in  Literature.pptx
Unraveling Hypertext_ Analyzing Postmodern Elements in Literature.pptx
 

Excel Graphs Charts

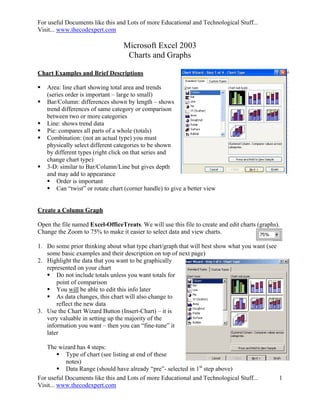
  • 1. For useful Documents like this and Lots of more Educational and Technological Stuff... Visit... www.thecodexpert.com Microsoft Excel 2003 Charts and Graphs Chart Examples and Brief Descriptions  Area: line chart showing total area and trends (series order is important – large to small)  Bar/Column: differences shown by length – shows trend differences of same category or comparison between two or more categories  Line: shows trend data  Pie: compares all parts of a whole (totals)  Combination: (not an actual type) you must physically select different categories to be shown by different types (right click on that series and change chart type)  3-D: similar to Bar/Column/Line but gives depth and may add to appearance  Order is important  Can “twist” or rotate chart (corner handle) to give a better view Create a Column Graph Open the file named Excel-OfficeTreats. We will use this file to create and edit charts (graphs). Change the Zoom to 75% to make it easier to select data and view charts. 1. Do some prior thinking about what type chart/graph that will best show what you want (see some basic examples and their description on top of next page) 2. Highlight the data that you want to be graphically represented on your chart  Do not include totals unless you want totals for point of comparison  You will be able to edit this info later  As data changes, this chart will also change to reflect the new data 3. Use the Chart Wizard Button (Insert-Chart) – it is very valuable in setting up the majority of the information you want – then you can “fine-tune” it later The wizard has 4 steps:  Type of chart (see listing at end of these notes)  Data Range (should have already “pre”- selected in 1st step above) For useful Documents like this and Lots of more Educational and Technological Stuff... 1 Visit... www.thecodexpert.com
  • 2. For useful Documents like this and Lots of more Educational and Technological Stuff... Visit... www.thecodexpert.com  Add Title and Axis labels (X is horizontal, Y is vertical for 2-D graphs)  Choose where you want the graph (same sheet or its own sheet) 4. Select the Range A5 to G9. (Do not include the totals.) 5. Click the Chart Wizard button. 6. A dialog box will appear. Make sure that the Chart type says Column, and the Chart sub- type is Clustered column with 3-D visual effect. (Middle Left). 7. Use the push button to preview your chart. Click Next. 8. Verify the Data range in Step 2 of 4 of the Chart Wizard. Click Next. 9. Step 3 of 4 will allow you to add a Chart Title and Axis labels. 10. Type Treats by Month in the Chart Title box. 11. Type the X axis label (for horizontal info. Note that is the labels of the data columns. (See example for axis labels.) 12. Type the Z axis label (for vertical info. Note that is the labels of the data rows. (See example for axis labels.) Notice the preview window as you type your titles. (NOTE: Y is used for depth) 13. Click Next when finished. 14. No changes are necessary on the next screen (4 of 4). Click Finish. Move the Chart: The chart will be placed in your worksheet. Notice the handles for sizing and moving.  Click anywhere in the white area of the chart and drag to cell A12. Change the Background:  Right click anywhere on the chart and then click Format Chart Area.  Click Custom in the Borders field. Then choose Red in the Colors field.  Click Shadow and Rounded Corners. (Notice the sample in the lower right corner.)  Click OK. For useful Documents like this and Lots of more Educational and Technological Stuff... 2 Visit... www.thecodexpert.com
  • 3. For useful Documents like this and Lots of more Educational and Technological Stuff... Visit... www.thecodexpert.com  Click on any cell outside of the chart to deselect the chart.  Remember to use Undo if you don't like the results! For useful Documents like this and Lots of more Educational and Technological Stuff... 3 Visit... www.thecodexpert.com
  • 4. For useful Documents like this and Lots of more Educational and Technological Stuff... Visit... www.thecodexpert.com Resize:  Hold down shift key while stretching bottom right corner “handle” to keep from distorting the proportions Formatting Individual Parts of Your Graph:  Bring up Chart Toolbar – VIEW  Toolbars  Chart (or Click within the chart) (or Right click on the toolbars and select Chart.)  Toolbar buttons: Format, Chart Type, Legend, Data Table, By Row, By Column, Angle Text Downward, Angle Text Upward  Formatting Individual parts of your graph – select the part from the Chart Objects drop-down then click on the Format button (1st button to the right of the Object drop-down)  Category Axis (“x”axis) – Pattern (tick marks), Scale, Font, Number/Text Format, and Alignment  Chart Area – Patterns, Font  Legend – Patterns, Font, Placement  Plot Area- Patterns  Value Axis (“y”axis) – Pattern (tick marks), Scale, Font, Number/Text Format, Alignment  Value Axis (“y”) Major Gridlines – Patterns,  Series – Patterns, Axis (separate axis), Y-Error Bars (amount), Data Labels, Series Order, Options (overlap, gap width)  Drawing: VIEW  Toolbars  Drawing Add other drawing features to existing chart (shapes, text, etc) NOTE: You may also click on the area of the chart that you wish to change and go to the format button. LET’S SELECT VALUES AND CLICK ICONS Changing Chart Types:  Chart Type, Legend, Data Table, By Row, and By Column can be clicked/un-clicked at any time  Type – was selected during wizard (highly recommended) but can be altered by clicking on small drop-down arrow to the right of the Chart Type button. You may also click on the chart and click the chart wizard icon to select a new type.  Legend – toggles back-and-forth showing/not-showing the legend in the graph  Data Table – toggles back-and-forth showing/not-showing the data table within the graph  By Row/By Column – allows you to change which header is on which axis – select one or the other (can be toggled at any time)  Format, Angle Text Downward/Upward are used to format individual parts of the chart (see below) For useful Documents like this and Lots of more Educational and Technological Stuff... 4 Visit... www.thecodexpert.com
  • 5. For useful Documents like this and Lots of more Educational and Technological Stuff... Visit... www.thecodexpert.com For useful Documents like this and Lots of more Educational and Technological Stuff... 5 Visit... www.thecodexpert.com
  • 6. For useful Documents like this and Lots of more Educational and Technological Stuff... Visit... www.thecodexpert.com Printing:  Click on any empty cell outside of chart  FILE  Page Setup – make any necessary changes  If you just want the chart, click on it and then FILE  Print Connecting Charts to Word: Linking vs. Embedding in Word  Embedding: Places a copy into Word that will not change regardless of any subsequent changes you make to he original Excel Worksheet  Linking: Allows Word to reflect any changes made to original Excel Worksheet. Choosing to link creates a “path” to the source file – if you change the name of the source file or move it to another location the link/path will be broken. Copying the Graph  Click on the graph and choose copy  Open Word document you want to paste into  Embed: EDIT  PASTE  Link: EDIT  PASTE SPECIAL *Must have Link box checked Click File, then Close. You do not need to save your changes. Create a Pie Chart for One Data Range: 1. Open Excel-Sales 2. Select the range A4 to A8. Now, press and hold the Ctrl key and then select the second range - H4 to H8. 3. Click the Chart Wizard button. 4. Change the Chart type to Pie, and select the Pie with 3D visual effect from the upper middle. 5. Click Next. 6. Verify the range in Step 2 of 4 of the Chart Wizard. Click Next. 7. Type Total Pizza Sales by Flavor for a Chart Title, then click Next. 8. On the next screen, click Finish. 9. The chart will be added to your worksheet. Notice the handles for sizing. 10. Click anywhere in the white area of the chart and drag the new Pie chart to a location just below your Column Chart. 11. Click anywhere off the chart to deselect. 12. Click Print Preview to see how the Charts will look in your document. 13. Click the Close button to exit Print Preview. Click File, then Close. You do not need to save your changes. For useful Documents like this and Lots of more Educational and Technological Stuff... 6 Visit... www.thecodexpert.com
  • 7. For useful Documents like this and Lots of more Educational and Technological Stuff... Visit... www.thecodexpert.com Create an Organization Chart You can use the diagramming tool on the Drawing toolbar to create an organization chart to illustrate hierarchical relationships, such as department managers and employees within a company. (This works both in Word and Excel) Click on the Insert diagram or org chart icon. Insert the desired chart, and simply click on the boxes to enter the text. Insert Shapes: Click on the desired box, and add Subordinates, Co-workers, and Assistants Layout: Allows for formatting justification (left, right, etc) Select: Select a level or a branch, etc, and make changes (such as size or font) that are applied to all. AutoFormat: Allows for several formatting schemes. Zoom: Changes appearance for ease of use. When you add or change an organization chart, the organization chart appears with drawing space around it, outlined by a non-printing border and sizing handles. You can size the organization chart by using sizing commands to make the drawing area larger so you have more room to work, or you can get rid of extra space by fitting the border more closely to the diagram. Format the entire organization with preset styles; or, format pieces of it like you format shapes— add color and text, change line weight and style, and add fills, textures, and backgrounds. Add shapes— such as manager (superior), employee (subordinate), assistant, or coworker— or change branch layout options with the Organization Chart toolbar, which appears when you insert or select the diagram. 1. On the Drawing toolbar, click Diagram or Organizational Chart 2. Click the Organization Chart diagram, and then click OK. 3. Do one or more of the following:  If you want to add text to a shape, right-click the shape, click Edit Text, and type the text.  Text cannot be added to lines or connectors in organization charts.  If you want to add a shape, select the shape you want to add the new shape under or next to, click the arrow on the Insert Shape button on the Organization Chart toolbar, and then click one or more of the following: NOTE: You must uncheck “Auto Format” to change the format of a level or branch. For useful Documents like this and Lots of more Educational and Technological Stuff... 7 Visit... www.thecodexpert.com
  • 8. For useful Documents like this and Lots of more Educational and Technological Stuff... Visit... www.thecodexpert.com Coworker— to place the shape next to the selected shape and connect it to the same superior shape. Subordinate— to place the new shape below and connect it to the selected shape. Assistant— to place the new shape below the selected shape with an elbow connector.  If you want to add a preset design scheme, click AutoFormat on the Organization Chart toolbar, and select a style from the Organization Chart Style Gallery. 4. Click outside the drawing when you are finished. Create a Flowchart Create a work flowchart by assembling various shapes and connectors. Some templates are available through the Help feature. (This works both in Word and Excel) Move a shape Select the shape and when the pointer becomes a four-headed arrow, drag it to a new location. Note The locked connectors attached to the shape move with the shape. To unlock a connector, select the connector and the connection point and drag it off the shape. Add or delete a shape On the Drawing toolbar, click AutoShapes, point to Flowchart, and then click the shape you want. Click where you want to insert the flowchart shape. Note If you want to delete a shape, select the shape and press DELETE. Change the color of a line or connector Select the line or connector you want to change. On the Drawing toolbar, click the arrow next to Line Color. Do one of the following: To change to the default color, click Automatic. To change to another color, click one of the colors below Automatic. Change the style of a line or connector Select the line or connector you want to change. On the Drawing toolbar, click Line Style. Click the style you want; or click More Lines, and then click a style. Add or delete a connector On the Drawing toolbar, click AutoShapes, point to Connectors, and then click the connector line you want. Point to where you want to lock the connector. Connection sites appear as blue circles as you pass the pointer over a shape. Click the first connection site you want, point to the other shape, and then click the second connection site. Locked or attached connectors will keep the shapes connected even when you move the shapes. For useful Documents like this and Lots of more Educational and Technological Stuff... 8 Visit... www.thecodexpert.com
  • 9. For useful Documents like this and Lots of more Educational and Technological Stuff... Visit... www.thecodexpert.com Locked connector Unlocked connector Note To delete a connector, select the connector and press DELETE. Move a connector Do one of the following: Reroute a connector to the closest points between shapes Select one of the connected shapes. On the Drawing toolbar, click Draw, and then click Reroute Connectors. If more than one connector line is attached to an object and you don't want to reroute all the lines, select only the ones you want to reroute, and then click Reroute Connectors. Move a connector Do one or both of the following: To move the connector line, drag one of its ends and connect it to another site or shape. To override the automatic locking of the end, hold down ALT as you drag the end. You can place the end wherever you want on the object, but the end will not be connected. To detach the entire line, drag its middle. Note If the connector line has a yellow “adjustment handle”, dragging the handle will change the shape of the connector line but not detach it. Hold it all together 1. Hold the shift key down and click on each of the objects in the group. 2. Let go of shift key 3. Right click anywhere on objects 4. Click Grouping  Group For useful Documents like this and Lots of more Educational and Technological Stuff... 9 Visit... www.thecodexpert.com
  • 10. For useful Documents like this and Lots of more Educational and Technological Stuff... Visit... www.thecodexpert.com For useful Documents like this and Lots of more Educational and Technological Stuff... Visit... www.thecodexpert.com For useful Documents like this and Lots of more Educational and Technological Stuff... 10 Visit... www.thecodexpert.com