2. 204 Afr. J. Bus. Manage.
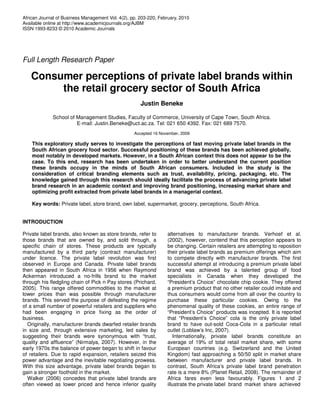
Figure 1. Private label share of market, by value in percentage terms – 2007e (dark) versus 2012e (light).
Source: Planet Retail, 2008.
Figure 2. Share and volume of private label brand sales, as indicated by leading global retailers. Source: Planet
Retail, 2008.
3. Beneke 205
by a host of countries and the share of volume enjoyed LITERATURE REVIEW
by leading global retailers. It is clearly evident that
European and North American retailers excel in this Brand building fundamentals
respect. Emerging markets such as South Africa, Brazil,
China and Russia experience penetration rates below the According to Dick et al. (1997), consumers base
international average and are therefore playing ‘catch up’. judgement of brand quality on direct and indirect factors.
Two anomalies present themselves in terms of Direct attributes include ingredients, taste and texture,
penetration of private label brands in South Africa whilst indirect factors are represented by price and brand
(Nielson, 2006). Firstly, it has been concluded that retail name. Direct factors are usually difficult for consumers to
concentration (essentially an oligopoly scenario in the test without consuming the product, or completing various
retail sector) is highly correlated with success of private tests. Hence, reliance on indirect quality indicators such
label brands. Yet, in South Africa, despite high retail as brand name and price are more heavily relied upon.
concentration enjoyed by the major supermarket chains, The authors thus suggest that a thorough understanding
private label brands have not achieved the successes of of how these indirect cues impact different consumer
their global counterparts. Secondly, lower income groups groups in their purchasing decisions may help retailers to
tend to be the most common purchasers of private label improve success of private label brands. Through further
brands due to higher levels of affordability. In South investigation, they identified brand, package and
Africa, despite a much larger population of lower income advertising as indirect factors which impact consumer
consumers, it is the higher Living Standards Measures perceptions and hence influence purchasing decisions.
(LSM) categories, particularly LSM 6-10, which appear to The success of a brand in the long term is not based on
purchase these brands (ibid). Research suggests that as the number of consumers that buy it once-off, but on the
consumers become increasingly affluent, they are more number of consumers who become regular buyers of the
willing to try various alternatives to trusted brands brand. Thus, repeat purchases and customer loyalty are
(Mawers, 2006). In general, consumers with limited prioritised by retailers (Odin et al., 1999). Chaudhuri and
financial resources are likely to purchase trusted (that is Holbrook (2001) suggest that consumers become brand
manufacturer) brands in which quality is well established loyal when they perceive some unique value in the brand
and thus confidence is high (Rusch, 2002). Another factor that no alterative can satisfy. This uniqueness may be
contributing to this phenomenon has been identified as derived from a greater trust in the reliability of a brand or
accessibility. In South Africa, lower income groups from a more favourable experience when a customer
frequently do not have direct access to the large retail uses the brand. Schoenbachler et al. (2004) take this
stores where private label brands are available. This further, stating that not only does the brand loyal
leads these consumers to shop at local ‘spaza’ outlets customer buy the brand but (s)he also refuses to switch,
which are similar to convenience stores, albeit present in even when presented with a better offer. Bayus (1992)
the informal sector (that is township) areas. These stores proposes that maintaining brand loyalty is becoming a
tend to charge higher prices due to their location, as well critical component in the development of competitive
as not being able to benefit from larger economies of strategy, thus highlighting the importance of developing
scale (Klemz et al., 2006). It is estimated that between methods to measure and evaluate brand loyalty.
ten and twenty percent of fast moving consumer goods, Davis (2002) identified further positive repercussions
sales are estimated to occur through the informal sector resulting from a strong brand other than simply increased
(Blottnitz, 2007), therefore representing a lost opportunity sales. Effective brands have been correlated with
for private label brands. increasing market share; lending credibility to new
product developments; giving a clear, valued and
sustainable point of difference as well as commanding a
premium. Most importantly, consumers appear less price-
RESEARCH STATEMENT sensitive and more trusting towards these brands.
This paper aims to uncover current consumer
perceptions of, and attitudes towards, private label Private label branding
brands in the South African grocery sector. In doing so,
the research will ascertain the impact of various Private label brands are available in a multitude of
demographic factors (with particular reference to formats. There are, essentially, three varieties of private
ethnicity, gender and income) on consumption of private label brands. The first being a representative brand,
label brands. Furthermore, it aims to shed lights on the which is a private label brand that through its name and
effect that pricing, accessibility, packaging, retail packaging announces that it is produced and solely
communications, shelf positioning and in-store owned by the retailer. The second being an exclusive
promotions have on shopping behaviour with reference to private label brand, which is owned and produced by the
purchasing food-based private label brands. retailer, yet this fact is not explicitly conveyed to the
4. 206 Afr. J. Bus. Manage.
consumer through brand name and packaging. The last The first relates to potential increases in profitability,
type is confined labels. These are brands that are not which stems from the higher average price margins these
owned by the retailer but are found exclusively in their brands generate for retailers. These price margins could
stores. This type of private label brand has not been be higher due to the fact that private label brands require
incorporated in this research study. Manufacturer brands minimal advertising expenditure; lower research and
on the other hand are controlled and produced by development costs; reduced costs of testing products
manufacturers and sold through a plethora of retailers. In prior to launching nationally; and, usually, reduced
terms of branding, the general consensus appears to be packaging costs. Furthermore, according to Herstein and
that private label brands are considered “every bit as Gamliel (2006), private label brands can assist in
much a brand as manufacturer’s” (Murphy, 1987). developing loyalty to a retailer and in the creation of a
Ailawadi and Keller (2004) identify at least four tiers of distinct corporate identity for a business. Veloutsou et al.
private label brands. These include low quality generics; (2004) support this view, yet emphasise that as a result,
medium quality private labels; somewhat less expensive careful managerial practices for these brands should be
but comparable quality products; and premium quality implemented in order to maintain retailer brand equity.
private labels that are priced in excess of competitor Consumers tend to associate the retailer with its
manufacturer brands. Whilst the nature of a store’s respective private label brand. Therefore negative
private label brand(s) should be guided, first and perceptions of the retailer may impact negatively on its
foremost, by its target market, the authors suggest that fascia (that is store) brand and vice versa (Ailawadi and
successful retailers will adopt more than one tier of Keller, 2004).
private label brand if they are to achieve wide scale Labeaga et al. (2007) contend that private labels assist
market coverage. building loyalty by differentiating the retailer. These
According to Kumar and Steenkamp (2007), half of brands are available at one retailer exclusively whilst
private label brands are copycat brands. These brands manufacturer brands are available at many competing
essentially attempt to imitate the packaging and content outlets. Regular consumers of private label brands are
of first tier manufacturer brands. Retailers analyse the confronted with psychological costs when switching
contents of leading brands, and then re-create the retailers as their preferred private label choice is no
product, through a process known as reverse engineering longer available. As a result, consumers who change
(ibid). Thus, since there are minimal research and retailers undergo demanding cognitive processes by
development costs, and the retailers have already evaluating other brands, including unfamiliar store
recognised that there is a potentially lucrative market brands, in choosing a new product. Thus, research
available, these products are more often than not indicates that consumers who purchase private label
successful. The retailers use in-store promotions to brands regularly do not only become loyal to that
aggressively promote the brands, using a “me-too at a particular brand but also to the retailer through which it is
cheaper price” strategy (Kumar and Steenkamp, 2007). sold (Collins and Burt, 2003).
This type of strategy involves producing an almost Raju et al. (1995) assert that retailers have become
identical product and offering it at a reduced price relative more proficient at managing their private label brands.
to competitors. As the examples in Figures 3 and 4 Kumar and Steenkamp (2007) add that over the last
reveal, packaging is nearly indistinguishable from decade, private labels have become omnipresent and
competitor brands. have achieved enormous success, thus providing a base
The copycat strategy is not without complications – for the improvement in branding activities. The authors
pursuing this approach may well result in legal tussles. contend that private labels have changed from inferior
Actions of trademark infringement and “passing off” generics to brands in their own right with value beyond
because of consumer confusion, unfair misappropriation functional attributes. Figure 5 demonstrates examples of
of brand owners’ intellectual property can have legal premium quality private label tea brands that are
implications (Mitchell and Kearney, 2002). available at Woolworths. The attractively packaged items
are, arguably, addressing consumer needs of esteem
and status. According to the retailer, it aims to make its
Benefits and drawbacks of selling private label brand synonymous with innovation, excellence and value
brands for money, pitching it as being of the highest quality,
equivalent to (if not better than) the category leaders.
Fernie et al. (2003) have identified various advantages to Retailers should also acknowledge potential pitfalls in
retailers for the development of a private label brand: (1) offering private label brands. Firstly, such brands in many
increased profitability through cost saving and increased product categories may expose the retailer to undue
margins; (2) increased store loyalty and creation of a business risk. This essentially arises from the retailer
distinct corporate identity; (3) opportunities to seize new extending its reach into unfamiliar markets with esta-
market ventures; and (4) increased bargaining leverage blished competitors (Fernie et al., 2003). Secondly, the
with suppliers. private label brand’s reputation may tarnish consumer’’s
5. Beneke 207
perceptions of the retailer if it fails (Veloutsou et al.,
2004). Thirdly, the profitability per square metre
generated by private label brands may not be on a par
with that of manufacturer brands. This may be
attributable to the fact that most private label brands are
priced below their manufacturer brand counterparts
(Kumar and Steenkamp, 2007). Consumers who are
heavy purchasers of private label brands may not prove
to be more profitable in the long run (ibid). This could be
accredited to the fact that these consumers may be
substituting a more expensive manufacturer brand with
the less expensive private label option. The authors
argue that this is sometimes considered an outdated
theory as pricing differentials between private label and
manufacturer brands have been reduced. In the past,
private label products tended to be lower priced generics.
However, more recently, sophisticated private label
Figure 3. Manufacturer ‘copycat’ brands. Captured: Pick n Pay, products have become available and relative prices have
Pinelands, Cape Town. increased accordingly. A local example of this is the Pick
n Pay Choice brand which, according to Prichard (2005),
is usually priced only marginally below most
manufacturer brands.
Consumer perceptions and private label brand
proneness
Jin and Yong (2005) note that the success of private label
brands is dependent on factors such as the country’s
retail structure, the level of retailer concentration, the
advertising rate of manufacturer brands, economies of
scale, management, and even imagination. Baltas (1997)
notes that whilst past behaviour, demographic variables,
socio-economic factors as well as personality traits have
been found to influence private label brand purchasing
behaviour; perceptions, attitudes and behavioural
variables are more effective in this regard. Richardson et
al. (1996), as cited by Baltas (1997), identified familiarity,
extrinsic cues, perceived quality, perceived risk,
perceived value for money and income level as the
primarily influencing factors of private label proneness.
Figure 4. Private label ‘copycat’ brand. Captured: SPAR, Interestingly, younger consumers appear to have a more
Rondebosch, Cape Town.
favourable view towards private label brands than older
generations (Veloutsou et al., 2004). Moschis (2003)
echoes this sentiment, suggesting that older consumers
are more brand loyal and are likely to prefer brands with
which they are more familiar. Younger consumers, on the
other hand, are more willing to try new or unfamiliar
brands and products.
Walker (2006) suggests that due to relatively lower
prices, consumer quality perceptions are negatively
impacted. Private label brands are thus frequently seen
as inferior quality alternatives. This is reiterated by De
Wulf et al. (2005) who suggest that consumers perceive
manufacturer brands to be superior to private label
brands. Yet, Verhoef et al. (2002) present a contrasting
Figure 5. Premium tea brands at Woolworths. Captured: opinion on consumer quality perceptions of private label
Woolworths, Pinelands, Cape Town. brands, contending that consumers do indeed foster a
6. 208 Afr. J. Bus. Manage.
positive attitude towards these brands. Smith and Sparks and development costs result in the retailers’ ability to
(1993) appear to view the situation in a similar light, charge a reduced price (ibid). Furthermore, the authors
proposing that the perceptual gap between private label argue that new private label brand products can be at a
and manufacturer brands is narrowing. Whilst debate is lower cost by test marketing in a few of their own retail
certainly present in the literature with regards to trends in stores. This again contributes to lower research and
consumer perceptions of private label brands, these development costs. In addition, packaging of private label
brands do seem to represent value to hard pressed brands tends to be marginally less expensive, as the raw
consumers. According to Quelch and Harding (1996), materials used are often of a slightly lower quality.
private label share is inversely related to economic However, the factor that has the greatest impact on
strength. Therefore, when the economy is thriving, a overall variable costs is the reduction in advertising
smaller proportion of private label brand products are expenses. Field (2006) concur that the majority of
purchased. Additionally, Nandan and Dickinson (1994) retailers have little or no advertising expenditure with
inferred that during economic recessions, popularity of respect to their private label brands.
private label products increases. Lamey et al. (2007) Kumar and Steenkamp (2007) note that over use of
note, however, that the effects of economic fluctuations promotions by manufacturer brands may condition
are non-symmetrical in terms of growth versus consumers to become price sensitive and this may,
contractions. By way of explanation, the authors eventually, result in a “trade down” to a private label item.
comment that the rate at which consumers adopt private Therefore deal seekers become regular purchasers of
label brands during a recession is faster than the reverse private label brands over time. Putsis and Dhar (2001)
process which occurs after the economic downturn has contrastingly note that promotions of manufacturer
ceased. Thus, once the economy has stabilised, brands based on price are more likely to attract sales
consumers do not rapidly change consumption habits away from lower quality private label competitors, whilst
that were created during the recession. The authors the price promotion of private label brands does not seem
highlight that levels of private label consumption do not to have an equal level of success in this regard.
return to the levels that existed before the advent of the
recession.
Advertising of private label brands
Pricing and in-store promotion of private label In the case of supermarket retailers, communications are
merchandise becoming an increasingly important tool for product
differentiation (Uusitalo, 2001). These retailers operate in
Price represents an extrinsic cue and provides one of the a slow-growth market and products are becoming
most important forms of information available to increasingly homogenous, hence the importance of
consumers when making a purchasing decision (Jin and communications as a means of distinguishing one retail
Sternquist, 2002). According to the authors, price brand from another.
constitutes 40% of the average consumer’s information According to Kim and Parker (1999), it is difficult to
search. Avlonitis and Indounas (2005) underline the measure the success of private label brand advertising.
importance of pricing decisions in terms of a company’s This is attributed to the manner in which advertising costs
long term profitability. The authors emphasise the are internalised within the retailing organisation. Berry
flexibility of pricing – pricing strategies can be adapted (2000) adds that brands, such as private labels, which fall
more quickly than other marketing facets. As alluded to under the “umbrella image” of a company, are essentially
previously, this is particularly applicable with regard to promoted in conjunction with all company promotions.
private label brands as they are under full control of the For example, based on Berry’s argument, it would appear
retailer, and are free from the manufacturer’s pricing that Pick n Pay No Name brand is promoted through all
strategies and considerations (Uusitalo and Rokman, Pick n Pay advertising and promotions due to the manner
2007). in which these brands are associated with one another by
Manufacturer and private label brand prices tend to consumers.
vary among different retailers and certain products types. Figure 6 illustrates an advertisement for “Pick n Pay’s”
Davies and Brito (2004) suggest that although price foremost private label - No Name brand. The blue and
elasticities have a large effect on pricing decisions, white colour theme clearly brings to mind associations for
generally the price advantage of private label brands is both fascia and private label brands.
inclined to have approximately 20 to 44% higher gross Abe (1995) queries whether high quality producers
profit margins. A variety of reasons are suggested as to should advertise more than low quality producers or if low
why private label brands tend to be more cost effective. quality producers should advertise more in order to
Firstly, as previously mentioned, this can be attributed to compensate for their relative product disadvantage.
private label brands often being imitations of manu- Private label brands are generally assumed to be of an
facturer brands. Thus the limited associated research inferior quality to manufacturer brands and thus represent
7. Beneke 209
Figure 6. Pick n Pay branding advertisement. Source: Pick n Pay website.
these two quality alternatives for the purposes of this Building upon this, Ampuero and Vila (2006) consider
argument (De Wulf et al., 2005). Advertising accentuates packaging to be the most important communications
predilections for a brand, thus differentiating it from medium for the following reasons: (1) it reaches almost
competitors. It would appear that increased advertising all buyers in the category; (2) it is present at the crucial
does not increase sales at a rate that would make this moment when the decision to buy is made; and (3)
expenditure more lucrative for private label brands. buyers are actively involved with packaging as they
Therefore, Abe (1995) asserts that private label brands’ examine it to obtain the information they need. It is
potentially inferior quality does not necessitate a larger interesting to note that, according to one particular study,
advertising budget than manufacturer brands in order to nine out of ten purchasers occasionally buy on impulse,
compete. Baltas (2003), on the other hand, suggests that and these unplanned purchases are generally as a result
manufacturer brands cannot often compete with private of striking packages or in-store promotions (Nancarrow et
label brands in terms of pricing and thus advertising plays al., 1998).
a vital role in product differentiation for manufacturer Meyer and Gertsman (2005) argue that differences in
brands. Retailers are therefore challenged to promote packaging between private label and manufacturer
their range of private label brands without large scale brands have been reduced over time. Quality
advertising. This is often achieved through placement of improvements and decreases in price differentials
one or two private label products – alongside their between private label and manufacturer brands have led
manufacturer-branded counterparts – in a newspaper to an increase in the importance placed on packaging –
insert or the co-branding of both fascia and private label the authors identify this form of communication as a key
brands in a television advert. Nonetheless, retailers are source of product and brand differentiation. According to
mindful that private label brands need to be self promoted Nogales and Gomez (2005), packaging by private label
to some degree and that excessive advertising thereof is brands is specifically selected in order to facilitate product
almost certainly unwarranted. comparison. “Pick n Pays” No Name brand is immediately
identifiable by its blue and white packaging, and likewise
for Checkers’ Housebrand through its teal, white and
The effect of packaging magenta packaging.
Halstead and Ward (1995) highlight the fact that
Underwood et al. (2001) state that there has been an
retailers have re-evaluated the importance of packaging
emerging trend to use packaging as a brand
for their private label brands. Thus retailers are placing
communications vehicle. The authors describe the
more emphasis on adding colour or modifying packaging
primary role of product packaging as a means to
to appear more like competing manufacturer brands.
captivate consumer attention by breaking through the
Furthermore, in some instances, packaging quality is of
competitive clutter. According to Ampuero and Villa
an excellent standard (Suarez, 2005), making it
(2006), packaging plays a crucial role, especially from the
somewhat difficult to distinguish between private label
consumer’s perspective. This is due to the fact that a
and manufacturer brands on shelf. Copy-cat branding
product’s packaging is what first attracts a consumer. The
often involves utilizing the colour of the brand leader in
author asserts that as self-service sales environments
the category. For example, private label cola brands are
have increased, the role of packaging has gained
often featured in red to associate themselves with Coca-
momentum. Thus, packaging has become the “salient
Cola.
salesman” as it informs consumers of the qualities and
benefits of a product. This substantiates Fielding’s (2006)
argument that packaging plays the lead role in building a Apportioning shelf space
private label brand. The author takes this one step
further, suggesting that packaging has a long-lasting Amrouche and Zaccour (2006) describe shelf space as
effect in the minds of consumers and is thus a manner in “one of the retailer’s most important assets”. This vital
which to blur manufacturer brands’ distinctiveness. resource is limited and therefore allocations can play a
8. 210 Afr. J. Bus. Manage.
key strategic role. Retailers ultimately hold this trump and Asian consumers constitute the remaining 20%. The
card with respect to negotiations. Allocations to private majority of the sample falls into the 26 to 35 year old age
label have been known to be as sizable as twice that category, reflecting 42% of respondents. The 16 to 25
apportioned to manufacturer brands (Nogales and and 36 to 45 year old age categories represent similar
Gomez, 2005). In addition, Suarez (2005) notes that numbers of respondents with approximately 19% each.
retailers purposefully allocate their private label brands to Individuals of 46 years of age and older constitute the
more advantageous positions on the shelves, such as remainder (20%) of the total sample. Thus, a relatively
placing their own brands directly to the right of the broad spread of age categories is achieved. However,
manufacturer brands they are competing against. This representation is skewed towards the younger segments.
being due to the fact that 90% of the population are right Over half of the sample is currently married, whilst
handed and are thus theoretically more likely to reach for approximately 44% are unmarried. Less than 4% of the
the private label alternatives (ibid). sample is either divorced or widowed. The majority of the
According to Hwang et al. (2004) the level on which the sample (52%) lives in households consisting of between
product is displayed has a significant effect on sales. For three and five people. A further 38% live with two or less
instance, a product which is located at eye-level falls people and a mere 10% live with more than six people in
within the average consumer’s line of vision, attracting their homes. The majority of the respondents (55%)
his/her attention, and hence increasing the likelihood of speak English as their mother tongue. Xhosa-speaking
the product being chosen. De Wulf et al. (2005) concurs individuals represent a further 24% of responses with the
with this premise and emphasises the influential role that remaining 21% are spread between Afrikaans, Sotho,
shelf positioning of a private label brand can play with Zulu and other language groups. The largest proportions
regard to sales of these products. of employment represented in the sample are clerical,
casual and executive with 22, 16 and 17% respectively. A
mere 6% of the sample is unemployed, a further 9% are
METHODOLOGY students and 2% are retired. Hence, a total of 17% of the
sample are currently not actively working.
Insights into the industry were gleaned through four experience
interviews with marketing professionals across the retail and supply
The sample is largely in keeping up with 2008 All Media
platforms. This included representatives from the two largest and Product Survey (AMPS) data with respect to urban
supermarket groups in South Africa. The findings from these supermarket shoppers in South Africa. However, it is
interviews informed the quantitative research design. acknowledged, that the sample is slightly biased towards
A non-probability, convenience sampling technique was used to higher income earners, in part due to the completion of a
administer a consumer survey. Although predefined quotas were number of questionnaires online. Nonetheless, this was
not strictly set, the researchers endeavoured to obtain a sample
which was somewhat representative of supermarket shoppers in
not seen as a serious impediment to the credibility of the
South Africa. 163 questionnaires were deployed using the self- study.
administered, mall intercept method at local shopping centres in
Johannesburg, Durban, Limpopo and Cape Town. This approach
was adopted so as to facilitate expedient questionnaire completion. Quality and price perceptions of private label brands
A preliminary check was done in the field, to identify and remedy
any inconsistencies, omissions or obvious mistakes with the
questionnaire. A central office check was thereafter performed to The proportion of private label brand purchasers in the
alleviate less glaring errors. An online questionnaire was also setup, sample is notably high with 84% of respondents
from which a further 178 respondents contributed their views. This confirming that they have purchased these brands
administrative method was extremely efficient as respondents were before. This would suggest that there is a substantial
unable to electronically submit the questionnaire if there were any potential market for private label brands in the South
technical errors at the time of completion. The data from both online
and self-administered questionnaires was then captured, cleaned,
African environment. Furthermore, this serves to
coded and analysed. Finally, the data was tested for normality and authenticate the perceptions and attitudes revealed in the
this was confirmed to be in order. survey as the majority of respondents have experience in
this respect.
Walker (2006) revealed varying perceptions in the
EMPIRICAL FINDINGS literature with regard to the quality of private label brands.
However, for the most part, these were empirically found
Composition of the sample to be negative. According to the survey findings, the
majority of consumers (66%) were either relatively neutral
The sample is deemed to be somewhat representative of or negative in their attitude towards private label brand
the urban supermarket shopping population in South quality levels. Only one in three respondents expressed a
Africa. In terms of gender, slightly more females (55.1%) positive view concerning their perceptions of private label
completed the questionnaire than males (44.9%). The brands. This is depicted in Figure 7. It is clear that South
predominantly comprised black and white respondents Africans are still somewhat sceptical about the quality of
with a 41 and 39% share, respectively. Coloured, Indian private label brands which may partially explain why
9. Beneke 211
50% 48%
45%
40%
Percentage of respondents
34%
35%
30%
25%
18%
20%
15%
10%
5%
0%
Positive Neutral Negative
Quality perceptions of private label brands
Figure 7. Quality perceptions of private label brands in South Africa.
penetration of private label brands in the grocery sector is with positive quality connotations. It appears that Shoprite
relatively poor. The silver lining here may be that 60% of shoppers (LSM 4-7) do not purchase the ‘Ritebrand’ out
respondents felt that private label brands had improved in of preference, but rather necessity. Retailer profiles may
quality since their introduction. Should advancement of be found in the appendix.
such brands persist, perceptions may well be radically These findings are congruent with the split between
different in the future. manufacturer and private label brands sold by the
Respondents did however display an association respective retailers. This is represented in Figure 10 on
between quality and price. To this end, price does appear the following page. Just over half the numbers of
to be a leading indicator of quality. Figure 8 suggests that respondents (52%) who shop at Pick n Pay are
low prices and low quality are paired, as are medium consumers of their private label brands. And eight out of
quality and medium prices. ten Woolworths shoppers (78%) purchase their own label
Somewhat surprisingly, high quality and high prices are products. Shoprite, Checkers and SPAR feature far less
not strongly associated. This may be due to the nature of prominently in this respect. Again, this underscores the
private label brands which offer favourable quality to fact that higher LSM shoppers are more inclined to buy
consumers and, due to being more competitively priced private label brands when available. It may be inferred
than mainstream manufacturer brands, offer superior that their propensity for risk is somewhat higher than less
value for money. Additionally, the clustering of high affluent shoppers, who may not be in a financial position
quality, low quality and low price may be attributed to to make a ‘mistake’ with an unfamiliar (or less trusted)
variability in the market whereby some private label brand.
brands offer much better value than others. This is T-tests were conducted to ascertain whether
investigated below. purchasers of private label brands tend to perceive these
Figure 9 represents the analysis of a comparison of brands differently to non-purchasers. The results are
each retailer in terms of their customers’ views towards included in Table 1.
their range of private label brands. Respondents with Perceptions around quality, price and reliability differed
positive perceptions, as would be expected, purchase remarkably between purchasers and non-purchasers.
greater quantities of these brands in most cases. These attributes were all highlighted at the 1%
Respondents who consider private label brands as good significance level, revealing a very high degree of
quality tend to purchase the Woolworths (78%), Pick n significance. Location and packaging were not seen as
Pay Choice (67%) and Pick n Pay No Name (70%) differentiating factors between purchasers and non-
brands. It is interesting to note that these retailers cater purchasers. The former is unlikely to be a differentiating
predominantly to the LSM 6 to 10 market segment. factor as the major supermarket chains have achieved
Shoprite ‘Ritebrand’ is the only brand with converse ubiquitous coverage of South African urban areas. All
results - respondents who indicated negative quality supermarket retailers included in this study stocked at
associations purchased more of this brand than those least private label brand, therefore making these
10. 212 Afr. J. Bus. Manage.
2D Plot of Row and Column Coordinates; Dimension: 1 x 2
Input Table (Row s x Columns): 5 x 5
Standardization: Row and column profiles
0.5
0.4 I
Dimension 2; Eigenvalue: .02346 (24.17% of Inertia)
0.3
B
0.2
0.1 F A
G
0.0 E C
H
-0.1
-0.2
D
-0.3
-0.4
-0.5
-0.6 J
-0.7
-0.8
Row .Coords
-0.8 -0.7 -0.6 -0.5 -0.4 -0.3 -0.2 -0.1 0.0 0.1 0.2 0.3 0.4
Col.Coords
Dimension 1; Eigenvalue: .07148 (73.65% of Inertia)
Blue Red
A = high quality F = low price
B = medium to high quality G = medium to low price
C = medium quality H = medium price
D = medium to low quality I = medium to high price
E = low quality J = high price
Figure 8. Correspondence map - quality versus price perceptions.
90%
78%
80%
70%
67%
70%
60%
50% 46% Positive
41%
40% 34% Negative
33%
29% 28%
30%
16%
18%
20%
7%8% 9%
10% 5% 5% 5% 3%
0%
Housebrand
Woolworths
Checkers
Pick 'n Pay No
Spar Brand
Spar Freshline
Pick 'n Pay
Pick 'n Pay
Shoprite Rite
Foodhall
Choice
Checkers
Choice
brand
brand
Name
Figure 9. Retailer comparison - percentage of purchasers by perception classification.
11. Beneke 213
120%
100%
22%
80% Do not purchase retail
48%
private label brand
Percentages
62%
68%
60%
85%
Do purchase retail private
label brand
40% 78%
52%
20% 38%
32%
15%
0%
Pick 'n Pay Woolworth Shoprite Checkers Spar
Retailers
Figure 10. Retailer comparison - share of manufacturer versus private label brands.
Table 1. T-tests determining differences in perceptions between private
label brand purchasers and non-purchasers.
T-tests; Grouping: do you purchase
Variable private label brands?
t-value df p
Quality -5.72436 339 0.000000
Price 2.70262 339 0.007226
Reliability -3.34567 339 0.000913
Attractive packaging -0.26027 339 0.794813
Location -1.17171 339 0.242138
easily accessible. As explained later in this discussion, product, trust in the brand and, thereafter, the price tag.
packaging was found to be substandard, across the This illustrates that consumers are not completely fixated
board, therefore reducing its impact as a differentiating with the price charged and therefore points of
factor between purchasers and non-purchasers of private differentiation do exist beyond this single criterion.
label brands.
The most important criteria in the purchasing of private
label brands were probed. Here, respondents were asked Demographic variables affecting loyalty to existing
to indicate the most important aspect in the decision manufacturer brands
process. The ranked results are displayed in Table 2
below, along with the percentage of respondents who The majority of respondents (77%) preferred to visit
indicated that to be the case. retailers where their brands of preference were readily
Perceived quality of the product was considered to be available and well stocked. Brand loyalty towards leading
of the utmost importance, followed by accessibility of the manufacturer brands was probed on a demographic
12. 214 Afr. J. Bus. Manage.
Table 2. Key factors in the private label brand decision process.
Rank Factor Percentage of respondents
1 Perceived quality 30%
2 Accessibility of products 21%
3 Trust in brand 20%
4 Price charged 12%
5 Various other 17%
Table 3. Levels of brand loyalty with respect to ethnicity.
Black (%) White (%) Coloured (%) Indian (%)
Yes 80.00 72.73 91.43 74.19
No 20.00 27.27 8.57 25.81
Total 100.00 100.00 100.00 100.00
Table 4. Levels of brand loyalty with respect to gender.
Male (%) Females (%)
Yes 74.03 80.21
No 25.97 19.79
Total 100.00 100.00
Table 5. Levels of brand loyalty with respect to income.
1 2 3 4 5 6 7 8
less than 100 1000-3000 2001-3000 3001-5000 5001-7000 7001-10000 10000-20000 20000+
(%) (%) (%) (%) (%) (%) (%) (%)
Yes 82.35 78.05 84.44 72.97 74.19 76.92 76.19 70.59
No 17.65 21-95 15.56 27.03 25.81 23.08 23.81 29.41
Total 100.00 100.00 100.00 100.00 100.00 100.00 100.00 100.00
basis in order to ascertain the likelihood of these earners (above R 20 000 per month) were also the least
consumers converting to, or at least trialling, a private loyal to manufacturer brands. This finding supports the
label brand alternative. The demographic variables were assertion of Frank Dell, a management consultant for
each considered so as to establish which segments retailers, wholesalers and manufacturers in the United
classified themselves as loyal with respect to a particular States, who suggests that lower income earners are
brand. The question was therefore posed: “When you more inclined to buy a trusted brand than potentially
visit a retailer is it important to you that specific brands waste money trying unknown brands (Rusch, 2002).. This
are offered at that store? For example do you choose reservation was likewise found to be true in this study.
one store above another based on the availability of your
preferred brands?” The results are displayed in Tables 3,
4 and 5. Product packaging
In terms of gender, a marginally greater degree of
brand loyalty was observed in females. In terms of Product packaging was highlighted in the literature as an
ethnicity, Coloured respondents appeared extremely loyal important component of conveying a signal of quality to
to manufacturer brands, followed by black, Indian and consumers. The following graph (Figure 11) illustrates
white respondents. A trend was evident when considering that perceptions of private label brand packaging are
brand loyalty based on income levels. Here, less affluent most often negative. Almost two thirds of respondents
consumers (earning below R 3 000 per month) recorded (63%) felt that packaging was unattractive and a mere
the highest levels of brand loyalty. A decrease in loyalty 16% responded positively with regard to this product
was evident as monthly income increased. The highest characteristic. Furthermore, it would appear that the
13. Beneke 215
70%
63%
60%
Percentage of respondents
50%
40%
30%
21%
20% 16%
10%
0%
Positive Neutral Negative
Level of agreement
Figure 11. Packaging perceptions of private label brands.
majority of private label brand packages do not visually conveying private label brand benefits were billboards,
display the actual product contents. In a society with high magazines and internet/online methods. It would
rates of illiteracy, this may prove detrimental to product therefore appear that the media that it is consumed within
sales by failing to encourage conversion from the mass the home, the same environment in which grocery
market. products are consumed, work best.
Relationships between perceived quality of the product
and the packaging thereof were investigated. The
correspondence map (Figure 12) suggests strong Conclusions
associations between attractive packaging and inner
product quality, as well as strong associations between South African consumers seem hesitant to embrace
unattractive packaging and low to medium quality inner private label brands to the full. There appears to be
contents. scepticism surrounding the quality of the entire spectrum
It would therefore seem that attractive packaging is of such brands, with significant heterogeneity between
essential to persuade the target market that the core specific private label brands. South African retailers have
content is of similar quality to other manufacturer brands taken varying stances in terms of positioning their private
in that product category. label brands, which can principally be categorised into
two contrasting approaches. Firstly, private label brands
can be positioned as premium quality products with price
External influences affecting purchasing decisions levels ranging from marginally below to above prices of
category-leading manufacturer brands. Examples of
Purchasing of groceries in a supermarket is influenced by these private label brands include the Woolworths and
a number of extrinsic cues. As seen in Table 6, black and the Pick n Pay Choice private label brands. On the hand,
white respondents tend to rely considerably more on the retailers can position their private label brands based on
opinions of family than do their Indian and coloured pure value for money. This equates to average quality
counterparts. On the other hand, Indian and coloured products at very affordable prices. Private label brand
consumers are considerably more influenced by communication strategies have successfully reached a
advertising than their black or white counterparts. large proportion of the South African market. However,
Respondents indicated that television, newspapers and overall effectiveness in terms of influencing perceptions
pamphlets were the most effective means of appears to be unsuccessful and the direct impact on
communicating the benefits of private label brands to volume share appears negligible. Home-based media,
grocery shoppers. Table 7 illustrates that the majority of wherein grocery retailers are known to advertise their
respondents consistently feel that television is the most wares, were found to be the most effective in relaying the
effective way of communicating the advantages offered message to consumers. Demographic variables were
by these brands. The media found to be least effective at largely ineffective in determining an individual’s propensity
14. 216 Afr. J. Bus. Manage.
2D Plot of Row and Column Coordinates; Dimension: 1 x 2
Input Table (Row s x Columns): 5 x 5
Standardization: Row and column prof iles
0.3
Dimension 2; Eigenvalue: .02657 (22.73% of Inertia) A
0.2
1 D 3
0.1
C
0.0
E
-0.1 4
2
-0.2
-0.3 5
-0.4 B
-0.5
-0.6
Row .Coords
-1.0 -0.8 -0.6 -0.4 -0.2 0.0 0.2 0.4
Col.Coords
Dimension 1; Eigenvalue: .08369 (71.62% of Inertia)
A = attractive packaging 1 = high quality
B = above average 2 = medium to high quality
C = average 3 = medium quality
D = below average 4 = medium to low quality
E = unattractive packaging 5 = low quality
Figure 12. Correspondence map - product quality versus packaging attractiveness perceptions.
Table 6. Influencers based on ethnic profiles.
Black (%) White (%) Coloured (%) Indian (%)
Friends 10.30 13.01 7.69 8.79
Family 21.93 19.92 14.29 13.19
Sales personnel 5.32 5.69 7.69 7.69
In-store 8.97 6.10 9.89 12.09
Store atmospherics 8.97 6.50 9.89 10.99
Past experience 35.88 41.87 35.16 30.77
Advertising 8.64 6.91 15.38 16.48
Table 7. Advertising techniques deemed most effective for private label brands..
Percentage of respondents Percentage of respondents who considered
the medium least effective
In-store promotions 19.06 10.19
Internet 9.68 20.18
Magazines 9.09 19.20
Newspapers 57.77 4.70
Television 74.49 3.92
Word of mouth 47.51 3.43
Direct mail 19.35 9.50
Billboards 5.87 25.86
Pamphlets 57.77 3.04
15. Beneke 217
to buy private label brands. However, income was found Against Its Private-Label Clone, J. Bus. Res. 31 (2), 241 – 250.
Nielson AC (2006). Retailer Own Brands: Insights from Category to
to be the most prominent of all variables, revealing a
Consumer to Chain. Executive summary available from:
direct relationship between income and affinity towards http://www.bizcommunity.com/Article/196/19/11899.html (21 March
private label brands, although presumably premium 2007)
private label options. Unfortunately, private label brand Ailawadi K, Keller K (2004). Understanding retail branding: conceptual
insights and research priorities, J. Retailing 80: 331 – 342
packaging was considered, for the most part, to be
Ampuero O, Vila N (2006). Consumer perceptions of product
unattractive and failed to convey a sense of high product packaging, J.Consumer Mark. 23(2): 100 – 112.
quality. Packaging is regarded by many marketers to be a Amrouche N, Zaccour G (2006). Shelf-space allocation of national and
‘salient salesman’ and is thus thought to have evolved private brands. Eur. J. Oper. Res. 180: 648-663.
Baltas G (1997). Determinants of store brand choice: a behavioural
into an important facet of product differentiation. Sadly, analysis, J. Product Brand Manage. 6 (5), 315 – 324.
South African retailers appear to lag behind their Baltas G (2003). A combined segmentation and demand model for store
European counterparts rather drastically in this respect. brands, Eur. J. Market.37 (10): 1499 – 1513.
Bayus B (1992). Brand Loyalty and marketing strategy: An application
to home appliances, J. Mark. Sci. 11(1), 21-38.
Berry L (2000). Cultivating service brand equity. J. Acad. Mark. Sci. 28
AREAS FOR FUTURE RESEARCH
(1): 128 – 137.
Blottnitz M (2007). Review of the South African Wholesale and Retail
This is an exploratory study which only scratched the Sector and its Small Enterprises in 2007. University of Cape Town,
surface of private label branding in the retail grocery Cape Town.
sector. A number of pivotal issues did however come to Chaudhuri A, Holbrook M (2001). The Chain effects from brand Trust
and brand effect to brand performance: The role of brand loyalty, J.
the fore which were not explicitly covered in this study. Mark. 65 (2): 81-93.
These are listed below for possible further research Checkers (2009). Available from: http://www.shopriteholdings.co.za/
projects. pages/1019812640/about-our-company/Group-Composition.asp
The manufacturer-retailer relationship was revealed to [Accessed: 7th May].
Collins A, Burt S (2003). Market Santions, Monitoring and vertical co-
be a hindrance to effective private label brand growth in ordination with retailer manufacturer relationships: the case of retail
the South African market. Due to a very limited number of brand suppliers, Eur. J. Mark. 37 (5/6): 668-689.
major suppliers in South Africa (notably Unilever, Procter Davies G, Brito E (2002). Price and quality competition between brands
and Gamble, Nestle and Tiger Brands), retailers have and own brands - A value systems perspective, Eur. J. Market. 38(1):
30 – 55.
limited bargaining power in persuading such manu-
Davis S (2002). Brand Asset Management: how businesses can profit
facturers to supply content for their private label brands. from the power of brand, J. Consumer Mark. 19(4): 351 – 358.
Hence, this interaction should be further investigated in De Wulf K, Odekerken-Schröder G, Goedertier F (2005). Consumer
an attempt to uncover means through which both sets of perceptions of store brands versus national brands. J. Consumer
Mark. 22 (4): 223 – 232.
parties can achieve a symbiotic relationship in the long Dick A, Jain A, Richardson P (1997). How consumers evaluate store
term. brands, J. Prod. Branagend Mament, 5 (2): 18 -24.
The black emerging middle class, who seemingly have Farquhar J (2007). Mission Impossible? Woolworths, [Online],
exponential spending power, may present a future Available: http://www.leader.co.za/article.aspx?s=23&f=1&a=360.
Accessed: 7 May 2009.
lucrative market for private label brands. Therefore, Fast-Moving (2007). The Retail exchange. Pick n Pay Group Strategy
investigations into this rapidly growing market segment Page. [Online]. Available from: http://www.fastmoving.co.za/
may reveal insightful and beneficial findings in order for retailers/pick-n-pay [Accessed: 7th May 2009].
retailers to effectively position and differentiate their Fernie J, Fernie S, Moore C (2003). Principles of Retailing, Butterworth-
Heinemann, Oxford.
private label brands.
Field B (2006). Store brands take over, J. Commerce 18 – 22.
The effectiveness of in-store promotions could be Fielding M (2006). No longer plain, simple: Private label brands use new
probed to determine how brand conversions may be tools to compete, Brand Marketing, (15 May)
achieved at the point of sale. This is a complex matter Halstead D, Ward C (1995). Assessing the vulnerability of private label
brands, J. Prod. Brand Manage. 4(3): 38-48.
and certainly merits further investigation.
Herstein R, Gamliel E (2006). The Role of Private Branding in improving
service quality, J. Manag. Serv. Qual. 16 (3): 306 -319.
Hwang H, Choi B, Lee M (2004). A model for shelf space allocation and
ACKNOWLEDGEMENT inventory control considering location and inventory level effect on
demand, Int. J. Prod. Econ. 97: 185 – 195.
Jin B, Sternquist B (2002). The influence of retail environment on price
Inspiration and some materials for this paper were drawn perceptions: An exploratory study of US and Korean students,
from a UCT Marketing Honours (2007) thesis by S. International Market equity, J. Market. 57: 1-22.
Beaumont, J. Brett and J. Kreft. The thesis was Jin B, Yong G (2005). Integrating effect of consumer perception factors
in predicting private brand purchase in a Korean discount store
supervised by the author of this article.
context, J. Consumer Mark. 22(2): 62-71.
Kim N, Parker P (1999). Collusive conduct in private label markets. Int.
J. Res. Market. 16(2):143-155.
REFERENCES Klemz B, Boshoff C, Mazibuko N (2006). Emerging markets in black
South African townships: Small local independently owned versus
Avlonitis G, Indounas K (2005). Pricing objectives and pricing methods large national retailers, Eur. J. Mark. 40(5): 590 – 611.
in the services sector. J. Services Market. 19(1): 47-57. Kumar N, Steenkamp J (2007) Private label strategy: how to meet the
Abe M (1995). Price and Advertising Strategy of a National Brand. store brand challenge, Harvard Business School Press, Boston.
16. 218 Afr. J. Bus. Manage.
Labeaga J, Lado N, Martos M (2007) Behavioral loyalty toward store choenbachler D, Gordon G, Aurand T (2004) Building brand loyalty
brands, J. Retailing Consumer Serv. 1 (1): 1-10. through individual stock ownership. J. Prod. Brand Manage. 13 (7):
Lamey L, Deleersnyder B, Dekimpe M, Steenkamp J (2007). How 488-497.
Business Cyles contribute to private label success: Evidence from the Shoprite (2009). [Online]. Available from:
United States and Europe, J. Mark. 7: 1 – 15. http://www.shopriteholdings.co.za/pages/1019812640/about-our-
Loblaws Inc (2007). The PC story: A recipe for success, [Online]. company/Group-Composition.asp [Accessed: 7th May].
Available from: http://www.presidentschoice.ca/AboutPC/Story.aspx Smith D, Sparks I (1993). The Transformation of Physical Distribution
(23 September ). Retailing: The example of Tesco Stores. As cited in Veloutsou, C.,
Mawers S (2006) South Africa’s Black Diamonds. Business in Africa Gioulistanis, E. and Moutinho, L. (2004). Own labels choice criteria
magazine. Avaliable from: http://business.iafrica.com/african_ and perceived characteristics in Greece and Scotland: Factors
business/features/592855.htm. (7 May 2007) influencing the willingness to buy, J. Prod. Brand Manage. 13(4):
Meyers H, Gertsman R (2005). The Visionary Package. Palgrave 228-241.
MacMillan, China. SPAR. About Us Page. (2009). [Online]. Available from:
Mitchell V, Kearney I (2002) A critique of legal measures of brand http://www.spar.co.za/Aboutus75.aspx [Accessed: 7th May].
confusion, J. Product and Brand management, 11(6):357-379. Suarez M (2005). Shelf space assigned to store and national brands: A
Moschis G (2003). Marketing to older adults: an updated overview of neural networks analysis, Int. J. Retail Distrib. Manage. 33 (11), 858
present knowledge and practice, J. Consumer Market. 20(6), 516 – – 878.
525. Uusitalo O (2001). Consumer perceptions of grocery retail formats and
Murphy J (1987). Branding Key Marketing Tool, The MacMillan Press brands. Int. J. Retail Distrib. Manage. 29(5): 214-225.
Ltd, Hong Kong. Underwood R, Klein N, Burke R (2001). Packaging communication:
Nancarrow C, Wright L, Brace I (1998). Gaining competitive advantage attentional effects of product imagery. J. Prod. Brand Manage. 10(7),
from packaging and labeling in marketing communications, Br. Food 403 - 422.
J. 100(2), 110-18. Veloutsou C, Gioulistanis E, Moutinho L (2004). Own labels choice
Nandan S, Dickinson R (1994). Private Brands: Major Brand criteria and perceived characteristics in Greece and Scotland:
Perspective, J. Consumer Market. 11: 18–28. Factors influencing the willingness to buy, J. Prod. Brand Manage. 13
Nirmalya K (2007). The right way to fight for shelf domination, (4): 228-241.
Advertising Age, 78(4): 24 – 35. Verhoef P, Nijssen E, Sloot L (2002). Strategic Reactions of National
Noble B, Davey S (2008). Woolworths opens three-level store. E-Prop. Brand Manufacturers towards Private Labels, Eur. J. Mark. 36 (11),
Available:http://www.eprop.co.za/news/article.aspx?idArticle=9765. 1309-1326.
Dated 29/01/2008. Walker J (2006). Bye-Bye Big Brands, J. Mark. 28 (17): 23.
Nogales F, Suarez G (2005). Shelf space management of private Woolworths. Our Company. (2009). [Online]. Available from:
labels: A case study in Spanish retailing, Journal of retailing and http://www.woolworths.co.za/caissa.asp?Page=ITB4_RHContext&Po
consumer services 12(2), 205-216. st=CO-History [ Accessed : 7th May].
Odin Y, Odin N, Valette-Florence P (1999). Conceptual and operational
aspects of brand loyalty: An impirical investigation, J. Bus. Res. 53:
75-84.
Planet Retail. (2008). Private Label Trends World Wide. Presentation
delivered in Mumbai, India by Paul Martin, Global Sales Manager.
Prichard D (2005). The four legs of the table – Raymond Ackerman’s
simple, straight-forward formula for success, David Phillips
Publishing, South Africa.
Putsis W, Dhar R (2001) An empirical analysis of the determinants of
category expenditure, J. Bus. Res. 52: 277 – 291.
Quelch J, Harding D (1996). Brands Versus Private Labels: Fighting to
Win, Harv. Bus. Rev. 37: 99–109.
Raju J, Sethuraman R, Dhar S (1995). The introduction and
performance of store brands, J. Manage. Sci. 41 (6): 957-978.
Richardson P, Jain A, Dick A (1996). The influence of store aesthetics
on evaluation of private label brands, J. Product Brand Manage. 5(1):
19 -28.
Rusch R (2002). Private labels: Does branding matter? Brand Channel,
New York, Available: http://www.brandchannel.com/features_
effect.asp?pf_id=94. Dated 6 May.
SAARF (2009). Living Standards Measures. [online]. Available:
http://www.saarf.co.za/LSM/lsm-presentations.htm. Accessed 29
September.