Rocket and fuse_observations_of_ic405_differential_extinction_and_fluorescent_molecular_hydrogen
•
0 likes•445 views


Recommended
Recommended
More Related Content
What's hot
What's hot (20)
Viewers also liked
Similar to Rocket and fuse_observations_of_ic405_differential_extinction_and_fluorescent_molecular_hydrogen
Similar to Rocket and fuse_observations_of_ic405_differential_extinction_and_fluorescent_molecular_hydrogen (20)
More from Sérgio Sacani
More from Sérgio Sacani (20)
Rocket and fuse_observations_of_ic405_differential_extinction_and_fluorescent_molecular_hydrogen
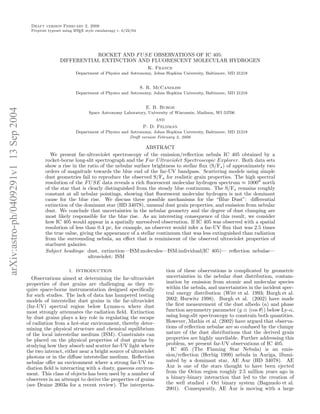
- 1. Draft version February 2, 2008 Preprint typeset using L TEX style emulateapj v. 6/22/04 A ROCKET AND F U SE OBSERVATIONS OF IC 405: DIFFERENTIAL EXTINCTION AND FLUORESCENT MOLECULAR HYDROGEN K. France Department of Physics and Astronomy, Johns Hopkins University, Baltimore, MD 21218 S. R. McCandliss Department of Physics and Astronomy, Johns Hopkins University, Baltimore, MD 21218 E. B. Burgh arXiv:astro-ph/0409291v1 13 Sep 2004 Space Astronomy Laboratory, University of Wisconsin, Madison, WI 53706 and P. D. Feldman Department of Physics and Astronomy, Johns Hopkins University, Baltimore, MD 21218 Draft version February 2, 2008 ABSTRACT We present far-ultraviolet spectroscopy of the emission/reflection nebula IC 405 obtained by a rocket-borne long-slit spectrograph and the F ar U ltraviolet Spectroscopic Explorer. Both data sets show a rise in the ratio of the nebular surface brightness to stellar flux (S/F⋆ ) of approximately two orders of magnitude towards the blue end of the far-UV bandpass. Scattering models using simple dust geometries fail to reproduce the observed S/F⋆ for realistic grain properties. The high spectral resolution of the F U SE data reveals a rich fluorescent molecular hydrogen spectrum ≈ 1000′′ north of the star that is clearly distinguished from the steady blue continuum. The S/F⋆ remains roughly constant at all nebular pointings, showing that fluorescent molecular hydrogen is not the dominant cause for the blue rise. We discuss three possible mechanisms for the “Blue Dust”: differential extinction of the dominant star (HD 34078), unusual dust grain properties, and emission from nebular dust. We conclude that uncertainties in the nebular geometry and the degree of dust clumping are most likely responsible for the blue rise. As an interesting consequence of this result, we consider how IC 405 would appear in a spatially unresolved observation. If IC 405 was observed with a spatial resolution of less than 0.4 pc, for example, an observer would infer a far-UV flux that was 2.5 times the true value, giving the appearance of a stellar continuum that was less extinguished than radiation from the surrounding nebula, an effect that is reminiscent of the observed ultraviolet properties of starburst galaxies. Subject headings: dust, extinction—ISM:molecules—ISM:individual(IC 405)— reflection nebulae— ultraviolet: ISM 1. INTRODUCTION tion of these observations is complicated by geometric Observations aimed at determining the far-ultraviolet uncertainties in the nebular dust distribution, contam- properties of dust grains are challenging as they re- ination by emission from atomic and molecular species quire space-borne instrumentation designed specifically within the nebula, and uncertainties in the incident spec- for such studies. The lack of data has hampered testing tral energy distribution (Witt et al. 1993; Burgh et al. models of interstellar dust grains in the far-ultraviolet 2002; Hurwitz 1998). Burgh et al. (2002) have made (far-UV) spectral region below Lyman-α where dust the first measurement of the dust albedo (a) and phase most strongly attenuates the radiation field. Extinction function asymmetry parameter (g ≡ cos θ ) below Ly-α, by dust grains plays a key role in regulating the escape using long-slit spectroscopy to constrain both quantities. of radiation from a hot-star environment, thereby deter- However, Mathis et al. (2002) have argued that observa- mining the physical structure and chemical equilibrium tions of reflection nebulae are so confused by the clumpy of the local interstellar medium (ISM). Constraints can nature of the dust distributions that the derived grain be placed on the physical properties of dust grains by properties are highly unreliable. Further addressing this studying how they absorb and scatter far-UV light where problem, we present far-UV observations of IC 405. the two interact, either near a bright source of ultraviolet IC 405 (The Flaming Star Nebula) is an emis- photons or in the diffuse interstellar medium. Reflection sion/reflection (Herbig 1999) nebula in Auriga, illumi- nebulae offer an environment where a strong far-UV ra- nated by a dominant star, AE Aur (HD 34078). AE diation field is interacting with a dusty, gaseous environ- Aur is one of the stars thought to have been ejected ment. This class of objects has been used by a number of from the Orion region roughly 2.5 million years ago in observers in an attempt to derive the properties of grains a binary-binary interaction that led to the creation of (see Draine 2003a for a recent review). The interpreta- the well studied ι Ori binary system (Bagnuolo et al. 2001). Consequently, AE Aur is moving with a large
- 2. 2 France et al. The sounding rocket experiment consists of a tele- IC 405 scope and spectrograph designed for use in the far-UV. 1200 The telescope is an updated version of the Faint Ob- ject Telescope (FOT), a 40 cm diameter, f/15.7 Dall- 1000 Pos4 Kirkham (Hartig et al. 1980; McCandliss et al. 1994; Burgh et al. 2002). The optics are coated with a layer 800 of ion-beam sputtered SiC to enhance the reflectivity at far-UV wavelengths. The telescope is housed in an invar heat-shield with a co-axially mounted startracker which Arcseconds 600 provides error signals to the Attitude Control System (ACS). 400 Pos3 The FOT focuses the target at the entrance aperture of the instrument, an evacuated 400 mm diameter Rowland 200 Circle spectrograph using a holographically ruled, SiC coated, diffraction grating in the first order. The detector 0 is a microchannel plate stack with a KBr photocathode, Pos2 Pos1 read out by a double delay-line anode (Siegmund et al. −400 −200 0 200 400 1993). The spectrograph is kept at a vacuum of ≈ Arcseconds 10−8 Torr and isolated from the spectrograph section by a gate valve that opens under timer control in flight. The Fig. 1.— IC 405 with the relevant aperture overlays, HD 34078 is located at the origin. The long slits represent the aperture spectrograph and telescope sections share a common vac- of the rocket spectrograph, and the boxes represent the F U SE uum (< few × 10−5 Torr). A mirrored slitjaw, angled 22◦ LWRS aperture. Optical image from AP OD, T.A.Rector and from the optical axis, lies at the telescope focus. A long B.A.Wolpa/NOAO/AURA/NSF. slit (12′′ ×200′′ projected on the sky, 5.6 × 10⁻⁸ sr) is etched into the slitjaw, defining the entrance aperture to the spectrograph. The spectrograph achieves a pointing limited spectral resolution of ≈ 3 ˚. A proper motion through the nebula at ≈ 40 milliarcsec- This experiment was launched aboard a Black Brant onds yr−1 (Blaauw & Morgan 1954). Herbig (1999) used IX sounding rocket (NASA 36.198 UG) from White ◦ ◦ repeated observations of this high proper motion object Sands Missile Range, New Mexico (106. 3 West, 32. 4 to search for interstellar line variations, providing infor- North), on 09 February 2001 at 21:00 MST. The tar- mation about clump structure in the ISM . Presently, get was obtained by referencing the startracker to two AE Aur is thought to be cospatial with the nebula at a bright guide stars (Sirius and Capella), then reorienting distance of about 450 pc. It is bright in both the vis- to the target. The acquired field is within a few arcmin- ible (V = 6.0) and the ultraviolet (O9.5 Ve), although utes of the expected pointing. The field is relayed to it is rather extinguished (E(B − V ) = 0.53 and the ground in real-time through a Xybion TV camera RV = 3.42; Cardelli, Clayton, & Mathis 1989). In imaging the slitjaw (20′ field-of-view). Fine adjustments this paper, we present far-UV observations of IC 405 are performed in real-time via commands to the ACS. made with a rocket-borne long-slit spectrograph and the HD 34078 was placed in the spectrograph slit at T+150 F ar U ltraviolet Spectroscopic Explorer (F U SE). Fig- seconds and data was taken continuously until detector ure 1 shows the nebula with the various spectrograph high-voltage turn-off at T+490 seconds. The stellar spec- apertures overlaid. Section 2 includes a description of trum was recorded for 106.2 seconds of the flight (here- the rocket experiment, the observations, and the data after the “on-star” pointing). Two offset pointings within reduction. In § 3, we describe the F U SE observations the nebula were observed with only one having a count and reduction. Section 4 puts the IC 405 data in context rate higher than the background (observed for 68.7 sec- with previous studies of other reflection nebulae, includ- onds, hereafter the “off-star” pointing). Figure 2 shows ing discussion and interpretation of the results and their the pointing corrected long-slit spectrogram of the data possible consequences. Our observations of IC 405 are obtained from target acquisition to detector turn-off. summarized in § 5. 2.2. Analysis of the Rocket Observations 2. ROCKET OBSERVATIONS Flight data were analyzed using IDL code customized to read the data as supplied by the telemetry system. A Long-slit spectroscopy is a technique that lends itself to background subtraction can be made by measuring the the study of reflection nebulae where the exciting star(s) flux on the detector after instrument turn-on, but prior typically are embedded in or near the gas and dust with to target acquisition. The primary source of background which they are interacting. The extended aperture al- flux is geocoronal airglow from atomic hydrogen and oxy- lows nebular spectra to be measured continuously along gen. The data are then calibrated with measurements of the slit, and variations can be observed in both wave- the telescope mirror reflectivities and spectrograph quan- length and angle from the central object. This informa- tum efficiency, measured both before and after flight in tion can also be obtained through small apertures, but the calibration facilities located at The Johns Hopkins this requires multiple observations, which is costly in the University. far-UV bandpass where observing time is at a premium. The stellar spectrum is extracted following correc- 2.1. Instrument Description and Observations tions for pointing errors and detector drift. Figure 3 shows the spectrum of the HD 34078 obtained during
- 3. Far-Ultraviolet Observations of IC 405 3 50 0 Arcseconds −50 −100 900 1000 1100 1200 1300 1400 Wavelength (Å) Fig. 2.— The spectrogram of the rocket data, following time-tagged correction for pointing. HD 34078 is the horizontal strip, the nebular spectra are above and below the star, and the broad vertical feature is geocoronal Ly-α. the flight. The spectrum is of high quality (S/N ≈ 10- Additional nebular observations were made by F U SE 15 at R = 300), and is consistent with previous far-UV from 11 to 13 March 2003 on four positions within IC measurements (IU E; Penny et al. 1996 and F U SE; 405 (programs D12701, 02, 03, and 04). Spectra were Le Petite et al. 2001). In Figure 3, the measured obtained in the 905–1187 ˚ bandpass with the low- A spectrum has been shown overplotted with a synthetic resolution (LWRS) aperture (30′′ ×30′′ ) on F U SE (see stellar spectrum. The model has been extinguished us- Moos et al. 2000 for a satellite description and Sanhow ing the parametrization of Fitzpatrick & Massa (1990) et al. 2000 for on-orbit performance characteristics). As- and the H2 ools molecular hydrogen absorption tem- suming that the nebulosity fills the LWRS aperture, a plates (McCandliss 2003) for a b = 3, as determined spectral resolution of 0.33 ˚ is achieved at 1060 ˚. Po- A A by Le Petite et al. (2001), and a total column density sitions 01 (Pos1) and 02 (Pos2) were observed for 1850 N (H2 ) = 8.1 x 1020 cm−2 , that we determined from the and 1880 seconds, respectively, corresponding to the bot- F U SE spectrum of the star, described below. The stel- tom and top of the long-slit of the rocket spectrograph. lar spectrum shows interstellar absorption features of H I, Position 03 (Pos3) was observed for 12.6 ks, overlapping H2 , C II, and O I and photospheric C III absorption. Af- with the “off-star” rocket pointing and Position 4 (Pos4), ter the star is removed, the spectra from different regions a bright optical filament north of the star was observed within the nebula can be separated by “time-tagging” the for 12.4 ks. Using an approach similar to the unsharp data from a playback of the slitjaw camera that shows masking technique described by Witt & Malin (1989), we the flight time. Integrating the nebular spectra over the suspect Pos4 to exhibit Extended Red Emission (ERE). area of the slit allows one to measure the nebular sur- A list of the F U SE pointings is given in Table 1. face brightness. Using the vacuum collimator described Data for all four pointings were obtained in “time- by Burgh et al. (2001), we can determine the instrumen- tagged” (TTAG) mode and were initially processed us- tal line-spread-function, and we find that the in-flight stellar profile matches our post-flight calibrations. Fig- ure 4 shows the spatial profile of the nebular brightness (corrected for Ly-α airglow) that extends well beyond the intrinsic instrumental profile. Once the nebular sur- Flux ( x 10−11 ergs cm−2 s−1 Å−1) 8 AE Aur, O9.5V face brightness and stellar flux have been measured, their 6 ratio (S/F⋆ ) can be taken. This reveals the most sur- C III C II HI prising feature of our observations: the ratio of nebular 4 surface brightness to stellar flux rises roughly two or- 2 ders of magnitude to the blue from 1400 to 900 ˚, as H2 A shown in Figure 5. This sharp rise in S/F⋆ is in stark 0 900 1000 1100 1200 1300 1400 contrast with similar observations of the reflection neb- Wavelength (Å) ulae NGC 2023 and 7023 (Burgh et al. 2002; Witt et al. 1993; Murthy et al. 1993), where the S/F⋆ is found to be Fig. 3.— The spectrum of HD 34078, overplotted with a stel- constant with wavelength in the far-UV regime. lar model extinguished by the parametrization of Fitzpatrick and Massa and a model of H2 absorption. 3. F U SE OBSERVATIONS AND DATA REDUCTION
- 4. 4 France et al. TABLE 1 Summary of F U SE observations of IC 405. Position Program RA (2000) δ (2000) Integration Time ˚ Brightness at 1060 A ( h m s) (◦ ′ ′′ ) (seconds) (ergs cm−2 s−1 ˚−1 sr−1 ) A IC405-01 D12701 05 16 12.15 +34 18 49.3 1850 2.0 x 10⁻⁵ IC405-02 D12701 05 16 24.15 +34 18 49.3 1880 2.7 x 10⁻⁵ IC405-03 D12703 05 16 30.21 +34 24 56.4 12630 3.5 x 10⁻⁶ IC405-04 D12704 05 16 18.64 +34 32 25.2 12445 1.1 x 10⁻⁶ ing the CALFUSE pipeline, version 2.2.3. The calibrated averaged over all positions. For comparison, the rocket data files for each orbit were then combined using IDL derived S/F⋆ was fit using the same procedure and the software, and when possible, the individual channels were agreement is good, (8.7 ± 0.6) × 10−3 . combined using a cross-correlation algorithm. Due to the Figures 7 and 8 display the nebular spectra evolving diffuse nature of the targets, there were instances where from the influence of a strong radiation field very near this algorithm failed; in these cases, the channels were the star (Pos1, χ ∼ 105 , where χ is the average inter- analyzed independently. stellar radiation field; Draine (1978)) to the furthest off- The increased sensitivity and spectral resolution of set, approximately 1000′′ to the north (Pos4, χ ∼ 103 ). F U SE allowed us to confirm the blueness found in IC 405 Both spectra are overplotted with a synthetic H2 emis- and to determine the contribution of fluorescent H2 to the sion spectrum, created by a fluorescence code similar to nebular surface brightness. HD 34078 has been observed the one described in Wolven et al. (1997). Pos1 and Pos2 by F U SE under program A070 and stellar spectra were are dominated by a scattered stellar spectrum, with pro- obtained from the MultiMission Archive at the Space nounced H2 absorption troughs but only hints of H2 emis- Telescope Science Institute (MAST). With the spatial ˚ sion near 1100 and 1160 A. Pos3 shows the scattered stel- information obtained by multiple pointings in the case lar spectrum less strongly as the influence of HD 34078 of the F U SE data, we were able to confirm the rocket diminishes with distance, and the H2 emission becomes result independently. Figure 6 shows a similar blue S/F⋆ clear. The separation from the star is great enough at at all four pointings. The log10 (S/F⋆ ) was fit at wave- Pos4 (≈ 2 pc at the stellar distance of 450 pc) that the lengths unobstructed by terrestrial airglow lines or inter- numerous fluorescent emission lines appear strongly from stellar absorption from 912 – 1150 ˚ in the Pos1 spec- A 1050 ˚ to the end of the bandpass near 1187 ˚. The A A trum, where the scattered stellar continuum was bright observed nebular lines arise from electronic transitions (the long wavelength limit was chosen to avoid “The (B 1 Σ+ and C 1 Πu to X 1 Σ+ ) that decay from the ground u g Worm” present in the data). We find that the data is well and first excited vibrational state (ν = 0,1). matched by a linear fit with a slope of (8.4 ± 0.4) × 10−3 , 4. RESULTS AND DISCUSSION The strong blue rise in IC 405 is remark- able because both observational (Burgh et al. 2002; Witt et al. 1993; Murthy et al. 1993) and theoreti- 100 cal (Weingartner & Draine 2001) studies find a decreas- Spectral Flight Profile Postflight Measurement ing albedo across the far-UV bandpass. What mecha- 10−1 nism is responsible for not only overcoming the falling albedo but increasing the observed nebular brightness? Histogram over length of slit We consider: 10−2 • Peculiar dust grain properties (unusual values of a 10−3 9 IC 405, On Star log10 (S/F*) (sr−1) 10−4 8 7 10−5 6 −150 −100 −50 0 50 100 Slope =−0.0087 Arcseconds 5 900 1000 1100 1200 1300 1400 Wavelength (Å) Fig. 4.— Spatial profile of the flight data in black (excluding Ly-α airglow). Postflight determination of the instrument line- spread-function reproduces flight profile. The dashed lines repre- Fig. 5.— The ratio of nebular surface brightness to stellar flux sent the portion of the spectrograph slit unaffected by instrumen- measured by the sounding rocket experiment. Note the rise of ap- tal vignetting. One notices the extension of the nebula beyond the proximately two orders of magnitude to the blue across the band- stellar peak. pass.
- 5. Far-Ultraviolet Observations of IC 405 5 900 1000 1100 1200 and g) in IC 405, 8 Position 1 • Strong fluorescent H2 emission that falls below the 6 sensitivity and spectral resolution of the rocket ex- 4 Slope =−0.0068 periment, 8 Position 2 • Unusually small grain distribution leading to a 6 strong Rayleigh scattered component of the neb- log10 (S/F*) (sr−1) ular brightness, 4 Slope =−0.0071 8 • An unusual dust emission process, an extended Position 3 blue emission, and 6 • Differential extinction in IC 405 due to a compli- 4 Slope =−0.0082 cated local geometry or an intervening clump of gas 8 and dust along the line of sight to HD 34078 6 Position 4 4 Slope =−0.0113 4.1. Dust Modeling 900 1000 1100 1200 The dust scattering in IC 405 was modeled using a Wavelength (Å) modified version of the code described by Burgh et al. Fig. 6.— The ratio of nebular surface brightness to stellar flux at (2002), employing a Monte Carlo dust radiative transfer the four positions observed by F U SE confirm the blue rise discov- model (see also Gordon et al. 2001). The model follows ered by the rocket data. The slope was determined at wavelengths where there was no contamination from airglow features or inter- the path (direction and position) of each photon in the stellar absorption in the Pos1 S/F⋆ . nebula from its “creation” at the position of the star, until it leaves the nebula (i.e., its radial position is out- side the defined size of the nebula). The factors that determine the position and direction of the photons dur- ing their propagation through the nebula are the optical measured values in this wavelength regime (see Draine depth of the dust, the fraction of photons scattered by 2003a and references therein). Additionally, a 50% dif- the dust rather than absorbed (the albedo), the angu- ferential extinction was needed in the best-fit 950-1050 ˚ A lar distribution of the scattered photons (parameterized model; i.e. the stellar flux directly along the line of by g in the scattering distribution given by the Henyey- sight to the observer was reduced by a factor of two. Greenstein 1941 phase function), and the geometry of the As this model begins to reproduce the short wavelength dust distribution. Although Draine (2003b) has argued result, the longer wavelength data is in poor agreement. that the H-G function does not reproduce the scattering This exercise clearly shows that this reflection nebula is function calculated from the optical properties of dust not well described by a smooth and uniform dust distri- models in the far-UV bandpass, we use it here to allow bution. More sophisticated models, employing varying for a direct comparison with the result from Burgh et al. dust densities, complex geometries, and more appropri- (2002). A revision of our model replacing the H-G phase ate scattering phase functions than exist at present may function with a function that depends on the scatter- be able to reproduce our observations of IC 405. ing cross-sections for dust grains in the far-UV (as well as more sophisticated geometries) will be addressed in 4.2. Comparison with other Reflection Nebulae a future work. Given inputs for the number of photons Only one far-ultraviolet observation exists that in- followed, the optical depth, albedo, and g, the model out- cludes both spatial and spectral information, however puts an image of the nebular surface brightness that can there are a few previous data sets that put our S/F⋆ be compared to the distribution measured by the rocket result in context. Burgh et al. (2002) reported on obser- experiment. The rocket data are binned by wavelength vations of NGC 2023 made with the same rocket-borne region to improve S/N, and then plotted as a function of imaging spectrograph described above. This nearly iden- spatial position along the slit. tical observation, made in 2000 February, found that the This model, which works well to closely approximate ratio of nebular surface brightness to stellar flux was con- the observed surface brightness distribution in the bright stant with wavelength across the 900 to 1400 ˚ band- A reflection nebula NGC 2023, fails to reproduce the nebu- pass. They model the nebular scattering properties (as lar surface brightness of IC 405 by orders of magnitude. described above) and determine that a decreasing dust Models were run for a number of values for the opti- albedo is being offset by grains that are more strongly cal depth, a, g, and nebular geometry. Models explored forward scattering at shorter wavelengths (increasing g). spherical geometries with constant density and ρ ∝ r−α , Witt et al. (1993) and Murthy et al. (1993) used ob- as well as spherical shell and a constant density slab. servations made by the The results are best illustrated by considering two spe- Hopkins U ltraviolet T elescope (HU T ) to measure S/F⋆ cific cases, shown in Figure 9, the first using the a and in another bright reflection nebula, NGC 7023, without g from Weingartner and Draine (2001) for RV = 4.0. the benefit of a spatially resolved slit. Murthy et al. The model shows poor agreement across the bandpass, describes the HU T observations made during the Astro- particularly at the short wavelength end (a result of the 1 mission in 1990 December, obtaining a spectrum of nebular blueness). The second model finds the best fit the central star (HD 200775) and then offsetting to a to the short wavelength data, revealing a = 0.9, g = 0.1, pointing within the nebula. They obtained data with in strong disagreement with both theoretical and other an appreciable signal in the 1100 – 1860 ˚ region and A
- 6. 6 France et al. Surface Brightness (10−5 ergs cm−2 s−1 Å−1 sr−1) note that the large proper motion of HD 34078 brings it 4 into contact with grains that are unlikely to have under- Position 1 3 gone significant processing by UV photons. The exciting stars of NGC 2023 and 7023 are thought to be born in 2 the presence of the dust with which they are interact- 1 ing, clearly a different scenario than in IC 405. It is interesting to note that Vijh et al. (2004) have recently 0 found a continuous near-UV/optical emission in the Red −1 Rectangle nebula which they attribute to fluorescence by 950 1000 1050 1100 1150 small polycyclic aromatic hydrocarbon (PAH) molecules. Wavelength (Å) We are unaware of a molecular continuum process that operates at far-UV wavelengths, however we cannot con- Fig. 7.— The F U SE spectrum of Pos1. The spectrum is clusively rule out a contribution from PAH molecules. dominated by scattered stellar continuum. The data have been Further studies of the vacuum ultraviolet emission and smoothed with a 5-pixel boxcar average for display purposes. The brightest emission feature is geocoronal Ly-β. A synthetic spec- absorption properties of PAH molecules would be of in- trum of fluorescent H2 is overplotted as a red dashed line to guide terest. the eye. Mathis et al. (2002) have argued that clumpy dust dis- tributions make grain properties derived from observa- tions of reflection nebulae unreliable. They develop a model of hierarchical clumping that predicts widely vary- ing determinations of the albedo and the scattering pa- also found that the S/F⋆ ratio was constant with wave- rameter depending on the viewing angle, the degree of length. They use a Monte Carlo scattering model (de- clumping, if the central star happens to reside inside a scribed by Witt et al. 1982) and find a decreasing albedo dense clump, and the density of the interclump medium. for λ < 1400 ˚ (assuming g = 0.7). This result agrees A As dust scattering models and molecular hydrogen fluo- with that of Witt et al. (1993), who combined the HU T rescence have failed to reproduce our data, and other ex- stellar observation with data from the ultraviolet spec- planations seem speculative at this time, we adopt differ- trometer on V oyager 2 and found a drop in the albedo ential extinction due to a clumpy dust distribution as the of 25% between 1300 and 1000 ˚. The observed S/F⋆ is A most probable explanation for the blue S/F⋆ ratio in IC found to be flat across this wavelength region. An in- 405. A small interstellar clump/filamentary structure or crease in nebular surface brightness of 25% from an un- circumstellar feature directly along the sight line to HD resolved H2 emission component is assumed to counter- 34078, but not present in front of the rest of the nebula act the falling albedo (Witt et al. 1993; Sternberg 1989). would preferentially extinguish the shorter wavelength Ultraviolet studies of a similar nature have been carried stellar photons reaching us directly, thus making the de- out on the Scorpius OB association (Gordon et al. 1994), nominator in S/F⋆ small at short wavelengths. Our dust IC 435 (Calzetti et al. 1995), and the Pleiades reflection scattering models are unable to account for such com- nebula (Gibson & Nordsieck 2003), but these studies fo- plex geometries, but we can begin to study the degree of cused on longer wavelengths than considered here. clumpiness by examining the extinction in IC 405. 4.3. Mechanisms for Producing the Blue Rise 4.4. Differential Extinction Limits As our dust scattering models fail to reproduce the We can put limits on a differential extinction level short wavelength rise in S/F⋆ for realistic values of grain that can account for the blue rise by quantifying the parameters in IC 405, we consider other possibilities. Ul- extinction properties and physical size of an obscuring traviolet H2 emission is clearly present in IC 405, the clump. We begin by determining the level of variation double peaked emission feature near 1600 ˚ was first A in the extinction curve between HD 34078 and the re- seen by HU T (spectrum ic405 080) and our F U SE data gion surrounding it. Using the extinction curve to dered- resolve the individual rotational components of several vibrational bands between 1050 and 1185 ˚ (Figure 8). A Surface Brightness (10−6 ergs cm−2 s−1 Å−1 sr−1) Near HD 34078 however, we find little evidence for H2 emission as either the continuum overwhelms the fluo- 4 rescent signal or the χ/n environment is unfavorable for Position 4 3 the fluorescent process (Sternberg 1989). Regardless of the relative contribution of fluorescing H2 to the nebu- 2 lar spectrum, each of our pointings in IC 405 reveal a very similar, blue S/F⋆ ratio. The evolution of the flu- 1 orescence signature with distance from the exciting star 0 is interesting, but the constancy of the nebular bright- −1 ness to stellar flux rules out molecular hydrogen as the 1050 1100 1150 dominant cause of the blue rise in IC 405. Wavelength (Å) A small grain population has been suggested for NGC 7023 (Murthy et al. 1993; Witt et al. 1993), yet these Fig. 8.— F U SE spectrum of Pos4, 1000′′ north of the star. H2 grains are expected to be efficient absorbers of far-UV emission is now the most prominent spectral feature from 1050 to radiation. We have no reason to expect to find a unique 1180 ˚. A distribution of high albedo grains in IC 405, although we
- 7. Far-Ultraviolet Observations of IC 405 7 1010 1010 1010 in the column density of CH along the line of sight to 109 950 − 1050 Å 109 1120 − 1190 Å 109 1320 − 1360 Å HD 34078, suggesting structure on the scale of tens of AU (Rollinde et al. 2003). One possible explanation for 108 108 108 the N (CH) variation is the presence of a clump along S/F* (sr−1) S/F* (sr−1) S/F* (sr−1) 107 107 107 the HD 34078 line of sight, newly present due to the high proper motion of the star, although the the analysis 106 106 a=0.38 106 presented in Rollinde et al. (2003) finds this hypothesis g=0.72 105 105 105 to be unlikely. Independent of the location of the clump, −100 −50 Arcseconds 0 50 −100 −50 Arcseconds 0 50 −100 −50 Arcseconds 0 50 there is other evidence of multiple absorption compo- 1010 950 − 1050 Å 1010 1120 − 1190 Å 1010 1320 − 1360 Å nents along the line of sight. In addition to the scattered 109 109 109 stellar continuum seen at Pos1, F U SE spectra of HD 34078 revealed both cold (T = 80 K) and highly excited 108 108 108 H2 in absorption (Le Petite et al. 2001; Rollinde et al. S/F* (sr−1) S/F* (sr−1) S/F* (sr−1) 107 107 107 2003). The ambient interstellar radiation field is insuf- ficient to excite H2 to the observed levels (up to ν = 0, 106 106 106 a=0.90 g=0.10 j = 11), implying the relative proximity of HD 34078. 105 105 105 −100 −50 Arcseconds 0 50 −100 −50 Arcseconds 0 50 −100 −50 Arcseconds 0 50 4.5. Consequences for Unresolved Observations Fig. 9.— Spatial S/F⋆ measured with the rocket experiment We note that if IC 405 were observed in a spatially un- compared with models. The top panels are models using theoretical resolved manner or seen from a large distance, HD 34078 values of a and g at 1350 ˚, the bottom panels attempt to fit the A would appear to be less extinguished than in the present short wavelength S/F⋆ , using a differential extinction of 50% with case, where the star and nebula can be measured sepa- a=0.9 and g=0.1. The models differ from the one described in Burgh et al. by the use of a geometry that employs a larger inner rately. If observed at a large distance, the integrated blue cavity cleared out by the stellar wind and high proper motion and nebular continuum and the reddened star light would be includes the differential extinction correction. considered stellar in origin, artificially dereddening the intrinsic stellar continuum. As a rough determination of how such an observation may be biased, we assume a uniform surface brightness filling the rocket slit at the on-star pointing, and estimate the contribution of the den the HD 34078 line of sight will constrain the dif- nebular flux to the total observed spectrum in the un- ference in attenuation between the stellar and nebular resolved case. In the simple case of a constant surface lines of sight. We deredden the HD 34078 sight line brightness nebula the length of the rocket long-slit on by dividing the stellar spectrum by the observed ex- each side (200′′ ×200′′ , ≈ 0.4 pc×0.4 pc), we determine tinction curve. An extinction curve is created follow- a nebular filling factor correction of about 15. Multiply- ing the pair method, a correction for molecular hydro- ing the nebular flux measured during the on-star posi- gen absorption is applied, and then the resultant curve tion by the filling factor and adding that to the stellar is fit using the parameterization of Fitzpatrick & Massa flux, we determine how bright HD 34078 would appear (1990). HD 93521, (09V, E(B − V ) = 0.02; Buss in an unresolved observation. Taking a constant flux of et al. 1995) was used as the comparison star and the ˚ ≈ 1.0× 10⁻¹² ergs cm−2 s−1 A−1 at 1100 ˚ (from the A extinction curve was created between 900 and 3000 ˚ A nebular spectrum observed by the rocket, consistent with from a combination of the rocket data and archival the F U SE measurement), we find that the integrated IU E and HU T spectra. Molecular hydrogen absorption nebular flux would be ≈ 1.5× 10⁻¹¹ ergs cm−2 s−1 ˚−1 , A was corrected for using the H2 ools absorption templates 50% brighter than the star itself. A spatially unresolved for the parameters described in §2.2 (McCandliss 2003; far-UV observation of IC 405 would lead one to mea- Sasseen et al. 2002). We find the FM-fit parameters sure a stellar flux level 2.5 times (one magnitude) greater to be (x0 ,γ,c1 ,c2 ,c3 ,c4 ) = (4.59,0.94,0.17,0.37,6.25,1.05). than the true value. This effect is reminiscent of the ob- Repeating our S/F⋆ analysis using the dereddened star, served UV properties of local starburst galaxies described we find that the ratio is constant across the rocket band- by Calzetti (1997). Local starbursts show less extinction pass. Assuming that the extinction curve only applies to of the stellar continuum relative to the nebular emission the stellar sight line seems to account for the blue rise, lines, explained by a clumpy dust distribution that pref- but comes with the implication that the nebula has a erentially reddens nebular light due to the different filling foreground extinction of zero. If differential extinction is factors of the stars and gas. Calzetti (1997) finds that the sole mechanism at work in creating a blue S/F⋆ in stellar photons only encounter approximately 60% of the IC 405, then all of the observed reddening would appear dust seen by nebular photons. to originate in a small clump along a pencil-beam to HD 34078. 5. SUMMARY We determine the size of such a “small clump” by mea- The emission/reflection nebula IC 405 was observed by suring the nebular brightness profile along the rocket slit a rocket-borne, long-slit imaging spectrograph in the far- at the “on-star” pointing, and find the the clump size ultraviolet bandpass (900 – 1400 ˚). A high quality spec- A must be smaller than about 20′′ . It is unclear where the trum (S/N ≈ 10 – 15) was obtained of the central star, clump is located along the line of sight to HD 34078, HD 34078, as well as the spectra of the surrounding neb- but an upper limit on the physical size can be set by ula out to an offset approximately a parsec from the star. requiring it to be near the star, we find the upper limit We found that the ratio of nebular surface brightness to to be 0.04 pc. Variations have recently been detected stellar flux (S/F⋆ ) rose by two orders of magnitude to the
- 8. 8 France et al. blue across the bandpass of the instrument. This result is from observations of reflection nebulae. Differential ex- in conflict with analogous observations of reflection neb- tinction along the line of sight to IC 405, such as a knot ulae in this wavelength regime (NGC 2023 and 7023), or filament of gas and dust on the sight line to HD 34078 where flat S/F⋆ s were observed. This result held true but not crossing the path to the rest of the nebula can for both positions within the nebula. Additional obser- account for the blue rise if one assumes the obscuring vations were made with F U SE in an attempt to clarify material is very local to the HD 34078 line of sight. Our the process responsible for the blue rise. F U SE observed observations have placed an upper limit to the size of the four positions within IC 405, three coincident with the intervening clump of 0.04 pc. If clumpy dust is respon- rocket pointings, and one along another bright nebular sible for the blue rise that we have found, it seems that filament. These data revealed the nature of the nebu- IC 405 is the prototypical example for arguments against lar spectra: a progression from strong scattered stellar the use of reflection nebulae for reliable determination of continuum near the star to the appearance of fluorescent dust grain properties. IC 405 appears to be a local exam- emission from H2 farthest from the star. An analysis of ple of the differential extinction process that takes place S/F⋆ confirmed the blueness throughout IC 405, show- in starburst systems on a global scale. ing little correlation with the nebular spectral character- istics. Models of scattering in a uniform dust distribution, similar to those that accurately reproduce the observed We thank Russell Pelton of the JHU Sounding Rocket S/F⋆ in NGC 2023, were unable to fit IC 405 for realistic Group for his dedication to every phase of the 36.198 UG values of the albedo and the phase function asymmetry mission. We wish to acknowledge NASA’s Wallops Flight parameter for the geometries studied. The presence of Facility personnel, the support staff at White Sands Mis- fluorescent H2 creating excess emission to the blue while sile Range and the Physical Sciences Laboratory, oper- going undetected at the resolution of the rocket exper- ated by New Mexico State University, for their profes- iment has been ruled out by F U SE, as S/F⋆ remains sional support. We also wish to thank Brad Frey for constant regardless of the relative contribution of H2 to his assistance with calibration and field operations. The the spectrum. More exotic explanations, such as an ex- rocket data was supported by NASA grant NAG5-5122 tended blue emission from dust, are speculative. We fa- to the Johns Hopkins University and the F U SE data vor the hypothesis of differential extinction as caused by was obtained under the Guest Investigator Program by a clumpy dust distribution, which has been suggested by the NASA-CNES-CSA F U SE mission, operated by the Mathis et al. (2002) to complicate the conclusions drawn Johns Hopkins University. REFERENCES Bagnuolo, W. G., Riddle, R. L., Gies, D. R., & Barry, D. J. 2001, McCandliss, S. R. 2003, PASP, 115, 651 ApJ, 554, 362 McCandliss, S. R., Martinez, M. E., Feldman, P. D., Pelton, R., Blaauw, A. & Morgan, W. W. 1954, ApJ, 119, 625 Keski-Kuha, R. A., & Gum, J. S. 1994, in Proceedings of the Burgh, E. B., McCandliss, S. R., & Feldman, P. D. 2002, ApJ, 575, SPIE, Vol. 2011 240 Moos, H. W. et al. 2000, ApJ, 538, L1 Burgh, E. B., McCandliss, S. R., Pelton, R., France, K., & Feldman, Murthy, J., Dring, A., Henry, R. C., Kruk, J. W., Blair, W. P., P. D. 2001, in Proceedings of the SPIE, Vol. 4498 Kimble, R. A., & Durrance, S. T. 1993, ApJL, 408, L97 Buss, R. H., Kruk, J. W., & Ferguson, H. C. 1995, ApJ, 454, L55+ Penny, L. R. 1996, ApJ, 463, 737 Calzetti, D. 1997, AJ, 113, 162 Rollinde, E., Boiss´, P., Federman, S. R., & Pan, K. 2003, A&A, e Calzetti, D., Bohlin, R. C., Gordon, K. D., Witt, A. N., & Bianchi, 401, 215 L. 1995, ApJ, 446, L97+ Sahnow, D. J. et al. 2000, ApJ, 538, L7 Cardelli, J. A., Clayton, G. C., & Mathis, J. S. 1989, ApJ, 345, 245 Sasseen, T. P., Hurwitz, M., Dixon, W. V., & Airieau, S. 2002, Draine, B. T. 1978, ApJS, 36, 595 ApJ, 566, 267 —. 2003a, ARA&A, 41, 241 Siegmund, O. H., Gummin, M. A., Stock, J. M., Marsh, D. R., —. 2003b, ApJ, 598, 1017 Raffanti, R., & Hull, J. 1993, in Proc. SPIE Vol. 2006, p. 176-187, Fitzpatrick, E. L. & Massa, D. 1990, ApJS, 72, 163 EUV, X-Ray, and Gamma-Ray Instrumentation for Astronomy Gibson, S. J. & Nordsieck, K. H. 2003, ApJ, 589, 347 IV, Oswald H. Siegmund; Ed., 176–187 Gordon, K. D., Misselt, K. A., Witt, A. N., & Clayton, G. C. 2001, Sternberg, A. 1989, ApJ, 347, 863 ApJ, 551, 269 Vijh, U. P., Witt, A. N., & Gordon, K. D. 2004, ApJ, 606, L65 Gordon, K. D., Witt, A. N., Carruthers, G. R., Christensen, S. A., Weingartner, J. C. & Draine, B. T. 2001, ApJ, 548, 296 & Dohne, B. C. 1994, ApJ, 432, 641 Witt, A. N. & Malin, D. F. 1989, ApJ, 347, L25 Hartig, G. F., Fastie, W. G., & Davidsen, A. F. 1980, Appl. Opt., Witt, A. N., Petersohn, J. K., Holberg, J. B., Murthy, J., Dring, 19, 729 A., & Henry, R. C. 1993, ApJ, 410, 714 Henyey, L. C. & Greenstein, J. L. 1941, ApJ, 93, 70 Witt, A. N., Walker, G. A. H., Bohlin, R. C., & Stecher, T. P. 1982, Herbig, G. H. 1999, PASP, 111, 809 ApJ, 261, 492 Hurwitz, M. 1998, ApJ, 500, L67+ Wolven, B. C., Feldman, P. D., Strobel, D. F., & McGrath, M. A. Le Petite, F., Boisse, P., Pineau des Forets, G. a nd Roueff, E., Gry, 1997, ApJ, 475, 835 C., Andersson, B.-G., & Le Brun, V. 2001, astro-ph, 0110358, pre Mathis, J. S., Whitney, B. A., & Wood, K. 2002, ApJ, 574, 812