Alma observations of_feed_and_feedback_in_nearby_seyfert_galaxies
1. c ESO 2013
Astronomy & Astrophysics manuscript no. nugas1
September 17, 2013
ALMA observations of feeding and feedback in nearby Seyfert
galaxies: an AGN-driven outflow in NGC 1433 ⋆
F. Combes1 , S. Garc´a-Burillo2 , V. Casasola3 , L. Hunt4 , M. Krips5 , A. J. Baker6 , F. Boone7 , A. Eckart8 , I. Marquez9 , R.
ı
Neri5 , E. Schinnerer10 , and L. J. Tacconi11
1
2
3
4
5
6
7
8
9
10
11
Observatoire de Paris, LERMA (CNRS:UMR8112), 61 Av. de l’Observatoire, F-75014, Paris, France e-mail:
francoise.combes@obspm.fr
´
Observatorio Astron omico Nacional (OAN)-Observatorio de Madrid, Alfonso XII, 3, 28014-Madrid, Spain
INAF – Istituto di Radioastronomia & Italian ALMA Regional Centre, via Gobetti 101, 40129, Bologna, Italy
INAF - Osservatorio Astrofisico di Arcetri, Largo E. Fermi, 5, 50125, Firenze, Italy
IRAM, 300 rue de la Piscine, Domaine Universitaire, F-38406 Saint Martin d’H` res, France
e
Dep. of Physics & Astronomy, Rutgers, the State University of New Jersey, 136 Frelinghuysen road, Piscataway, NJ 08854, USA
CNRS, IRAP, 9 Av. colonel Roche, BP 44346, 31028, Toulouse Cedex 4, France
¨
I. Physikalisches Institut, Universit¨ t zu K¨ ln, Z¨ lpicher Str. 77, 50937, Koln, Germany
a
o
u
Instituto de Astrofsica de Andaluc´a (CSIC), Apdo 3004, 18080 Granada, Spain
ı
Max-Planck-Institut f¨ r Astronomie (MPIA), K¨ nigstuhl 17, 69117 Heidelberg, Germany
u
o
¨
Max-Planck-Institut f¨ r extraterrestrische Physik, Giessenbachstr. 1, Garching bei M unchen, Germany
u
Received 2013/ Accepted 2013
ABSTRACT
We report ALMA observations of CO(3-2) emission in the Seyfert 2 galaxy NGC 1433 at the unprecedented spatial resolution of
′′
0. 5 = 24 pc. Our aim is to probe AGN (active galactic nucleus) feeding and feedback phenomena through the morphology and
dynamics of the gas inside the central kpc. NGC 1433 is a strongly barred spiral with 3 resonant rings: one at the ultra-harmonic
resonance near corotation, and the others at outer and inner Lindblad resonances (OLR and ILR). A nuclear bar of 400 pc radius
is embedded in the large-scale primary bar. The CO map, which covers the whole nuclear region (nuclear bar and ring), reveals a
nuclear gaseous spiral structure, inside the nuclear ring encircling the nuclear stellar bar. This gaseous spiral is well correlated with
the dusty spiral seen in HST images. The nuclear spiral winds up in a pseudo-ring at ∼200 pc radius, which might correspond to the
inner ILR. Continuum emission is detected at 0.87 mm only at the very center, and its origin is more likely thermal dust emission
than non-thermal emission from the AGN. It might correspond to the molecular torus expected to exist in this Seyfert 2 galaxy. The
HCN(4-3) and HCO+ (4-3) lines were observed simultaneously, but only upper limits are derived, with a ratio to the CO(3-2) line
lower than 1/60 at 3σ, indicating a relatively low abundance of very dense gas. The kinematics of the gas over the nuclear disk reveal
rather regular rotation only slightly perturbed by streaming motions due to the spiral; the primary and secondary bars are too closely
aligned with the galaxy major or minor axes to leave a signature in the projected velocities. Near the nucleus, there is an intense
high-velocity CO emission feature redshifted to 200 km/s (if located in the plane), with a blue-shifted counterpart, at 2′′ (100 pc)
from the center. While the CO spectra are quite narrow in the center, this wide component is interpreted as an outflow, involving a
molecular mass of 3.6 106 M⊙ , and a flow rate ∼ 7 M⊙ /yr. The flow could be in part driven by the central star formation, but mainly
boosted by the AGN through its radio jets.
Key words. Galaxies: active — Galaxies: Individual: NGC 1433 — Galaxies: ISM — Galaxies: kinematics and dynamics —
Galaxies: nuclei — Galaxies: spiral
1. Introduction
It is now observationally well established that supermassive
black holes (SMBHs) reside in the nuclei of all galaxies with
massive spheroids in the Local Universe and at higher redshifts
as well (e.g. Kormendy & Ho 2013). Quasars at high redshift and
Seyfert nuclei locally are fueled by accretion of material onto the
SMBH. Although much progress has been made on both theoretical and observational fronts in the last decade, the relationship
of black hole growth with galaxy formation and evolution is still
far from being completely understood.
One of the outstanding problems is to identify the mechanism that drives gas from the disk towards the nucleus, removSend offprint requests to: F. Combes
⋆
Based on observations carried out with ALMA in Cycle 0.
ing its large angular momentum, to feed the central black hole
and trigger the nuclear activity. Theoretically, broad-brush solutions have been found; cosmological simulations rely on mergerdriven gas inflow via bar instabilities to feed a central starburst and fuel the SMBH (e.g., Hopkins et al. 2006; di Matteo
et al. 2008). Nevertheless, in the Local Universe, no clear correlation has been found between the presence of an active galactic
nucleus (AGN) and either companions or the presence of bars
(see e.g. Combes 2003, 2006, Jogee 2006 for reviews). It is possible that locally the relation between these large-scale phenomena and the duty cycle of nuclear fueling is masked by different
timescales. Indeed, the presence of resonant rings, vestiges of a
previous bar, appears to be correlated with Seyfert activity (Hunt
& Malkan 1999). Also it could be that gas inflow is not always
possible because of dynamical barriers (e.g., nuclear rings, see
Piner et al. 1995; Regan & Teuben 2004).
1
2. F. Combes et al.: CO in NGC 1433
To assess potential inhibitors of the ubiquitous gas inflow assumed in simulations, we must examine the nuclear kinematics
around local AGN. This can be best done with molecular tracers, since in galaxy centers, HI is typically converted to molecular gas. CO line emission is therefore our best probe, and in
particular CO(3-2), which traces the high density gas (10 4 -105
cm−3 ) in the dense AGN circumnuclear regions (as we have
shown in Boone et al. 2011). HCN and HCO+ line emission
should trace the densest material (at least 107 cm−3 ), and diagnose its excitation and chemistry. We have undertaken during the last decade the NUGA (NUclei of GAlaxies) program
to study the gas distributions in nearby AGN, and find clues to
their fueling. In the dozen nearby Seyfert or LINER galaxies observed with the IRAM Plateau de Bure interferometer (PdBI)
in CO(2-1), we achieved a spatial resolution of 50-100 pc, and
frequently worse for the most distant galaxies. In these galaxies, a large variety of gas distributions have been found; however we detected on-going AGN feeding at 0.1-1 kpc scales
for only 5/12 cases: NGC 2782 (Hunt et al. 2008, bar triggered
by an interaction), NGC 3147 (Casasola et al. 2008), NGC 3627
(Casasola et al. 2011), NGC 4579 (Garc`a-Burillo et al. 2009),
ı
and NGC 6574 (Lindt-Krieg et al. 2008). The most common
feeding mechanism in these galaxies appears to be kinematically
decoupled embedded bars, i.e. the combination of a slowly rotating kpc-scale stellar bar (or oval) and a kinematically decoupled
nuclear bar, with overlapping dynamical resonances. Such resonances and kinematic decoupling are fostered by a large central
mass concentration and high gas fraction. The gas is first stalled
in a nuclear ring (a few 100 pc scale), and then driven inward
under the influence of the decoupled nuclear bar. However, because of insufficient resolution, our previous observations were
most of the time unable to probe the gas within 100 pc of the
AGN.
In this paper, we present ALMA Cycle 0 observations in the
CO(3-2) line of the Seyfert 2 NGC 1433, where the beam is 24 pc
in size. The nearby distance (9.9 Mpc) and low inclination of 33◦
make NGC 1433 an ideal target to test and refine the scenario of
AGN feeding and feedback, and constrain BH models which are
only now beginning to examine in detail gas structures within
100 pc (Hopkins & Quataert 2010; Perez-Beaupuits et al. 2011).
Up to now, resolution of tens of pc scales has been obtained only in a few Seyfert galaxies, and only in hot or warm
gas tracers. The best example is NGC 1068, the most nearby
Seyfert 2 prototype, where near-IR H 2 lines have been mapped
′′
with SINFONI at 0. 075 resolution (5.2pc) by M¨ ller-Sanchez
u
et al. (2009). The behavior of this hot (1000-2000K) gas is
not yet settled however; while an outflow model is proposed
by Galliano & Alloin (2002), and a warped disk model by
¨
Schinnerer et al. (2000), Muller-Sanchez et al. (2009) propose
a strong inflow model. Krips et al. (2011) explain their SMA
′′
CO(3-2) map at 0. 6 = 40 pc resolution by a rotating disk plus
an outflow of the disk gas due to shocks and/or a circumnuclear
disk-jet interaction. Thus, gas inflow could fuel the AGN at a 10pc scale, and the jet-gas interaction could simultaneously drag
gas outwards on scales of hundreds of pc. The presence of an
outflow in the circumnuclear disk of NGC 1068 has also been
suggested to be responsible of the large-scale molecular shocks
revealed by strong SiO emission in this galaxy (Garc`a- Burillo
ı
et al 2010). The outflow is clearly seen in ALMA data (Garc`aı
Burillo et al. 2013, in prep.). Typical outflow velocities are found
of the order of 200 km/s in NGC 1068.
An important ingredient in cosmological simulations is feedback, which can regulate SMBH growth and suppress star formation (e.g., Croton et al. 2006, di Matteo et al. 2008, and
2
Table 1. Basic data for the NGC 1433 galaxy
Parameter
Valueb
Referencec
a
h
m
s
αJ2000
03 42 01.55
(1)
δJ2000 a
-47◦ 13′ 19.5′′
(1)
Vhel
1075 km s−1
(1)
RC3 Type
(R’)SB(r)ab
(1)
Nuclear Activity
Seyfert 2
(2)
◦
Inclination
33. 0
(3)
Position Angle
199◦ ± 1◦
(3)
Distance
9.9 Mpc (1′′ = 48 pc) (4)
LB
1.0 × 10¹⁰ L⊙
(4)
MH I
5.5 × 10⁸ M⊙
(5)
MH 2
2.3 × 10⁸ M⊙
(6)
Mdust (60 and 100 µm) 2.5 × 10⁶ M⊙
(7)
LFIR
1.3 × 10⁹ L⊙
(7)
αJ2000 d
03h 42m 01.49 s
New center
δJ2000 d
-47◦ 13′ 20.2′′
New center
a
(αJ2000 , δJ2000 ) is the phase tracking center of our 12 CO interferometric observations
b
Luminosity and mass values extracted from the literature have
been scaled to the distance of D = 9.9 Mpc.
c
(1)
NASA/IPAC
Extragalactic
Database
(NED,
http://nedwww.ipac.caltech.edu/); (2) Veron-Cetty & Veron (1986);
(3) Buta et al. (2001); (4) HyperLeda; (5) Ryder et al. (1996);
(6) Bajaja et al. (1995), reduced to the conversion factor 2.3
1020 cm−2 /(Kkm/s); (7) IRAS Catalog.
d
New adopted center, coinciding with the continuum peak.
references therein). Molecular observations can constrain specific feedback mechanisms, by discovering molecular outflows
through their high velocity wings, and determine their origin (star formation or AGN), through high resolution observations. Chung et al. (2011) showed the ubiquitous presence of
1000 km/s molecular outflows in starbursts with SFRs larger
than 100 M⊙ /yr (see also Feruglio et al. 2010, Fischer et al. 2010,
Sturm et al. 2011). The CO emission in the high velocity wings
may generally represent 25% of the total observed emission.
In NGC 1068 the outflow, if present, is only of the order of
200 km/s and entrained by the radio jet. Coil et al. (2011) also
find that galactic winds are frequent in ionized gas lines, in
post-starburst and AGN host galaxies at 0.2<z<0.8, but they
are low velocity winds, likely due to supernovae. High velocity winds, driven by an AGN, might be frequent in molecular gas (Leon et al. 2007, Feruglio et al. 2010, 2013, Alatalo
et al. 2011, Nesvadba et al. 2011, Dasyra & Combes 2012, Aalto
et al. 2012, Spoon et al. 2013, Veilleux et al. 2013), as well as in
the ionized or atomic gas component (Rupke et al. 2005; Riffel
& Storchi-Bergmann 2011). In Arp 220, Sakamoto et al. (2009)
have discovered 100-200 km/s outflows, through P-Cygni profiles in HCO+ (3-2), HCO+ (4-3) and CO(3-2) along the line of
sight to the nucleus. They interpret this gas as driven outwards by
the nuclear starburst. Because NGC 1433 is not an IR-luminous
starburst, it is unlikely that an AGN wind close to the nucleus
would be swamped by a starburst wind, thus facilitating its identification with ALMA’s high resolution.
1.1. NGC 1433
NGC 1433 is a nearby active barred galaxy, member of the
Dorado group which includes 26 galaxies (Kilborn et al. 2005).
We selected it from a sample of low-luminosity AGN spirals already detected in CO emission, for its proximity, and moderate
3. F. Combes et al.: CO in NGC 1433
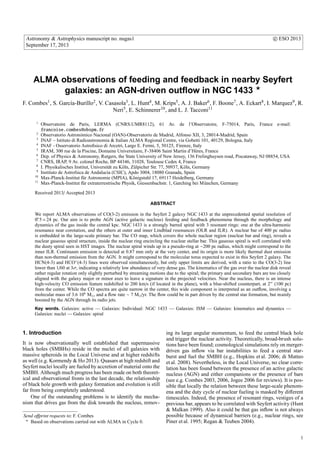
Fig. 1. Channel maps of CO(3-2) emission in the center of NGC 1433. Each of the 42 square boxes is 20′′ in size, while the primary beam is
18′′ in diameter . Channels are separated by 4.24 km/s. They are plotted from 978 (top left) to 1152 km/s (bottom right, the panels are labelled in
′′
′′
frequency). The synthesized beam is 0. 56×0. 42 (PA=85◦ ). The center of the maps is the phase center of the interferometric observations given in
Table 1. The color scale is linear, between 1 and 30 mJy/beam.
Table 2. Main dynamical features in NGC 1433
Feature
Nuclear bar
Nuclear ring
Primary bar
Inner ring
Outer ring
Radius
9′′ (430 pc)
9.5′′ (460 pc)
83′′ (4 kpc)
108′′ (5.2 kpc)
190′′ (9.1 kpc)
PA(◦ )
31
31
94
95
15
inclination. It has been classified as Seyfert 2 by Veron-Cetty &
Veron (1986), for its strong nuclear emission lines and its high
[NII]/Hα ratio. However, Sosa-Brito et al. (2001) prefer to classify it as LINER, because of its [OIII]/Hβ ratio, which is just at
the limit between Seyfert and LINERs. Liu & Bregman (2005)
detect the nuclear point source in X-rays with ROSAT.
The galaxy has a rich network of dusty filaments around the
nucleus. Its morphology reveals conspicuous rings (Buta 1986,
Buta et al. 2001); the presence of nuclear, inner and outer rings
has motivated its nickname of the “Lord of Rings” (Buta &
Combes 1996). Table 2 presents the sizes and orientation of
the main dynamical features. NIR images have revealed a nuclear bar inside the nuclear ring, of radius ∼400 pc (Jungwiert
et al. 1997). The ring is the site of a starburst and is patchy in
UV (continuum HST image from Maoz et al. 1996). 31 compact
sources contribute 12% of the UV light. Inside the ring the dust
traces a flocculent or multiple-arm nuclear spiral structure (HST
image from Peeples & Martini 2006). There is a peak of 6 mJy
in radio continuum emission at 843 MHz in the center (Harnett
1987), with a weak extension along the bar. The HI 21cm emission map (Ryder et al. 1996) reveals that the atomic gas is concentrated in the inner and outer rings, with some depletion in
the nuclear ring and bar region. In contrast, the central region
is filled with molecular hydrogen (Bajaja et al. 1995, CO SEST
map). Our ALMA single pointing includes in its field-of-view
(FOV) all the nuclear bar and nuclear spiral gas.
2. Observations
The observations were carried out with the Atacama Large
Millimeter/submillimeter Array (ALMA) telescope in Cycle 0,
with 19 antennae, during june and july 2012. NGC 1433 was observed simultaneously in CO(3-2), HCO+ (4-3), HCN(4-3), and
continuum, with Band 7. The sky frequencies were 344.56 GHz,
355.46 GHz, 353.24 GHz and 343.27 GHz respectively. The observations were done in 3 blocks, with a total duration of 2 hours.
For each period, NGC 1433 was observed for 27 minutes; the
median system temperatures were T sys = 140, 230 and 160 K.
The observations were centered on the nucleus, with a single
pointing covering a FOV of 18′′ . The Cycle 0 extended config′′
′′
uration provides in Band 7 a beam of 0. 56×0. 42, with a PA of
85◦ . The galaxy was observed in dual polarization mode with
1.875 GHz total bandwidth per baseband, and a velocity resolu3
4. F. Combes et al.: CO in NGC 1433
Table 3. CO(3-2) line fluxes, after primary beam correction
Line
Total
C1
C2
C3
Blue(2)
Red(2)
SCO
Jy km/s
234± 1
103± 2
105± 4
26± 3
6.0± 0.1
10.1± 0.1
Vhel
km/s
1073.1±0.3
1040.0±0.4
1089.1±0.2
1123.0±4.0
1018.7±0.6
1138.2±0.3
∆V(1)
km/s
85.3± 0.7
46.± 1
30.± 1
59.± 5
61.± 1
56.± 0.7
Peak flux
Jy
2.58
2.1
3.3
0.4
0.09
0.17
Total = Gaussian fit, assuming only one component, C1/C1/C3 represent 3 velocity-component decomposition
(1)
Full Width at Half Maximum FWHM
(2)
Fits for the blue and red components of the outflow, summed
′′
′′
over a region 0. 7×1. 2 each (cf Fig 9).
Almost no CO(3-2) emission was detected outside the FullWidth Half-Power (FWHP) primary beam. Due to missing short
spacings, extended emission was filtered out at scales larger than
∼3′′ in each channel map. The elongated features detected, corresponding to the dust lanes, along arms and rings are, however,
quite narrow (thinner than 2 ′′ as in HST images), so the missingflux problem might not be severe in individual velocity slices.
Low level negative sidelobes adjacent to bright emission were
however observed.
3. Results
Fig. 2. Velocity field (top) and integrated intensity (bottom) of the
CO(3-2) emission in the center of NGC 1433. Coordinates are RADec in arcsec relative to the phase center (see Table 1). The color scale
ranges are in km/s relative to 1075 km/s (top) and in Jy/beam.MHz (or
′′
′′
0.87 Jy/beam.km/s) at the bottom. The beam size of 0. 56×0. 42 is indicated at the bottom left. The phase center is a pink cross, and the new
adopted center is the red cross, in the bottom panel.
tion of 0.488 MHz ∼0.42 km/s. The spectra were then smoothed
to 4.88 MHz (4.24 km/s) to build channel maps.
This choice of correlator configuration, selected to observe simultaneously three lines, provided a velocity range of
1600 km/s for each line, but not centered (200km/s on one side
and 1400 km/s on the other) which is adequate for a nearly faceon galaxy, and 1800 MHz bandwidth in the continuum. The total
integration time provided an rms of 0.09 mJy/beam in the continuum, and ∼3 mJy/beam in the line channel maps (corresponding
to ∼170 mK, at the obtained spatial resolution). The flux calibration was done with the nearby quasar J0334-401, which is
regularly monitored at ALMA, and resulted in 10% accuracy.
The data were calibrated, and cleaned using first a mask at
the 50 mJy emission level, and then the 30 mJy level. The fi′′
nal cube has 360x360 pixels with 0. 1 per pixel in the plane
of the sky, and 60 channels of 4.24 km/s width. The data were
calibrated, imaged and cleaned with the CASA software (v3.3;
McMullin et al. 2007), and the analysis was then finalized with
the GILDAS software (Guilloteau & Lucas 2000).
The final maps were corrected for primary beam attenuation to compute fluxes, but were kept uncorrected for the plots.
4
Figure 1 displays 42 of the CO(3-2) channel maps, with a velocity range of 175 km/s and a velocity resolution of 4.24 km/s.
The velocity field is rather regular, although perturbed by the
tightly-wound spiral structure (see also Fig. 2). At the outermost
channels, the emission at the highest velocities does not occur
primarily at large radii, but mainly towards the center.
3.1. Molecular gas distribution and morphology
To measure fluxes we used a clipped cube where all pixel values <2σ (6 mJy/beam) were set to zero. The mean intensity is
plotted in Fig. 2 (bottom). Since the galaxy is more extended
than the primary beam, it is difficult to quantify the missing
flux. We compare to the central spectrum obtained with a single dish in Sect. 3.4. However, these observations were obtained
with the SEST in CO(1-0) with a 43′′ beam. Nevertheless, our
FOV encompasses the entire nuclear ring, and the emission in
this nuclear region has by far the strongest surface density at
many wavelengths (Buta et al. 2001, Comeron et al. 2010; Ho
et al. 2011).
We superposed the CO map onto the HST maps in the B,
V and I filters. All show a remarkable similarity in morphology, as displayed in Figure 3. The features are so distinct that
they were used to align the HST images, which suffered from
an inexact astrometry. The CO emission nicely corresponds to
the dust lanes, interleaved with the bright regions. The gas and
the dust are intimately mixed, and reveal a multi-arm structure
with a low pitch angle. There is not a well-defined density-wave
here, but rather a more flocculent spiral structure with multiple
branches. The structure is easily appreciated, thanks to the low
inclination of the galaxy (33◦ , Table 1). This spiral structure is
entirely included inside the nuclear ring, of ∼ 10′′ =0.5 kpc in
radius (Buta et al. 2001, see Table 2).
5. F. Combes et al.: CO in NGC 1433
Fig. 5. Overlay of CO(3-2) contours on the 0.87mm continuum image.
The FOV is 6′′ in diameter. The yellow star shows the phase center of
Table 1, while the peak of the continuum is our new adopted center. The
colour palette unit is mJy.
Fig. 3. Top: Overlay of CO(3-2) contours on the unsharp-masked blue
(F450W) HST image. The HST image has been aligned to correspond to
the ALMA astrometry. Bottom: Unsharp masking of the HST I-image
of NGC 1433, covering the nuclear ring and the dust lanes along the
primary bar. The FWHP of the primary beam is indicated in yellow
(18′′ in diameter), and the FOV of the CO map in Fig. 2 and in the above
′′
image is indicated in blue (square of 24. 8 on a side). The characteristic
dust lanes on the leading edge of the main bar are outlined in orange.
What is remarkable is the large difference between the
gas complex morphology in this nuclear region, revealed by
ALMA and the already known smoother stellar morphology
(Buta et al. 2001). The lower panel of Fig. 3 shows an unsharpmasked red image of the nuclear region, embedded in the primary bar whose leading dust lanes are marked. As is frequently
found in strong primary bars of early-type spirals, the dust lanes
wind up onto the nuclear ring, which corresponds to the inner
Lindblad resonance, and a secondary nuclear bar has decoupled
inside (e.g. Buta & Combes 1996). However, the gas does not
follow the stellar nuclear ring, but instead is flowing through a
flocculent spiral onto an even smaller nuclear ring, of ∼200pc radius, and from there reaches the very center, at least at the 20pc
scale, our resolution.
The molecular gas morphology reveals notable asymmetries:
for instance the peak of CO emission is not in the center but in
a NE cloud complex, at about 4′′ from the center (200 pc), with
no SW counterpart. In the very center, the emission extends 2 ′′
to the SW, but with a corresponding hole in the NE. This might
indicate an m = 1 Fourier component, in addition to the m = 2
and m = 3 arm features. To determine whether one particular m
component dominates, we have computed the Fourier decomposition of the 2D gas density, once the galaxy disk has been deprojected to the sky plane 1 . Fig. 4 displays the face-on molecular
gas distribution. The pseudo-ring at radius ∼4′′ corresponding
to 200 pc is clearly visible and nearly round. We have computed
the radial distribution of the various Fourier components, normalized to the axi-symmetric power. The surface density of the
gas has been decomposed as:
am (r)cos(mφ − φm (r))
Σ(r, φ) = Σ0 (r) +
m
Fig. 4. Deprojection of the CO emission towards a face-on disk, centered on the new adopted center of Table 1. The pseudo-ring of 4 ′′ radius, here underlined with a black circle, is standing out, nearly round.
and the amplitude of the various Fourier components m are normalized as Am (r) = am (r)/Σ0 (r). As a result, all Am (r) coefficients show noisy behaviours, at a maxium amplitude of 0.5, but
there is no particular dominance of any m feature.
1
The decomposition is performed using the new center defined in
Sect. 3.2.
5
6. F. Combes et al.: CO in NGC 1433
3.2. Continuum emission
Besides the CO(3-2) line, continuum emission was detected at
0.87mm. For that, the fourth band of width 468.8 MHz was used,
with a rms noise level of 0.15 mJy. Fig. 5 displays the CO(3-2)
contours superposed onto the continuum map. The peak emission is just detected at 3σ, about 0.5 mJy. The emission is ex′′
tended in the East-West direction, its size is 1′′ x 0. 5.
3.2.1. Recentring
To establish the origin of the continuum emission, one issue is
to determine the exact position of the AGN. We observed with
a phase center corresponding to the peak of the near-infrared
emission of the stellar component, which is known only within
′′
0. 7 uncertainty (e.g. 2MASS catalog, 2003). The HST maps, in
B, V and I would be precise enough, but they are all affected by
dust obscuration. In particular there is a conspicuous dust-lane
extending nearly horizontally in the SW. The continuum emis′′
′′
sion peaks at a position (-0. 6, -0. 7) with respect to our phase
center, so perfectly compatible within the uncertainty. This position is however better centered with respect to the CO emission.
We therefore choose to adopt the peak of the continuum emission as the new center. The latter is also perfectly compatible
with the position of the X-ray nuclear point source seen by Liu
& Bregman (2005). Although the AGN might not correspond exactly to the peak of the stellar component, it is possible that our
new center is also the correct position of the AGN and the supermassive black hole. But it is unclear whether or not the 0.87 mm
AGN synchrotron emission is detected.
3.2.2. Slope of radio-continuum emission
Radio continuum emission has been detected at 35 cm by
Harnett (1987) with a resolution of 43′′ ×58′′ ; the emission is
extended, and shows 6 mJy in the central beam. NGC 1433 has
also been observed at 21 cm with ATCA by Ryder et al. (1996),
with a spatial resolution of 30′′ . The central emission is 3.4 mJy,
quite similar to what is obtained at the ends of the bar from the
HII regions. Since the whole nuclear region is included in their
central beam, it is possible that all the radio emission comes from
star formation in the ring or nuclear region (both synchrotron
from supernovae, and free-free emission). The continuum becomes 2 mJy at 4.8 GHz, with no polarisation (Stil et al. 2009).
Comparing the central fluxes at 21cm and 0.87mm, the slope
of the radio spectrum would be -0.35, which could be a mixture of synchrotron with a steeper spectrum (−0.7), and freefree emission with slope −0.1. Both steep radio spectra (Sadler
et al. 1995), and flat ones (Ulvestad & Ho 2001) have been found
in Seyfert spiral galaxies, so it is not possible to conclude on the
AGN contribution in the center. From the Hα flux it would be
possible in principle to estimate the fraction of free-free emission expected in the center, but the spatial resolution (2′′ ) is not
enough to disentangle what is coming actually from the very
center. Also the extinction might be a problem.
3.2.3. Dust continuum emission
Another possibility is that the continuum is coming from thermal dust emission. At millimeter wavelengths, we are nearly in
the Rayleigh-Jeans domain, and the dust emission is only proportional to the dust temperature. Continuum dust emission is
then expected to be quite similar in morphology to the CO(3-2)
emission (e.g. Dumke et al. 1997). Why is this not the case? The
6
difference might be due to the lack of short spacing data, and the
filtering out of the diffuse extended continuum emission. Indeed,
the continuum is much more sensitive to this problem than the
line emission. From the IRAS fluxes, the average temperature
of the dust in NGC 1433 can be estimated as 24 K, assuming
that the dust opacity has a dependence in frequency of νβ , with
β = 2. This is similar to central dust temperatures observed in
∼40′′ beams with Herschel in star-forming barred galaxies such
as NGC 3627 (Hunt et al. 2013, in prep.). From a flux of 0.5
mJy/beam, and assuming the same Draine & Lee (1984) dust
absorption cross section as described in Dumke et al. (1997) for
a solar metallicity, we find a molecular gas column density of
N(H2 ) = 4.5 1022 cm−2 , over a beam of 24 pc in size. This is
what is expected from a typical Giant Molecular Cloud. In comparison, in the same position, the CO(3-2) emission is about 4
Jy km/s, for a CO integrated intensity in one beam of 262 K km/s,
corresponding to N(H2 ) = 6 1022 cm−2 , with a standard conversion factor of 2.3 1020 cm−2 /(K km/s) (e.g. Solomon & Vanden
Bout 2005). Considering all the uncertainties, the continuum
emission is at the level expected from dust alone. Given that dust
emission is only detected at the very center, it might be possible
that this dust is associated with the molecular torus expected to
hide the AGN in this Seyfert 2 galaxy. The derived mass of the
torus would be 9 105 M⊙ . Since the dust in the torus is certainly
warmer than in the disk, this might also explain why the continuum emission is not more extended, like the CO, in addition
to the interferometer’s filtering argument explained above. Midinfrared maps with ISO at 7 and 15µm show also a high central
concentration, but with low resolution (Roussel et al. 2001).
Only high-resolution observations with ALMA at several
different frequencies would be able to settle the origin of the continuum emission, and determine whether the AGN is detected
directly.
3.3. CO kinematics: a molecular outflow?
In a previous paper (Buta et al. 2001), a detailed mass model
of NGC 1433 has been performed, from NIR photometry and
Hα spectroscopy. Rotational and epicyclic frequencies (Ω and
κ) were then derived, and together with the numerical simulations from Buta & Combes (2000), the predictions of the resonance locations, compared to the observed ring radii, favored a
pattern speed of 23 km/s/kpc (or 26 km/s/kpc with our slightly
different distance adopted). With this pattern speed, there are two
inner Lindblad resonances (ILRs), located at 3.6 and 30′′2 . The
existence of two ILRs weakens the primary bar, and allows the
decoupling of a secondary bar, with a higher pattern speed (e.g.
Friedli & Martinet 1993, Buta & Combes 1996). The nuclear bar
produces negative torques on the gas, previously stalled at the
nuclear ring, and provides a dynamical way to fuel the nucleus.
This process has been simulated in detail in Hunt et al. (2008),
and shows how the gas in the nuclear ring progressively flows to
the center, in a spiral structure, and in a ring shrinking in radius.
It appears that this scenario applies quite well to NGC 1433: its
nuclear ring lies between the two ILRs, and the molecular gas
morphology reveals an accumulation of the gas at the inner ILR.
This configuration strongly suggests that the gas is presently fueling the AGN.
The top panel of Figure 2 displays the velocity field of the
molecular gas. The velocity field is well described by rotation,
2
Treuthardt et al. (2008) propose a lower value for the pattern speed
in NGC 1433, 18 km/s/kpc, but their simulation shows a nuclear ring
much larger in size than observed.
7. F. Combes et al.: CO in NGC 1433
with the same position angle as the HI velocity field at larger
scales (Ryder et al. 1996) and consistent with the Hα central
kinematics (Buta et al. 2001). There are no strong perturbations
to this regular rotation due to streaming motions in a barred potential, since the major axis of the galaxy is aligned with the
minor axis of the primary bar, and also with the nuclear bar (see
Fig. 3). The amplitude of the rotation is low but compatible with
the observed Hα velocities within 10′′ in radius, given the low
inclination of 33◦ . The rotation velocities deduced from the CO
kinematics are plotted in comparison to the Hα rotation curve in
Fig. 6.
Fig. 6. Top:Rotational velocity model adopted for NGC 1433, based on
the Hα kinematics (red filled squares) from Buta et al. (2001), compatible with the CO rotation curve (green filled hexagons). The CO velocity
field is however sparsely sampled. Bottom: Velocity residuals after subtraction of a regular rotation model, based on the Hα rotation curve
above. The map has been recentered on the new adopted center of Table
1. The two orthogonal lines indicate the position of the PV diagrams of
Fig 7.
There is however a noticeable redshifted perturbation located
in the very center and extending to the south-west between 0 and
2′′ i.e. 100 pc in extent. To better isolate this feature, we plot
the position-velocity diagram along the major axis of the galaxy
in the top of Fig. 7. This slice reveals gas jumping by almost
100 km/s in projection, at much higher velocity than the rest of
the nuclear disk gas. There is also a noticeable blue-shifted counterpart, at a distance from the center of about 2 ′′ (100 pc) towards
the north-west, which is conspicuous in the position-velocity diagram along the minor-axis of the galaxy in the bottom of Fig.
7. In this direction, both flow components are seen, while the
largest gradient of velocities is along PA= 135◦ , which might be
the projected direction of the flow.
Fig. 7. Top: Position-velocity diagram along the major axis of PA =
199◦ (east is at left). The central outflow is clearly visible superposed
on the smooth rotational velocity gradient (underlined by the yellow
line, corresponding to the rotation curve of Fig. 6). Bottom: Positionvelocity diagram, along the minor axis, of PA = 109◦ (East is at left).
The two components (red and blue) of the outflow are visible, along a
slice, where the velocity should be equal to the systemic one (yellow
line).
Another way to compare these peculiar velocities to the rest
of the nuclear region in 2D, is to subtract the expected regular
velocity field known from the Hα gas in the same region. Fig.
6 displays the residuals obtained, relative to the adopted Hα rotation curve, plotted above. The figure shows the ionized gas
7
8. F. Combes et al.: CO in NGC 1433
rotation curve deduced by Buta et al. (2001). The derived CO
velocities, although in sparse regions, are compatible with this
adopted rotation curve. The stellar velocity, once corrected by a
large asymmetric drift, appears higher (Buta et al. 2001). The gas
then does not follow the maximum circular velocity. This might
be due to substantial gas turbulence, and/or to an overestimation
of the correction of the stellar velocity.
The peculiar velocity of the gas at the nucleus and northwest of the center is clearly seen in the residuals of Fig. 6. If
the gas were in the plane, the deprojected velocity could be as
high as 200 km/s, but other orientations with respect to the sky
plane are possible. Let us call α the angle between the outflow
direction and the line of sight. The observed velocity in projection is Vout f low cos(α), and the extend of the flow in the plane of
the sky is Rout f low sin(α). It is likely that α is not close to the extreme values, i.e. zero or 90 degrees, since the observed outflow
velocity and the projected size of the outflow are both subtantial, i.e. respectively ∼ 100 km/s and ∼ 100 pc. This means that
tan(α) is of the order of 1. The flow is aligned roughly with the
minor axis, and if it was orthogonal to the plane, tan(α)=0.6.
We think, however, that the outflow is not orthogonal, since we
are seing the galaxy inclined by 33◦ on the sky, and the near
side is the NW, from the winding sense of the spiral arms, assumed trailing. The outflow cannot be exactly perpendicular to
the disk, unless the blue and red regions would be inverted. The
flow must at least be inclined by an angle > 33◦ from the normal to the plane. Conservatively, the outflow velocity likely lies
between 100 km/s and 200 km/s.
This high-velocity gas is also noticeable in the total spectrum, obtained by summing the signal over the field-of-view, as
in Fig. 8. A Gaussian decomposition in three components has
been performed on the spectrum, and the results displayed in
Table 3. The high-velocity red component represents nearly 5%
of the total. The blue-velocity counterpart is diluted in the normal rotational component C1 (part of the two-horn profile characteristic of rotation).
Fig. 8. Total CO(3-2) spectrum, integrated over the observed map, with
a FOV of 18′′ , after correction for primary beam attenuation. The vertical scale is in Jy. The green line is the result of the Gaussian fit with 3
velocity components; see Table 3.
8
Finally, the high-velocity red component is best located in
the map through the individual spectra of Fig. 9, where all spec′′
tra are shown within a radius of 2. 5. Although in principle, this
high velocity gas could be inflowing as well as outflowing, we
consider inflow to be unlikely. Indeed, there is no other signature of violent perturbation due to a companion nearby, and if
gas were slowly accreted to fuel the AGN, it would first have
settled into the rotational frame at much larger radii than the last
100 pc.
To better estimate the quantity of gas in the outflow, we have
′′
′′
summed the CO flux within 2 regions of sizes 0. 7×1. 2, centered
on the red and blue outflow regions, taking into account the primary beam correction (cf Fig 9). The results are given in Table
3. Assuming the standard CO-to-H2 conversion factor (see next
Section). we derive molecular masses of 1.3 106 and 2.3 106 M⊙
for the blue and red velocity components, respectively.
Is the outflow also detected in the ionized gas? There is no
outflow detected in X-rays, but there is not enough spatial resolution to see it anyway. In Hα maps and spectroscopy, it is hard
to reach a conclusion, even from the best velocity field obtained
from Fabry-Perot interferometry by Buta (1986). In his Fig. 8,
we can see a quite perturbed velocity field inside the central 20′′ ,
which may reflect steep gradients. However, the spatial resolution is only 2′′ , while the projected distance between our red
and blue outflow peak components is roughly the same. An outflow of ionized gas is however quite compatible with the data.
The non detection of ionized gas outflow in galaxies showing a
molecular outflow is also found in other compact systems like
NGC 1377 (Aalto et al. 2012). A comparison with other molecular outflows will be discussed in Section 4.
3.4. CO luminosity, H2 mass and HCO+ /HCN upper limits
Figure 8 displays the total CO(3-2) spectrum, integrated over
the entire observed map after correction for primary beam attenuation. When integrated over the line (FWHM=85.3 km/s),
the integrated emission is 234± 1 Jy km/s. Towards the central
position, Bajaja et al. (1995) found a CO(1-0) spectrum peaking at T∗ = 48mK, with FWHM=168 km/s, yielding a total inA
tegrated flux of 193 Jy km/s, in a beam of 43′′ . Unfortunately,
no CO(2-1) spectra have been reported. We can however remark
that the CO(1-0) flux corresponds to a larger region than the one
observed here (as witnessed by the broader linewidth), and our
CO(3-2) flux is an upper limit of the expected CO(1-0) flux in
a 18′′ beam, since at low J the flux increases with the J-level.
We can therefore safely conclude that the CO(3-2)/CO(1-0) ratio must be significantly larger than 2 in flux density units: the
CO gas is relatively excited, meaning that the average density
is at least of the order of 104 cm−3 . Assuming a CO(3-2)/CO(10) flux ratio of ∼5, similar to that observed in the star-forming
nuclei of nearby galaxies (e.g. Matsushita et al. 2004, Boone
et al. 2011), the CO detected inside our primary beam, at the
distance of 9.9 Mpc, corresponds to a molecular mass M(H2 ) =
5.2 107 M⊙ , with the standard CO-to-H2 conversion factor of 2.3
1020 cm−2 /(Kkm/s). By comparison, Bajaja et al. (1995) find in
their central 43′′ beam a mass of 1.8 108 M⊙ , covering an area
5.7 larger.
As far as the CO outflow is concerned, the use of any CO-toH2 conversion factor is uncertain. Let us then try to get a strict
minimum of the mass in using the hypothesis of optically thin
emission. Within this hypothesis, we can write the column density of CO in the upper state of the (3-2) transition as:
N J=3 = 6.41013 ICO(3−2)
9. F. Combes et al.: CO in NGC 1433
′′
Fig. 9. CO(3-2) spectra within 2. 5 of the center. The velocity scale is from 960 to 1190 km/s (corresponding to -115 to 115 km/s with respect to
the systemic velocity). The vertical scale is from 1 to 40 mJy. The new adopted center is marked with a black star (the map coordinates are with
respect to the phase center). The red velocity component can be seen at the new center and just above, and the blue velocity component is centered
′′
′′
at (-2, 0.5). The two regions 0. 7×1. 2 each, selected to integrate the outflow mass in Table 3 are indicated by red and blue rectangles respectively.
The corresponding integrated spectra are plotted in the insert (scale in Jy).
where ICO(3−2) is the integrated (3-2) emission in K.km/s. The
total CO column density is then obtained, using the ratio
N J=3 /NCO =
5
exp(−E J=3 /kT ex )
Q
where E J=3 is the energy in the upper level of the (3-2) transition, Q the partition function = 0.36 T ex , and T ex the excitation temperature, assumed constant over all J levels. The N(H2 )
column density is then derived, assuming a CO abundance of
6 10−5 (e.g. Glover & Mac Low 2011). Comparing the N(H2 )
values obtained within the optically thick hypothesis, and the
use of the standard conversion factor, we found column densities less by factors 27, 71 and 83 when T ex = 10, 20 and 30K
respectively. Over the red outflow region large as 3-4 beams, we
found N(H2 ) ∼ 5 1022 cm−2 , while the optically thin hypothesis
will lead to values as low as 6 1020 cm−2 . We estimate that such
low values are not realistic, however, since the mean volumetric
density over the region will be ∼ 1 cm−3 , and not 100 cm−3 , the
minimum required to excite CO emission. Note that the mean
CO(3-2) brightness temperature observed within the flow region
if 3K, so that the surface filling factor of the molecular component cannot be much smaller than 0.1. Since the critical density
of the CO(3-2) line is 105 cm−3 , the optically thin hypothesis is
very unlikely to provide any emission, even taking into account
the surface filling factor.
Finally, our simultaneous observations of HCO+ (4-3) and
HCN(4-3) yielded only negative results. We can better derive
significant upper limits towards the CO emission maxima. Over
the whole map, there were 160 pixels (equivalent to 8 beams)
with CO(3-2) emission larger than 60 times the 3σ upper limits in HCO+ (4-3) and HCN(4-3), assuming the same linewidth.
In all CO maxima, an intensity ratio between CO and the highdensity tracers >60 means that the average density of the gas in
the multiple-arm flocculent spiral is not high. The critical density to excite the HCO+ (4-3) and HCN(4-3) molecular lines is at
least 107 cm−3 .
9
10. F. Combes et al.: CO in NGC 1433
4. Discussion and summary
We have presented our first ALMA results for a Seyfert 2 galaxy
from our extended NUGA sample, NGC 1433. The observations
in CO(3-2) allow us to reach an unprecedented spatial resolution
of 24 pc, even with the limited Cycle 0 capabilities.
The morphology of the CO emission comes as a surprise.
Although the Seyfert 2-type would suggest the presence of a
thick obscuring component in front of the nucleus, there is no
large concentration of molecular gas in the center, but instead a
widely distributed multiple-arm spiral of CO emission, all over
the nuclear ring region. The dense gas tracers HCO + and HCN
remain undetected, confirming the absence of very dense gas
(density larger than 107 cm−3 ).
Although infrared images reveal the presence of a stellar
nuclear bar inside the nuclear ring (of radius 0.5 kpc), located
near the inner Lindblad resonances (e.g. Buta et al. 2001), the
gas does not follow the nuclear bar. Instead the gas appears to
flow inward and partly accumulate in a ring-like structure at
a radius ∼ 200 pc, which coincides with the inner ILR (IILR)
as computed by Buta et al. (2001). This is indeed expected
at some epochs of self-consistent N-body+hydro simulations,
when the gas enters an inflowing phase inside two ILRs (e.g.
Hunt et al. 2008). The gas is not stalled in this pseudo-ring, but
continues to flow in towards the very center.
The kinematics of the CO emission are dominated by a
rather regular rotational velocity field, with only slight perturbations from the multiple-arm spiral. No strong streaming motion is imprinted on these kinematics by the primary and nuclear bars, since their axes coincide with the galaxy major axis.
Additionally, two peculiar features appear at high velocity, one
red-shifted component towards the center within 100 pc, and a
blue-shifted counterpart at 2′′ (100 pc) from the center. The amplitude of these components is up to about 100 km/s in projection
(∼ 200 km/s if in the galaxy plane). Given their location near the
nucleus, we tentatively interpret these high-velocity features as
the two sides of an outflow. Globally, these features represent as
much as ∼ 7% of the total molecular emission, in the nuclear
ring region, i.e., 3.6 x 10⁶ M⊙ .
It is not likely that these peculiar high-velocity features reflect strong streaming motions due to a dynamical perturbation,
since there is no such perturbation in the center. The gas is not
following the nuclear bar, which is rather weak. Is a central mass
able to generate such a high rotation in the center? Considering
that the blue and red components are separated in projection
along the minor axis by 2′′ = 100 pc, or about 120 pc in the
plane of the galaxy, a massive black hole located in the center, at
R=60pc from each component, should have a mass of at least
MBH =V2 R/G, for the rotational velocity in the galaxy plane
V=200km/s, or M BH =5.6 108 M⊙ . This would make NGC 1433
a strong outlier to the M BH − σ relation; indeed from the bulge
mass, we would expect the BH mass to be 5 106 M⊙ , e.g., Buta
(1986). In any case, for gas rotating in circular motion, within
the sphere of influence of the black hole, the velocity maxima
should appear on the major axis and disappear on the minor axis,
contrary to what is observed here. Another solution would be to
assume the existence of a mini-polar disk, with completely different orientation than the main disk, and almost edge-on, but no
galaxy interaction or accretion event support this hypothesis.
The origin of the outflow might be related to star formation,
which is concentrated in the nuclear ring region. The star formation rate (SFR) can be estimated from the far infrared luminosity, as calibrated by Kennicutt (1998). From the IRAS
fluxes, the FIR luminosity is 1.3 109 L⊙ (Table 1), and the SFR
10
equals 0.2 M⊙ /yr. From the Hα luminosity, measured at 3.7 1040
erg/s by Hameed & Devereux (2005), we can also deduce from
Kennicutt’s calibration, a SFR = 0.29 M⊙ /yr, which is quite compatible.
The order of magnitude of the mass outflow rate can be computed, using our estimates for the molecular mass in the highvelocity components (Table 3), as M=3.6 106 M⊙ . This mass
has been obtained using the standard CO-to-H2 conversion factor, since there is no reason a priori to adopt the lower factor
applying to ULIRGs. Cicone et al. (2012) show in Mrk231 that
the molecular gas in the galaxy and the outflowing gas share the
same excitation. However, this mass could be an upper limit, if
the flow is made of more diffuse gas. Since each high-velocity
component has a projected radial extent from the center of d=1′′
∼ 50 pc, and moves at a projected velocity of v=100 km/s, the
flow rate is of the order of dM/dt ∼ (Mv/d) tanα= 7 tanα M⊙ /yr,
with α being the angle between the outflow and the line of sight.
Although this estimate is uncertain by a factor of a few, given
the unknown α, it is about 40 times higher than the SFR; since
galactic winds due to starbursts correspond in general to mass
outflows of the same order as the SFR (e.g. Veilleux et al. 2005),
we conclude that the outflow is not likely due to star formation
alone, and is at least helped by the AGN. We note that starburst
winds are generally observed in galaxies with SFR larger than 5
M⊙ /yr, and SFR surface densities larger than 10 −3 M⊙ /yr/kpc2 .
NGC 1433 has a low total SFR ∼ 0.2 M⊙ /yr, however, its SFR
surface density is 0.34 M⊙ /yr/kpc2 , if we assume that the whole
SFR is confined to the nuclear disk of 9′′ radius. The SFR surface
density would therefore be enough to drive a wind, although (as
noted above) the mass loading factor expected for this type of
wind would still be considerably lower than what we observe in
NGC 1433.
The kinetic luminosity of the flow can be estimated as Lkin
=0.5 dM/dt v2 =2.3 tanα (1+ tan2 α) 1040 erg/s. The luminosity
of the AGN can be estimated at various wavelengths. Although
the X-ray point source is weak, 1.7 1039 erg/s over 0.3-8kev (Liu
& Bregman 2005), we can derive a bolometric luminosity of
the AGN from optical and NIR magnitudes in the central aperture (Buta et al. 2001) of 1.3 1043 erg/s. From the expected BH
mass of 5 106 M⊙ , if NGC 1433 is on the MBH − σ relation, the
Eddington luminosity is 6.3 1044 erg/s. The kinetic luminosity
of the outflow is low with respect to the bolometric luminosity
of the AGN, making it plausible that the latter is able to power
the wind.
The momentum flux of the outflow, computed by dM/dt v
is however too large with respect to that provided by the AGN
photons LAGN /c, by a factor 2000 tanα/cosα. Although the momentum can be boosted in case of energy-conserved wind by
factors up to 50 (e.g. Faucher-Gigu` re & Quataert 2012), it is
e
more likely that the AGN contributes to drive the outflow not by
its radiation pressure, but through its radio jets. From the central 1.4 GHz power of 3.4mJy detected by Ryder et al. (1996),
we can estimate the jet power, from the formula proposed by
Birzan et al. (2008, their equation 16): P jet = 2 1042 erg/s. Since
this power is about two orders of magnitudes higher than the
kinetic luminosity of the outflow, the jet is amply able to drive
the flow, even with low coupling. The jet interaction with the
interstellar medium has been simulated by Wagner et al. (2012)
who show that the jet is able to drive a flow efficiently, as soon
as the Eddington ratio of the jet P jet /LEdd is larger than 10−4 . In
NGC 1433, this ratio is about 3.2 10−3 .
The molecular outflow in NGC 1433 is one of only a few
discovered recently occuring in low-star forming galaxies, with
relatively weak AGN, where the flow might be driven by both
11. F. Combes et al.: CO in NGC 1433
the starburst and the radio jets. The LINER NGC 6764 has 4.3
106 M⊙ of molecular gas driven out with a velocity of about
100 km/s (Leon et al. 2007). The flow projects to larger distances
than in NGC 1433, and might be more evolved. The outflow rate
is lower, of the order of 1 M ⊙ /yr. NGC 1266 is also a LINER and
has the highest flow rate of 13 M⊙ /yr, with 2.4 107 M⊙ of molecular gas driven with V=177 km/s (Alatalo et al. 2011). A third
LINER, with total SFR of ∼ 1 M⊙ /yr, NGC 1377 has an outflow
rate of 8 M⊙ /yr, an outflowing mass of 1.1 107 M⊙ , at V=140
km/s (Aalto et al. 2012). All these galaxies have star formation
playing a role in the outflow, but the properties of the flow require the contribution of the AGN, through the entrainement of
its radio jets. The latter is the most needed for NGC 1433, which
has the lowest SFR of all.
This tentative detection of a molecular gas outflow, triggered essentially by the AGN, should be confirmed by higherresolution ALMA observations. The detection of a radio continuum component at the very center, which might be due to
thermal dust emission from a molecular torus, also deserves a
higher-resolution study.
Acknowledgements. We warmly thank the referee for constructive comments
and suggestions. The ALMA staff in Chile and ARC-people at IRAM are
gratefully acknowledged for their help in the data reduction. We particularly
thank Gaelle Dumas and Philippe Salom´ for their useful advice. We used
e
observations made with the NASA/ESA Hubble Space Telescope, and obtained from the Hubble Legacy Archive, which is a collaboration between
the Space Telescope Science Institute (STScI/NASA), the Space Telescope
European Coordinating Facility (ST-ECF/ESA) and the Canadian Astronomy
Data Centre (CADC/NRC/CSA). F.C. acknowledges the European Research
Council for the Advanced Grant Program Num 267399-Momentum. I.M. acknowledges financial support from the Spanish grant AYA2010-15169 and from
the Junta de Andalucia through TIC-114 and the Excellence Project P08-TIC03531. We made use of the NASA/IPAC Extragalactic Database (NED), and of
the HyperLeda database.
References
Aalto S., Muller S., Sakamoto K. et al. 2012, A&A 546, A68
Alatalo K., Blitz L., Young L.M. et al. 2011, ApJ, 735, 88
Bajaja E., Wielebinski R., Reuter H.P. et al. 1995, A&AS, 114, 147
Birzan L., McNamara B.R., Nulsen P.E.J. et al. 2008, ApJ 686, 859
Boone F., Garcia-Burillo S., Combes F. et al. 2011, A&A, 525, A18
Buta R. 1986, ApJS 61, 631
Buta R., Combes F. 1996, Fundamentals of Cosmic Physics 17, 95
Buta R., Combes F. 2000, in ASP. Conf. Ser. 197, Dynamics of Galaxies: From
the Early Universe to the Present, ed. F. Combes, G. A. Mamon, & V.
Charmandaris (San Francisco ASP), 11
Buta, R., Ryder, S. D., Madsen, G. J., Wesson, K., Crocker, D. A., Combes, F.
2001, AJ, 121, 225
Casasola, V., Combes, F., Garcia-Burillo, S. 2008, A&A, 490, 61
Casasola, V., Hunt, L. K., Combes, F., Garcia-Burillo, S., Neri, R. 2011, A&A,
527, A92
Chung, A., Yun, M. S., Naraynan, G., Heyer, M., Erickson, N. R. 2011, ApJ,
732, L15
Cicone C., Feruglio C., Maiolino R. et al. 2012, A&A 543, A99
Coil, A. L., Weiner, B. J., Holz, D. E., et al. 2011, ApJ, 743, 46
Combes F. 2003 ASP Conf Series, 290. 411
Combes F. 2006 Astrophysics Update 2, Springer, p.159
Comeron, S., Knapen, J. H., Beckman, J. E. et al. 2010, MNRAS, 402, 2462
Croton, D. J., Springel, V., White, S. D. M. et al. 2006, MNRAS, 365, 11
Dasyra, K., Combes, F.: 2012, A&A 541, L7
Di Matteo, T., Colberg, J., Springel, V., Hernquist, L., Sijacki, D. 2008, ApJ,
676, 33
Draine B.T., Lee H.M. 1984, ApJ, 285, 89
Dumke M., Braine J., Krause M. et al. 1997, A&A, 325, 124
Faucher-Gigu` re C.-A., Quataert E. 2012, MNRAS 425, 605
e
Feruglio, C., Maiolino, R., Piconcelli, E., et al. 2010 A&A, 518, L155
Feruglio, C., Fiore, F., Piconcelli, E., et al. 2013, A&A, 549, A51
Fischer, J., Sturm, E., Gonzalez-Alfonso, E. et al. 2010, A&A 518, L41
Friedli D., Martinet L. 1993, A&A 277, 27
Galliano E., Aloin D. 2002 A&A, 393, 43
Garc`a-Burillo, S., Fernandez-Garcia S., Combes F. et al. 2009, A&A, 496, 85
ı
Garc`a-Burillo, S., Usero, A., Fuente, A. et al. 2010, A&A, 519, A2
ı
Glover, S. C. O., Mac Low, M.-M., 2011, MNRAS 412, 337
Guilloteau, S., Lucas, R. 2000, Imaging at Radio through Submillimeter
Wavelengths, 217, 299, 10
Hameed S., Devereux N. 2005, AJ, 129, 2597
Harnett J.I. 1987, MNRAS, 227, 887
Ho, L. C., Li, Z-Y, Barth, A. J. et al. 2011, ApJS, 197, 21
Hopkins, P.F., Quataert, E.2010, MNRAS, 407, 1529
Hopkins, P., Hernquist, L., Cox, T.J. et al. 2006, ApJS, 163, 1
Hunt L.K., Malkan M.A. 1999, ApJ, 516, 660
Hunt, L. K., Combes F., Garcia-Burillo S. et al. 2008, A&A, 482, 133
Jogee S. 2006 Lecture Notes in Physics 693, 143
Jungwiert B., Combes F., Axon D.J. 1997, A&AS, 125, 479
Kennicutt R.C. 1998, ApJ, 498, 541
Kilborn, V. A., Koribalsi B.S., Forbes, D.A. et al. 2005, MNRAS 356, 77
Kormendy J., Ho L.C. 2013, ARAA in press, arXiv:1308.6483
Krips M., Martin, S., Eckart, A. et al. 2011, ApJ, 736, 37
Leon S., Eckart A., Laine S. et al. 2007, A&A 473, 747
Lindt-Krieg, E., Eckart, A., Neri, R. et al. 2008, A&A, 479, 377
Liu J-F., Bregman J.N.: 2005, ApJS 157, 59
Malkan M., Gorjian V., Tam R. 1998, ApJS, 117, 25
Maoz, D., Barth, A. J., Sternberg, A., et al. 1996, AJ, 111, 2248
Matsushita S., Sakamoto K., Kuo C-Y. et al. . 2004, ApJ, 616, L55
McMullin, J. P., Waters, B., Schiebel, D., Young, W., Golap, K. 2007,
Astronomical Data Analysis Software and Systems XVI, 376, 127
M¨ ller Snchez, F., Davies, R. I., Genzel, R. et al. 2009, ApJ, 691, 749
u
Nesvadba, N. P. H., Polletta, M., Lehnert, M. D. et al. 2011, MNRAS 415, 2359
Peeples, M. S., Martini, P. 2006, ApJ, 652, 1097
Perez-Beaupuits, J.,Wada, K., Spaans, M.2011, ApjJ, 730, 48
Piner, B.G., Stone, J.M., Teuben, P.J. 1995, ApJ, 449, 508
Regan, M.W., Teuben, P.J. 2004, ApJ, 600, 595
Riffel R.A., Storchi-Bergmann T. 2011, MNRAS, 411, 469
Roussel, H., Vigroux, L., Bosma, A. et al. 2001, A&A 369, 473
Rupke, D. S., Veilleux, S., Sanders, D. B.2005, ApJ, 632, 751
Ryder, S. D., Buta, R. J., Toledo, H. 1996, ApJ, 460, 665
Sadler E.M., Slee O.B., Reynolds J.E., Roy A.L. 1995, MNRAS, 276, 1373
Sakamoto K, Aalto S., Wilner D. et al. 2009, ApJ, 700, L104
Schinnerer, E., Eckart, A., Tacconi, L. J., Genzel, R., Downes, D. 2000, ApJ,
533, 850
Solomon P.M., Vanden Bout P.A. 2005, ARAA, 43, 677
Sosa-Brito, R. M., Tacconi-Garman, L. E., Lehnert, M. D., Gallimore, J. F. 2001,
ApJS, 136, 61
Spoon H.W.W., Farrah D., Lebouteiller V. et al. , 2013, ApJ sub
(arXiv1307.6224)
Stil J.M., Krause M., Beck R., Taylor A.R. 2009, ApJ, 693, 1392
Sturm, E., Gonzalez-Alfonso, E., Veilleux, S. et al. 2011, ApJ, 733, L16
Treuthardt P., Salo H., Rautiainen P., Buta R. 2008, AJ, 136, 300
Ulvestad, J. S., Ho, L. C. 2001, ApJ, 558, 561
Veilleux S., Cecil G., Bland-Hawthorn J.: 2005, ARAA 43, 769
Veilleux S., Melendez M., Sturm E. et al. 2013, ApJ sub (arXiv1308.3139)
Veron-Cetty, M.P., Veron, P. 1986, A&AS, 66, 335
Wagner A.Y., Bicknell G.V., Umemura M. 2012, ApJ 757, 136
11