SlideShare a Scribd company logo
1 of 5
Download to read offline
EQUITY RESEARCH
August 18, 2005                                                                                                                                                                                    North America
                                                                                                                                                                                     Investment Strategy & Macro
Equity Derivatives Strategy                                                                                                                                                            Equity Derivatives Strategy

Market CommentaryStrategy                                                                                                                                                                                               Ryan Renicker
                                                                                                                                                                                                                        1.212.526.9425
The "Richest of the Rich"                                                                                                                                                                                        rrenicke@lehman.com


Sector View:
New: 0-Not Rated
Old: 0-Not Rated

Investment conclusion
! During the past couple of weeks, rising crude oil prices have weighed on the U.S. equity market, with the S&P500 declining nearly 200
   bps since its 52-week high on August 3rd. (Even with yesterday's 4% decline in crude oil prices, oil prices remain 4% higher than where
   they traded on August 3rd.) Moreover, this retracement has been broad-based, with 23 of the 24 S&P 500 industry groups trading below
   their August 3rd levels. In fact, since August 3rd, 387 companies in the S&P 500 (77%) have had declining stock prices. Although U.S.
   equity risk expectations remain extremely low relative to long-term trends in rolling 3-month S&P 500 implied volatilities, the recent
   weakness in the equity markets has nudged short-dated implied volatilities higher, despite declining realized volatility. With Q2 earnings
   largely behind us, and implied volatility currently trading relatively rich versus realized volatility, we believe investors should consider
   expressing directional viewpoints or hedging existing positions by selling options in companies having the “richest” options. We screen the
   S&P 500 Index for stocks currently having 3-month implied volatilities trading relatively "rich" versus 1) their 90-day realized volatility and
   2) the S&P 500 Index.


Figure 1: Returns (8/3/05 – Present)                                                           Figure 2: S&P 500 Index Level & Volatility (8/3/05 - Present)
           Real Estat e                                                                                                           3M Implied - 90D Realized Spread                                                S&P 500
                   Con Dur&Ap
                          Utilit ies                                                            3.75%                                                                                                                                    1,250
                           Retailing
                       Auto & Comp                                                              3.55%
                    Semi & Semi Eqp                                                                                                                                                                                                      1,245
                     Food/St pl Retail                                                          3.35%
                         Comm Svc&Sup
                                     M at erials                                                3.15%                                                                                                                                    1,240
                              Tech Hw & Eqp
                               Telecomm Svcs                                                    2.95%
                                    Pharm & Biot                                                                                                                                                                                         1,235
                                           Energy
                                     Hh & Pr Pdt s                                              2.75%
                                         Transpt n                                                                                                                                                                                       1,230
                                               Banks                                            2.55%
                                      S&P 500 Index
                                              Insurance                                         2.35%                                                                                                                                    1,225
                                              Fd Bev & Tob
                                               Div Financial
                                                 Sf tw & Svcs
                                                                                                2.15%
                                                      Cons Srv
                                                                                                                                                                                                                                         1,220
                                                  Capit al Gds
                                                                                                1.95%
                                                    Hc Equip&Svc
                                                                         M edia                 1.75%                                                                                                                                    1,215
                                                                                                            08/03/05

                                                                                                                       08/04/05

                                                                                                                                    08/05/05

                                                                                                                                               08/08/05

                                                                                                                                                          08/09/05

                                                                                                                                                                     08/10/05

                                                                                                                                                                                08/11/05

                                                                                                                                                                                           08/12/05

                                                                                                                                                                                                      08/15/05

                                                                                                                                                                                                                   08/16/05

                                                                                                                                                                                                                              08/17/05

                                                                                  Crude Oil

-10%       -8%          -6%          -4%          -2%          0%   2%      4%            6%


Source: Lehman Brothers Equity Derivatives Strategy.                                           Source: Lehman Brothers Equity Derivatives Strategy.


Lehman Brothers does and seeks to do business with companies covered in its research reports. As a result, investors
should be aware that the Firm may have a conflict of interest that could affect the objectivity of this report.

Investors should consider this report as only a single factor in making their investment decisions.


          PLEASE SEE ANALYST(S) CERTIFICATION(S) ON PAGE 3 AND IMPORTANT DISCLOSURES
                                      BEGINNING ON PAGE 4
                                                                                                                                                                                                                                                 1
EQUITY RESEARCH
In this note, we screen the S&P 500 to identify stocks having the “richest” options.

These stocks currently have

    1.   3-month implied volatility spreads versus the S&P 500 at least 1 standard deviation above the average of where this spread has
         traded during the past year and

    2.   3-month implied volatility spreads versus their 90-day realized volatility at least 1 standard deviation above where this spread
         has traded during the past year.

Below, we present the companies that match both of these criteria.

Figure 3: S&P 500 Stocks Passing Our “Richest-of-the-Rich” Screen
                                                                                                                   Options "Rich" Versus
                                                                                       Expected EPS                              90-Day
   Ticker                     Name                      GICS Industry Group Name                      Last Price   S&P 500
                                                                                            Date                                Realized
ADBE UQ      ADOBE SYSTEMS INC                     SOFTWARE & SERVICES                  15-Sep-2005   $   26.83      Yes           Yes
BSC UN       BEAR STEARNS COMPANIES INC            DIVERS FINANC                        22-Sep-2005   $   99.85      Yes           Yes
WAG UN       WALGREEN CO                           FOOD & STAPLES RETAILING             26-Sep-2005   $   47.58      Yes           Yes
PEP UN       PEPSICO INC                           FOOD BEV & TOBACCO                   30-Sep-2005   $   54.73      Yes           Yes
JNJ UN       JOHNSON & JOHNSON                     PHARMA & BIOTECH                     12-Oct-2005   $   63.50      Yes           Yes
RDC UN       ROWAN COMPANIES INC                   ENERGY                               14-Oct-2005   $   33.58      Yes           Yes
BR UN        BURLINGTON RESOURCES INC              ENERGY                               20-Oct-2005   $   64.32      Yes           Yes
EK UN        EASTMAN KODAK CO                      CONS DUR & APPAREL                   20-Oct-2005   $   25.27      Yes           Yes
TMK UN       TORCHMARK CORP                        INSURANCE                            20-Oct-2005   $   51.90      Yes           Yes
XTO UN       XTO ENERGY INC                        ENERGY                               20-Oct-2005   $   35.28      Yes           Yes
ED UN        CONSOLIDATED EDISON INC               UTILITIES                            21-Oct-2005   $   45.93      Yes           Yes
TXU UN       TXU CORP                              UTILITIES                            21-Oct-2005   $   94.76      Yes           Yes
PHM UN       PULTE HOMES INC                       CONS DUR & APPAREL                   25-Oct-2005   $   85.25      Yes           Yes
COP UN       CONOCOPHILLIPS                        ENERGY                               27-Oct-2005   $   61.70      Yes           Yes
APA UN       APACHE CORP                           ENERGY                               28-Oct-2005   $   67.43      Yes           Yes
CVS UN       CVS CORP                              FOOD & STAPLES RETAILING              4-Nov-2005   $   29.19      Yes           Yes
Source: Lehman Brothers Equity Derivatives Strategy.

We believe investors should consider expressing directional views or hedging existing positions in these names by selling options.


                                                                                                                                            2
EQUITY RESEARCH
Options are not suitable for all investors and the risks of option trading should be weighed against the potential rewards.
Supporting documents that form the basis of the recommendations are available on request. Please note that the trade ideas within
this report in no way relate to the fundamental ratings applied to European stocks by Lehman Brothers' Equity Research.


Analyst Certification:
I, Ryan Renicker, hereby certify (1) that the views expressed in this research Industry Note accurately reflect my personal views about any or
all of the subject securities or issuers referred to in this Industry Note and (2) no part of my compensation was, is or will be directly or
indirectly related to the specific recommendations or views expressed in this Industry Note.


                                                                                                                                             3
EQUITY RESEARCH


Important Disclosures:
The analysts responsible for preparing this report have received compensation based upon various factors including the Firm’s total
revenues, a portion of which is generated by investment banking activities.


Guide to Lehman Brothers Equity Research Rating System:
Our coverage analysts use a relative rating system in which they rate stocks as 1-Overweight, 2- Equal weight or 3-Underweight (see
definitions below) relative to other companies covered by the analyst or a team of analysts that are deemed to be in the same industry sector
(the “sector coverage universe”). To see a list of the companies that comprise a particular sector coverage universe, please go to
www.lehman.com/disclosures

In addition to the stock rating, we provide sector views which rate the outlook for the sector coverage universe as 1-Positive, 2-Neutral or
3-Negative (see definitions below). A rating system using terms such as buy, hold and sell is not the equivalent of our rating system.
Investors should carefully read the entire research report including the definitions of all ratings and not infer its contents from ratings alone.

Stock Rating
1-Overweight - The stock is expected to outperform the unweighted expected total return of the sector coverage universe over a 12-month
investment horizon.
2-Equal weight - The stock is expected to perform in line with the unweighted expected total return of the sector coverage universe over a
12- month investment horizon.
3-Underweight - The stock is expected to underperform the unweighted expected total return of the sector coverage universe over a 12-
month investment horizon.
RS-Rating Suspended - The rating and target price have been suspended temporarily to comply with applicable regulations and/or firm
policies in certain circumstances including when Lehman Brothers is acting in an advisory capacity in a merger or strategic transaction
involving the company.

Sector View
1-Positive - sector coverage universe fundamentals/valuations are improving.
2-Neutral - sector coverage universe fundamentals/valuations are steady, neither improving nor deteriorating.
3-Negative - sector coverage universe fundamentals/valuations are deteriorating.

Stock Ratings From February 2001 to August 5, 2002 (sector view did not exist):
This is a guide to expected total return (price performance plus dividend) relative to the total return of the stocks’ local market (i.e. the market
where the stock primarily trades) over the next 12 months.
1-Strong Buy - expected to outperform the market by 15 or more percentage points.
2-Buy - expected to outperform the market by 5-15 percentage points.
3-Market Perform - expected to perform in line with the market, plus or minus 5 percentage points.
4-Market Underperform - expected to underperform the market by 5-15 percentage points.
5-Sell - expected to underperform the market by 15 or more percentage points.

Distribution of Ratings:
Lehman Brothers Global Equity Research has 1744 companies under coverage.
41% have been assigned a 1-Overweight rating which, for purposes of mandatory regulatory disclosures, is classified as Buy rating, 33% of
companies with this rating are investment banking clients of the Firm.
42% have been assigned a 2-Equal weight rating which, for purposes of mandatory regulatory disclosures, is classified as Hold rating, 7% of
companies with this rating are investment banking clients of the Firm.
17% have been assigned a 3-Underweight rating which, for purposes of mandatory regulatory disclosures, is classified as Sell rating, 86% of
companies with this rating are investment banking clients of the Firm.

This material has been prepared and/or issued by Lehman Brothers Inc., member SIPC, and/or one of its affiliates (“Lehman Brothers”) and has been
approved by Lehman Brothers International (Europe), authorized and regulated by the Financial Services Authority, in connection with its distribution in the
European Economic Area. This material is distributed in Japan by Lehman Brothers Japan Inc., and in Hong Kong by Lehman Brothers Asia Limited. This
material is distributed in Australia by Lehman Brothers Australia Pty Limited, and in Singapore by Lehman Brothers Inc., Singapore Branch. This material is
distributed in Korea by Lehman Brothers International (Europe) Seoul Branch. This document is for information purposes only and it should not be regarded
as an offer to sell or as a solicitation of an offer to buy the securities or other instruments mentioned in it. No part of this document may be reproduced in any
manner without the written permission of Lehman Brothers. With the exception of disclosures relating to Lehman Brothers, this research report is based on
current public information that Lehman Brothers considers reliable, but we make no representation that it is accurate or complete, and it should not be relied on
as such. In the case of any disclosure to the effect that Lehman Brothers Inc. or its affiliates beneficially own 1% or more of any class of common equity
securities of the subject company, the computation of beneficial ownership of securities is based upon the methodology used to compute ownership under
Section 13(d) of the United States' Securities Exchange Act of 1934. In the case of any disclosure to the effect that Lehman Brothers Inc. and/or its affiliates
hold a short position of at least 1% of the outstanding share capital of a particular company, such disclosure relates solely to the ordinary share capital of the
company. Accordingly, while such calculation represents Lehman Brothers’ holdings net of any long position in the ordinary share capital of the company, such
calculation excludes any rights or obligations that Lehman Brothers may otherwise have, or which may accrue in the future, with respect to such ordinary share
capital. Similarly such calculation does not include any shares held or owned by Lehman Brothers where such shares are held under a wider agreement or

                                                                                                                                                                4
EQUITY RESEARCH
arrangement (be it with a client or a counterparty) concerning the shares of such company (e.g. prime broking and/or stock lending activity). Any such
disclosure represents the position of Lehman Brothers as of the last business day of the calendar month preceding the date of this report.
This material is provided with the understanding that Lehman Brothers is not acting in a fiduciary capacity. Opinions expressed herein reflect the opinion of
Lehman Brothers and are subject to change without notice. The products mentioned in this document may not be eligible for sale in some states or countries,
and they may not be suitable for all types of investors. If an investor has any doubts about product suitability, he should consult his Lehman Brothers
representative. The value of and the income produced by products may fluctuate, so that an investor may get back less than he invested. Value and income
may be adversely affected by exchange rates, interest rates, or other factors. Past performance is not necessarily indicative of future results. If a product is
income producing, part of the capital invested may be used to pay that income. © 2005 Lehman Brothers. All rights reserved. Additional information is
available on request. Please contact a Lehman Brothers entity in your home jurisdiction.

Lehman Brothers policy for managing conflicts of interest in connection with investment research is available at www.lehman.com/researchconflictspolicy.
Ratings, earnings per share forecasts and price targets contained in the Firm's equity research reports covering U.S. companies are available at
www.lehman.com/disclosures.

Complete disclosure information on companies covered by Lehman Brothers Equity Research is available at www.lehman.com/disclosures.


                                                                                                                                                               5

More Related Content

More from RYAN RENICKER

Equity Derivatives Strategy - A Stock Picker's Market?
Equity Derivatives Strategy - A Stock Picker's Market?Equity Derivatives Strategy - A Stock Picker's Market?
Equity Derivatives Strategy - A Stock Picker's Market?RYAN RENICKER
 
Technology Stocks: A Stock Picker's Market?
Technology Stocks: A Stock Picker's Market?Technology Stocks: A Stock Picker's Market?
Technology Stocks: A Stock Picker's Market?RYAN RENICKER
 
How to Strengthen Portfolio Returns as the Dollar Weakens!
How to Strengthen Portfolio Returns as the Dollar Weakens!How to Strengthen Portfolio Returns as the Dollar Weakens!
How to Strengthen Portfolio Returns as the Dollar Weakens!RYAN RENICKER
 
SMH - Semiconductor Stock Options Cheap Despite CATALYSTS AHEAD!
SMH - Semiconductor Stock Options Cheap Despite CATALYSTS AHEAD!SMH - Semiconductor Stock Options Cheap Despite CATALYSTS AHEAD!
SMH - Semiconductor Stock Options Cheap Despite CATALYSTS AHEAD!RYAN RENICKER
 
Stock Options on ANF and GPS - The Market's Expectation for Same-Store Sales
Stock Options on ANF and GPS - The Market's Expectation for Same-Store SalesStock Options on ANF and GPS - The Market's Expectation for Same-Store Sales
Stock Options on ANF and GPS - The Market's Expectation for Same-Store SalesRYAN RENICKER
 
Option Strategies for Power and Utilities Industries
Option Strategies for Power and Utilities IndustriesOption Strategies for Power and Utilities Industries
Option Strategies for Power and Utilities IndustriesRYAN RENICKER
 
Options Strategy Monthly - 2006 - Low Volatility in the 7th Inning? Housing M...
Options Strategy Monthly - 2006 - Low Volatility in the 7th Inning? Housing M...Options Strategy Monthly - 2006 - Low Volatility in the 7th Inning? Housing M...
Options Strategy Monthly - 2006 - Low Volatility in the 7th Inning? Housing M...RYAN RENICKER
 
Pinning of Stock Prices on Expiration Date - Equity Options
Pinning of Stock Prices on Expiration Date - Equity OptionsPinning of Stock Prices on Expiration Date - Equity Options
Pinning of Stock Prices on Expiration Date - Equity OptionsRYAN RENICKER
 
The Risk and Return of the Buy Write Strategy On The Russell 2000 Index
The Risk and Return of the Buy Write Strategy On The Russell 2000 IndexThe Risk and Return of the Buy Write Strategy On The Russell 2000 Index
The Risk and Return of the Buy Write Strategy On The Russell 2000 IndexRYAN RENICKER
 
Option Strategies - Natural Gas Trading Opportunities
Option Strategies - Natural Gas Trading OpportunitiesOption Strategies - Natural Gas Trading Opportunities
Option Strategies - Natural Gas Trading OpportunitiesRYAN RENICKER
 
McDonald's Options are Trading Rich - Super Sized Volatility
McDonald's Options are Trading Rich - Super Sized VolatilityMcDonald's Options are Trading Rich - Super Sized Volatility
McDonald's Options are Trading Rich - Super Sized VolatilityRYAN RENICKER
 
Career and Job-Search Bibliography - Compiled by Richard Greene
Career and Job-Search Bibliography - Compiled by Richard GreeneCareer and Job-Search Bibliography - Compiled by Richard Greene
Career and Job-Search Bibliography - Compiled by Richard GreeneRYAN RENICKER
 
Option Implied Volatility for Small Cap Stocks
Option Implied Volatility for Small Cap StocksOption Implied Volatility for Small Cap Stocks
Option Implied Volatility for Small Cap StocksRYAN RENICKER
 
Collar Strategies - Not Hedged - Profitable but Also Risky
Collar Strategies - Not Hedged - Profitable but Also RiskyCollar Strategies - Not Hedged - Profitable but Also Risky
Collar Strategies - Not Hedged - Profitable but Also RiskyRYAN RENICKER
 
Risk Premium in Options for the Energy Sector
Risk Premium in Options for the Energy SectorRisk Premium in Options for the Energy Sector
Risk Premium in Options for the Energy SectorRYAN RENICKER
 
Stock Market Indices Trading in a Very Narrow Trading Range
Stock Market Indices Trading in a Very Narrow Trading RangeStock Market Indices Trading in a Very Narrow Trading Range
Stock Market Indices Trading in a Very Narrow Trading RangeRYAN RENICKER
 
Weakening the Case for a "Summer Volatility Crush"
Weakening the Case for a "Summer Volatility Crush"Weakening the Case for a "Summer Volatility Crush"
Weakening the Case for a "Summer Volatility Crush"RYAN RENICKER
 
Short Variance Swap Strategies on the S&P 500 Index Profitable, Yet Risky
Short Variance Swap Strategies on the S&P 500 Index Profitable, Yet RiskyShort Variance Swap Strategies on the S&P 500 Index Profitable, Yet Risky
Short Variance Swap Strategies on the S&P 500 Index Profitable, Yet RiskyRYAN RENICKER
 
Identifying Rich and Cheap Implied Volatility - Equity Options
Identifying Rich and Cheap Implied Volatility - Equity OptionsIdentifying Rich and Cheap Implied Volatility - Equity Options
Identifying Rich and Cheap Implied Volatility - Equity OptionsRYAN RENICKER
 
Options Not Fully Pricing in Hurricane Risks
Options Not Fully Pricing in Hurricane RisksOptions Not Fully Pricing in Hurricane Risks
Options Not Fully Pricing in Hurricane RisksRYAN RENICKER
 

More from RYAN RENICKER (20)

Equity Derivatives Strategy - A Stock Picker's Market?
Equity Derivatives Strategy - A Stock Picker's Market?Equity Derivatives Strategy - A Stock Picker's Market?
Equity Derivatives Strategy - A Stock Picker's Market?
 
Technology Stocks: A Stock Picker's Market?
Technology Stocks: A Stock Picker's Market?Technology Stocks: A Stock Picker's Market?
Technology Stocks: A Stock Picker's Market?
 
How to Strengthen Portfolio Returns as the Dollar Weakens!
How to Strengthen Portfolio Returns as the Dollar Weakens!How to Strengthen Portfolio Returns as the Dollar Weakens!
How to Strengthen Portfolio Returns as the Dollar Weakens!
 
SMH - Semiconductor Stock Options Cheap Despite CATALYSTS AHEAD!
SMH - Semiconductor Stock Options Cheap Despite CATALYSTS AHEAD!SMH - Semiconductor Stock Options Cheap Despite CATALYSTS AHEAD!
SMH - Semiconductor Stock Options Cheap Despite CATALYSTS AHEAD!
 
Stock Options on ANF and GPS - The Market's Expectation for Same-Store Sales
Stock Options on ANF and GPS - The Market's Expectation for Same-Store SalesStock Options on ANF and GPS - The Market's Expectation for Same-Store Sales
Stock Options on ANF and GPS - The Market's Expectation for Same-Store Sales
 
Option Strategies for Power and Utilities Industries
Option Strategies for Power and Utilities IndustriesOption Strategies for Power and Utilities Industries
Option Strategies for Power and Utilities Industries
 
Options Strategy Monthly - 2006 - Low Volatility in the 7th Inning? Housing M...
Options Strategy Monthly - 2006 - Low Volatility in the 7th Inning? Housing M...Options Strategy Monthly - 2006 - Low Volatility in the 7th Inning? Housing M...
Options Strategy Monthly - 2006 - Low Volatility in the 7th Inning? Housing M...
 
Pinning of Stock Prices on Expiration Date - Equity Options
Pinning of Stock Prices on Expiration Date - Equity OptionsPinning of Stock Prices on Expiration Date - Equity Options
Pinning of Stock Prices on Expiration Date - Equity Options
 
The Risk and Return of the Buy Write Strategy On The Russell 2000 Index
The Risk and Return of the Buy Write Strategy On The Russell 2000 IndexThe Risk and Return of the Buy Write Strategy On The Russell 2000 Index
The Risk and Return of the Buy Write Strategy On The Russell 2000 Index
 
Option Strategies - Natural Gas Trading Opportunities
Option Strategies - Natural Gas Trading OpportunitiesOption Strategies - Natural Gas Trading Opportunities
Option Strategies - Natural Gas Trading Opportunities
 
McDonald's Options are Trading Rich - Super Sized Volatility
McDonald's Options are Trading Rich - Super Sized VolatilityMcDonald's Options are Trading Rich - Super Sized Volatility
McDonald's Options are Trading Rich - Super Sized Volatility
 
Career and Job-Search Bibliography - Compiled by Richard Greene
Career and Job-Search Bibliography - Compiled by Richard GreeneCareer and Job-Search Bibliography - Compiled by Richard Greene
Career and Job-Search Bibliography - Compiled by Richard Greene
 
Option Implied Volatility for Small Cap Stocks
Option Implied Volatility for Small Cap StocksOption Implied Volatility for Small Cap Stocks
Option Implied Volatility for Small Cap Stocks
 
Collar Strategies - Not Hedged - Profitable but Also Risky
Collar Strategies - Not Hedged - Profitable but Also RiskyCollar Strategies - Not Hedged - Profitable but Also Risky
Collar Strategies - Not Hedged - Profitable but Also Risky
 
Risk Premium in Options for the Energy Sector
Risk Premium in Options for the Energy SectorRisk Premium in Options for the Energy Sector
Risk Premium in Options for the Energy Sector
 
Stock Market Indices Trading in a Very Narrow Trading Range
Stock Market Indices Trading in a Very Narrow Trading RangeStock Market Indices Trading in a Very Narrow Trading Range
Stock Market Indices Trading in a Very Narrow Trading Range
 
Weakening the Case for a "Summer Volatility Crush"
Weakening the Case for a "Summer Volatility Crush"Weakening the Case for a "Summer Volatility Crush"
Weakening the Case for a "Summer Volatility Crush"
 
Short Variance Swap Strategies on the S&P 500 Index Profitable, Yet Risky
Short Variance Swap Strategies on the S&P 500 Index Profitable, Yet RiskyShort Variance Swap Strategies on the S&P 500 Index Profitable, Yet Risky
Short Variance Swap Strategies on the S&P 500 Index Profitable, Yet Risky
 
Identifying Rich and Cheap Implied Volatility - Equity Options
Identifying Rich and Cheap Implied Volatility - Equity OptionsIdentifying Rich and Cheap Implied Volatility - Equity Options
Identifying Rich and Cheap Implied Volatility - Equity Options
 
Options Not Fully Pricing in Hurricane Risks
Options Not Fully Pricing in Hurricane RisksOptions Not Fully Pricing in Hurricane Risks
Options Not Fully Pricing in Hurricane Risks
 

Recently uploaded

Youth Involvement in an Innovative Coconut Value Chain by Mwalimu Menza
Youth Involvement in an Innovative Coconut Value Chain by Mwalimu MenzaYouth Involvement in an Innovative Coconut Value Chain by Mwalimu Menza
Youth Involvement in an Innovative Coconut Value Chain by Mwalimu Menzaictsugar
 
Market Sizes Sample Report - 2024 Edition
Market Sizes Sample Report - 2024 EditionMarket Sizes Sample Report - 2024 Edition
Market Sizes Sample Report - 2024 EditionMintel Group
 
Cybersecurity Awareness Training Presentation v2024.03
Cybersecurity Awareness Training Presentation v2024.03Cybersecurity Awareness Training Presentation v2024.03
Cybersecurity Awareness Training Presentation v2024.03DallasHaselhorst
 
Traction part 2 - EOS Model JAX Bridges.
Traction part 2 - EOS Model JAX Bridges.Traction part 2 - EOS Model JAX Bridges.
Traction part 2 - EOS Model JAX Bridges.Anamaria Contreras
 
Cyber Security Training in Office Environment
Cyber Security Training in Office EnvironmentCyber Security Training in Office Environment
Cyber Security Training in Office Environmentelijahj01012
 
Annual General Meeting Presentation Slides
Annual General Meeting Presentation SlidesAnnual General Meeting Presentation Slides
Annual General Meeting Presentation SlidesKeppelCorporation
 
Kenya Coconut Production Presentation by Dr. Lalith Perera
Kenya Coconut Production Presentation by Dr. Lalith PereraKenya Coconut Production Presentation by Dr. Lalith Perera
Kenya Coconut Production Presentation by Dr. Lalith Pereraictsugar
 
Financial-Statement-Analysis-of-Coca-cola-Company.pptx
Financial-Statement-Analysis-of-Coca-cola-Company.pptxFinancial-Statement-Analysis-of-Coca-cola-Company.pptx
Financial-Statement-Analysis-of-Coca-cola-Company.pptxsaniyaimamuddin
 
Flow Your Strategy at Flight Levels Day 2024
Flow Your Strategy at Flight Levels Day 2024Flow Your Strategy at Flight Levels Day 2024
Flow Your Strategy at Flight Levels Day 2024Kirill Klimov
 
8447779800, Low rate Call girls in New Ashok Nagar Delhi NCR
8447779800, Low rate Call girls in New Ashok Nagar Delhi NCR8447779800, Low rate Call girls in New Ashok Nagar Delhi NCR
8447779800, Low rate Call girls in New Ashok Nagar Delhi NCRashishs7044
 
8447779800, Low rate Call girls in Uttam Nagar Delhi NCR
8447779800, Low rate Call girls in Uttam Nagar Delhi NCR8447779800, Low rate Call girls in Uttam Nagar Delhi NCR
8447779800, Low rate Call girls in Uttam Nagar Delhi NCRashishs7044
 
Buy gmail accounts.pdf Buy Old Gmail Accounts
Buy gmail accounts.pdf Buy Old Gmail AccountsBuy gmail accounts.pdf Buy Old Gmail Accounts
Buy gmail accounts.pdf Buy Old Gmail AccountsBuy Verified Accounts
 
Organizational Structure Running A Successful Business
Organizational Structure Running A Successful BusinessOrganizational Structure Running A Successful Business
Organizational Structure Running A Successful BusinessSeta Wicaksana
 
PSCC - Capability Statement Presentation
PSCC - Capability Statement PresentationPSCC - Capability Statement Presentation
PSCC - Capability Statement PresentationAnamaria Contreras
 
MAHA Global and IPR: Do Actions Speak Louder Than Words?
MAHA Global and IPR: Do Actions Speak Louder Than Words?MAHA Global and IPR: Do Actions Speak Louder Than Words?
MAHA Global and IPR: Do Actions Speak Louder Than Words?Olivia Kresic
 

Recently uploaded (20)

No-1 Call Girls In Goa 93193 VIP 73153 Escort service In North Goa Panaji, Ca...
No-1 Call Girls In Goa 93193 VIP 73153 Escort service In North Goa Panaji, Ca...No-1 Call Girls In Goa 93193 VIP 73153 Escort service In North Goa Panaji, Ca...
No-1 Call Girls In Goa 93193 VIP 73153 Escort service In North Goa Panaji, Ca...
 
Youth Involvement in an Innovative Coconut Value Chain by Mwalimu Menza
Youth Involvement in an Innovative Coconut Value Chain by Mwalimu MenzaYouth Involvement in an Innovative Coconut Value Chain by Mwalimu Menza
Youth Involvement in an Innovative Coconut Value Chain by Mwalimu Menza
 
Corporate Profile 47Billion Information Technology
Corporate Profile 47Billion Information TechnologyCorporate Profile 47Billion Information Technology
Corporate Profile 47Billion Information Technology
 
Japan IT Week 2024 Brochure by 47Billion (English)
Japan IT Week 2024 Brochure by 47Billion (English)Japan IT Week 2024 Brochure by 47Billion (English)
Japan IT Week 2024 Brochure by 47Billion (English)
 
Market Sizes Sample Report - 2024 Edition
Market Sizes Sample Report - 2024 EditionMarket Sizes Sample Report - 2024 Edition
Market Sizes Sample Report - 2024 Edition
 
Cybersecurity Awareness Training Presentation v2024.03
Cybersecurity Awareness Training Presentation v2024.03Cybersecurity Awareness Training Presentation v2024.03
Cybersecurity Awareness Training Presentation v2024.03
 
Traction part 2 - EOS Model JAX Bridges.
Traction part 2 - EOS Model JAX Bridges.Traction part 2 - EOS Model JAX Bridges.
Traction part 2 - EOS Model JAX Bridges.
 
Call Us ➥9319373153▻Call Girls In North Goa
Call Us ➥9319373153▻Call Girls In North GoaCall Us ➥9319373153▻Call Girls In North Goa
Call Us ➥9319373153▻Call Girls In North Goa
 
Cyber Security Training in Office Environment
Cyber Security Training in Office EnvironmentCyber Security Training in Office Environment
Cyber Security Training in Office Environment
 
Annual General Meeting Presentation Slides
Annual General Meeting Presentation SlidesAnnual General Meeting Presentation Slides
Annual General Meeting Presentation Slides
 
Kenya Coconut Production Presentation by Dr. Lalith Perera
Kenya Coconut Production Presentation by Dr. Lalith PereraKenya Coconut Production Presentation by Dr. Lalith Perera
Kenya Coconut Production Presentation by Dr. Lalith Perera
 
Financial-Statement-Analysis-of-Coca-cola-Company.pptx
Financial-Statement-Analysis-of-Coca-cola-Company.pptxFinancial-Statement-Analysis-of-Coca-cola-Company.pptx
Financial-Statement-Analysis-of-Coca-cola-Company.pptx
 
Flow Your Strategy at Flight Levels Day 2024
Flow Your Strategy at Flight Levels Day 2024Flow Your Strategy at Flight Levels Day 2024
Flow Your Strategy at Flight Levels Day 2024
 
Enjoy ➥8448380779▻ Call Girls In Sector 18 Noida Escorts Delhi NCR
Enjoy ➥8448380779▻ Call Girls In Sector 18 Noida Escorts Delhi NCREnjoy ➥8448380779▻ Call Girls In Sector 18 Noida Escorts Delhi NCR
Enjoy ➥8448380779▻ Call Girls In Sector 18 Noida Escorts Delhi NCR
 
8447779800, Low rate Call girls in New Ashok Nagar Delhi NCR
8447779800, Low rate Call girls in New Ashok Nagar Delhi NCR8447779800, Low rate Call girls in New Ashok Nagar Delhi NCR
8447779800, Low rate Call girls in New Ashok Nagar Delhi NCR
 
8447779800, Low rate Call girls in Uttam Nagar Delhi NCR
8447779800, Low rate Call girls in Uttam Nagar Delhi NCR8447779800, Low rate Call girls in Uttam Nagar Delhi NCR
8447779800, Low rate Call girls in Uttam Nagar Delhi NCR
 
Buy gmail accounts.pdf Buy Old Gmail Accounts
Buy gmail accounts.pdf Buy Old Gmail AccountsBuy gmail accounts.pdf Buy Old Gmail Accounts
Buy gmail accounts.pdf Buy Old Gmail Accounts
 
Organizational Structure Running A Successful Business
Organizational Structure Running A Successful BusinessOrganizational Structure Running A Successful Business
Organizational Structure Running A Successful Business
 
PSCC - Capability Statement Presentation
PSCC - Capability Statement PresentationPSCC - Capability Statement Presentation
PSCC - Capability Statement Presentation
 
MAHA Global and IPR: Do Actions Speak Louder Than Words?
MAHA Global and IPR: Do Actions Speak Louder Than Words?MAHA Global and IPR: Do Actions Speak Louder Than Words?
MAHA Global and IPR: Do Actions Speak Louder Than Words?
 

The Most Expensive Equity Options - Buy or Sell?

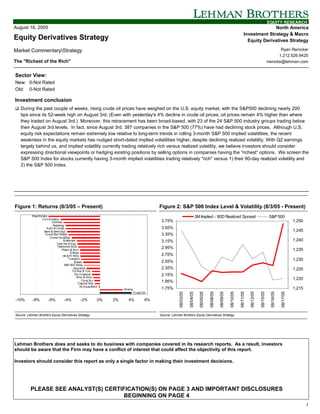
  • 1. EQUITY RESEARCH August 18, 2005 North America Investment Strategy & Macro Equity Derivatives Strategy Equity Derivatives Strategy Market CommentaryStrategy Ryan Renicker 1.212.526.9425 The "Richest of the Rich" rrenicke@lehman.com Sector View: New: 0-Not Rated Old: 0-Not Rated Investment conclusion ! During the past couple of weeks, rising crude oil prices have weighed on the U.S. equity market, with the S&P500 declining nearly 200 bps since its 52-week high on August 3rd. (Even with yesterday's 4% decline in crude oil prices, oil prices remain 4% higher than where they traded on August 3rd.) Moreover, this retracement has been broad-based, with 23 of the 24 S&P 500 industry groups trading below their August 3rd levels. In fact, since August 3rd, 387 companies in the S&P 500 (77%) have had declining stock prices. Although U.S. equity risk expectations remain extremely low relative to long-term trends in rolling 3-month S&P 500 implied volatilities, the recent weakness in the equity markets has nudged short-dated implied volatilities higher, despite declining realized volatility. With Q2 earnings largely behind us, and implied volatility currently trading relatively rich versus realized volatility, we believe investors should consider expressing directional viewpoints or hedging existing positions by selling options in companies having the “richest” options. We screen the S&P 500 Index for stocks currently having 3-month implied volatilities trading relatively "rich" versus 1) their 90-day realized volatility and 2) the S&P 500 Index. Figure 1: Returns (8/3/05 – Present) Figure 2: S&P 500 Index Level & Volatility (8/3/05 - Present) Real Estat e 3M Implied - 90D Realized Spread S&P 500 Con Dur&Ap Utilit ies 3.75% 1,250 Retailing Auto & Comp 3.55% Semi & Semi Eqp 1,245 Food/St pl Retail 3.35% Comm Svc&Sup M at erials 3.15% 1,240 Tech Hw & Eqp Telecomm Svcs 2.95% Pharm & Biot 1,235 Energy Hh & Pr Pdt s 2.75% Transpt n 1,230 Banks 2.55% S&P 500 Index Insurance 2.35% 1,225 Fd Bev & Tob Div Financial Sf tw & Svcs 2.15% Cons Srv 1,220 Capit al Gds 1.95% Hc Equip&Svc M edia 1.75% 1,215 08/03/05 08/04/05 08/05/05 08/08/05 08/09/05 08/10/05 08/11/05 08/12/05 08/15/05 08/16/05 08/17/05 Crude Oil -10% -8% -6% -4% -2% 0% 2% 4% 6% Source: Lehman Brothers Equity Derivatives Strategy. Source: Lehman Brothers Equity Derivatives Strategy. Lehman Brothers does and seeks to do business with companies covered in its research reports. As a result, investors should be aware that the Firm may have a conflict of interest that could affect the objectivity of this report. Investors should consider this report as only a single factor in making their investment decisions. PLEASE SEE ANALYST(S) CERTIFICATION(S) ON PAGE 3 AND IMPORTANT DISCLOSURES BEGINNING ON PAGE 4 1
  • 2. EQUITY RESEARCH In this note, we screen the S&P 500 to identify stocks having the “richest” options. These stocks currently have 1. 3-month implied volatility spreads versus the S&P 500 at least 1 standard deviation above the average of where this spread has traded during the past year and 2. 3-month implied volatility spreads versus their 90-day realized volatility at least 1 standard deviation above where this spread has traded during the past year. Below, we present the companies that match both of these criteria. Figure 3: S&P 500 Stocks Passing Our “Richest-of-the-Rich” Screen Options "Rich" Versus Expected EPS 90-Day Ticker Name GICS Industry Group Name Last Price S&P 500 Date Realized ADBE UQ ADOBE SYSTEMS INC SOFTWARE & SERVICES 15-Sep-2005 $ 26.83 Yes Yes BSC UN BEAR STEARNS COMPANIES INC DIVERS FINANC 22-Sep-2005 $ 99.85 Yes Yes WAG UN WALGREEN CO FOOD & STAPLES RETAILING 26-Sep-2005 $ 47.58 Yes Yes PEP UN PEPSICO INC FOOD BEV & TOBACCO 30-Sep-2005 $ 54.73 Yes Yes JNJ UN JOHNSON & JOHNSON PHARMA & BIOTECH 12-Oct-2005 $ 63.50 Yes Yes RDC UN ROWAN COMPANIES INC ENERGY 14-Oct-2005 $ 33.58 Yes Yes BR UN BURLINGTON RESOURCES INC ENERGY 20-Oct-2005 $ 64.32 Yes Yes EK UN EASTMAN KODAK CO CONS DUR & APPAREL 20-Oct-2005 $ 25.27 Yes Yes TMK UN TORCHMARK CORP INSURANCE 20-Oct-2005 $ 51.90 Yes Yes XTO UN XTO ENERGY INC ENERGY 20-Oct-2005 $ 35.28 Yes Yes ED UN CONSOLIDATED EDISON INC UTILITIES 21-Oct-2005 $ 45.93 Yes Yes TXU UN TXU CORP UTILITIES 21-Oct-2005 $ 94.76 Yes Yes PHM UN PULTE HOMES INC CONS DUR & APPAREL 25-Oct-2005 $ 85.25 Yes Yes COP UN CONOCOPHILLIPS ENERGY 27-Oct-2005 $ 61.70 Yes Yes APA UN APACHE CORP ENERGY 28-Oct-2005 $ 67.43 Yes Yes CVS UN CVS CORP FOOD & STAPLES RETAILING 4-Nov-2005 $ 29.19 Yes Yes Source: Lehman Brothers Equity Derivatives Strategy. We believe investors should consider expressing directional views or hedging existing positions in these names by selling options. 2
  • 3. EQUITY RESEARCH Options are not suitable for all investors and the risks of option trading should be weighed against the potential rewards. Supporting documents that form the basis of the recommendations are available on request. Please note that the trade ideas within this report in no way relate to the fundamental ratings applied to European stocks by Lehman Brothers' Equity Research. Analyst Certification: I, Ryan Renicker, hereby certify (1) that the views expressed in this research Industry Note accurately reflect my personal views about any or all of the subject securities or issuers referred to in this Industry Note and (2) no part of my compensation was, is or will be directly or indirectly related to the specific recommendations or views expressed in this Industry Note. 3
  • 4. EQUITY RESEARCH Important Disclosures: The analysts responsible for preparing this report have received compensation based upon various factors including the Firm’s total revenues, a portion of which is generated by investment banking activities. Guide to Lehman Brothers Equity Research Rating System: Our coverage analysts use a relative rating system in which they rate stocks as 1-Overweight, 2- Equal weight or 3-Underweight (see definitions below) relative to other companies covered by the analyst or a team of analysts that are deemed to be in the same industry sector (the “sector coverage universe”). To see a list of the companies that comprise a particular sector coverage universe, please go to www.lehman.com/disclosures In addition to the stock rating, we provide sector views which rate the outlook for the sector coverage universe as 1-Positive, 2-Neutral or 3-Negative (see definitions below). A rating system using terms such as buy, hold and sell is not the equivalent of our rating system. Investors should carefully read the entire research report including the definitions of all ratings and not infer its contents from ratings alone. Stock Rating 1-Overweight - The stock is expected to outperform the unweighted expected total return of the sector coverage universe over a 12-month investment horizon. 2-Equal weight - The stock is expected to perform in line with the unweighted expected total return of the sector coverage universe over a 12- month investment horizon. 3-Underweight - The stock is expected to underperform the unweighted expected total return of the sector coverage universe over a 12- month investment horizon. RS-Rating Suspended - The rating and target price have been suspended temporarily to comply with applicable regulations and/or firm policies in certain circumstances including when Lehman Brothers is acting in an advisory capacity in a merger or strategic transaction involving the company. Sector View 1-Positive - sector coverage universe fundamentals/valuations are improving. 2-Neutral - sector coverage universe fundamentals/valuations are steady, neither improving nor deteriorating. 3-Negative - sector coverage universe fundamentals/valuations are deteriorating. Stock Ratings From February 2001 to August 5, 2002 (sector view did not exist): This is a guide to expected total return (price performance plus dividend) relative to the total return of the stocks’ local market (i.e. the market where the stock primarily trades) over the next 12 months. 1-Strong Buy - expected to outperform the market by 15 or more percentage points. 2-Buy - expected to outperform the market by 5-15 percentage points. 3-Market Perform - expected to perform in line with the market, plus or minus 5 percentage points. 4-Market Underperform - expected to underperform the market by 5-15 percentage points. 5-Sell - expected to underperform the market by 15 or more percentage points. Distribution of Ratings: Lehman Brothers Global Equity Research has 1744 companies under coverage. 41% have been assigned a 1-Overweight rating which, for purposes of mandatory regulatory disclosures, is classified as Buy rating, 33% of companies with this rating are investment banking clients of the Firm. 42% have been assigned a 2-Equal weight rating which, for purposes of mandatory regulatory disclosures, is classified as Hold rating, 7% of companies with this rating are investment banking clients of the Firm. 17% have been assigned a 3-Underweight rating which, for purposes of mandatory regulatory disclosures, is classified as Sell rating, 86% of companies with this rating are investment banking clients of the Firm. This material has been prepared and/or issued by Lehman Brothers Inc., member SIPC, and/or one of its affiliates (“Lehman Brothers”) and has been approved by Lehman Brothers International (Europe), authorized and regulated by the Financial Services Authority, in connection with its distribution in the European Economic Area. This material is distributed in Japan by Lehman Brothers Japan Inc., and in Hong Kong by Lehman Brothers Asia Limited. This material is distributed in Australia by Lehman Brothers Australia Pty Limited, and in Singapore by Lehman Brothers Inc., Singapore Branch. This material is distributed in Korea by Lehman Brothers International (Europe) Seoul Branch. This document is for information purposes only and it should not be regarded as an offer to sell or as a solicitation of an offer to buy the securities or other instruments mentioned in it. No part of this document may be reproduced in any manner without the written permission of Lehman Brothers. With the exception of disclosures relating to Lehman Brothers, this research report is based on current public information that Lehman Brothers considers reliable, but we make no representation that it is accurate or complete, and it should not be relied on as such. In the case of any disclosure to the effect that Lehman Brothers Inc. or its affiliates beneficially own 1% or more of any class of common equity securities of the subject company, the computation of beneficial ownership of securities is based upon the methodology used to compute ownership under Section 13(d) of the United States' Securities Exchange Act of 1934. In the case of any disclosure to the effect that Lehman Brothers Inc. and/or its affiliates hold a short position of at least 1% of the outstanding share capital of a particular company, such disclosure relates solely to the ordinary share capital of the company. Accordingly, while such calculation represents Lehman Brothers’ holdings net of any long position in the ordinary share capital of the company, such calculation excludes any rights or obligations that Lehman Brothers may otherwise have, or which may accrue in the future, with respect to such ordinary share capital. Similarly such calculation does not include any shares held or owned by Lehman Brothers where such shares are held under a wider agreement or 4
  • 5. EQUITY RESEARCH arrangement (be it with a client or a counterparty) concerning the shares of such company (e.g. prime broking and/or stock lending activity). Any such disclosure represents the position of Lehman Brothers as of the last business day of the calendar month preceding the date of this report. This material is provided with the understanding that Lehman Brothers is not acting in a fiduciary capacity. Opinions expressed herein reflect the opinion of Lehman Brothers and are subject to change without notice. The products mentioned in this document may not be eligible for sale in some states or countries, and they may not be suitable for all types of investors. If an investor has any doubts about product suitability, he should consult his Lehman Brothers representative. The value of and the income produced by products may fluctuate, so that an investor may get back less than he invested. Value and income may be adversely affected by exchange rates, interest rates, or other factors. Past performance is not necessarily indicative of future results. If a product is income producing, part of the capital invested may be used to pay that income. © 2005 Lehman Brothers. All rights reserved. Additional information is available on request. Please contact a Lehman Brothers entity in your home jurisdiction. Lehman Brothers policy for managing conflicts of interest in connection with investment research is available at www.lehman.com/researchconflictspolicy. Ratings, earnings per share forecasts and price targets contained in the Firm's equity research reports covering U.S. companies are available at www.lehman.com/disclosures. Complete disclosure information on companies covered by Lehman Brothers Equity Research is available at www.lehman.com/disclosures. 5