SlideShare a Scribd company logo
1 of 16
Download to read offline
April 2016 Monthly Snapshot
One-Year Change in One-Year Change in
Median Sales Price
Single Family
Median Sales Price
Condo/TIC/Coop
2
3
4
5
6
7
8
9
10
11
12
13
14
15
16
Current as of May 11, 2016. All data from the San Francisco MLS. Report © 2016 ShowingTime.
Condo/TIC/Coop Activity Overview
Inventory of Active Listings
% of Properties Sold Over List Price
% of List Price Received
Housing Affordability Ratio
All Properties Activity Overview
New Listings
Pending Sales
Sold Listings
Median Sales Price
Average Sales Price
Days on Market Until Sale
Activity by District
Monthly Indicators
+ 7.1% + 6.6% + 5.8%
One-Year Change in
The housing market is being predictable, and that's a good thing. At the
beginning of the year, it was anticipated that the prevailing trends of the past
year would continue into and through 2016, and that has largely been the case.
The number of homes for sale has generally remained lower compared to a year
ago, and prices have been steadily rising in desirable communities where
homes show well.
New Listings were down 2.4 percent for single family homes and 10.2 percent
for Condo/TIC/Coop properties. Pending Sales decreased 8.0 percent for single
family homes and 14.6 percent for Condo/TIC/Coop properties.
The Median Sales Price was up 7.1 percent to $1,400,000 for single family
homes and 6.6 percent to $1,149,000 for Condo/TIC/Coop properties. Months
Supply of Inventory increased 16.7 percent for single family units and 36.8
percent for Condo/TIC/Coop units.
There have been no striking changes to curtail what should be a decent run of
home sales over the next several months. Mortgage rates have remained
stubbornly and wonderfully low, the unemployment rate has remained at or near
5.0 percent for eight straight months and wages have increased for a great
many people. New construction has been slow, and that may be a damper on
sales, but the general outlook remains strong.
Median Sales Price
All Property Types
Residential real estate activity in San Francisco County (Districts 1-10),
comprised of single-family properties, townhomes and condominiums.
Percent changes are calculated using rounded figures.
Single Family Activity Overview
Months Supply of Inventory
Single Family Activity Overview
Key metrics by report month and for year-to-date (YTD) starting from the first of the year.
Key Metrics Historical Sparkbars 4-2015 4-2016 Percent Change YTD 2015 YTD 2016 Percent Change
- 5.2%890
561 - 13.2%
$1,350,000 + 11.7%
+ 5.2%
Pending Sales 226 208 - 8.0% - 11.1%705 627
New Listings 251 245 - 2.4% 939
Sold Listings 218 198 - 9.2% 646
Median Sales Price $1,307,500 $1,400,000 + 7.1% $1,209,000
31 + 14.8%
$1,719,533
-- --
Days on Market 23 32 + 39.1% 27
Avg. Sales Price $1,765,744 $1,794,963 + 1.7% $1,634,882
Active Listings 359 394 + 9.7% --
% of Properties Sold Over List Price 83.5% 76.8% - 8.0% 78.0%
41
78.6% + 0.8%
- 0.5%
39 - 4.9%
113.3%% of List Price Received 116.8% 113.8% - 2.6% 113.9%
Current as of May 11, 2016. All data from the San Francisco MLS. Report © 2016 ShowingTime. | 2
Months Supply 1.8 2.1 + 16.7% -- -- --
Affordability Ratio 38 37 - 2.6%
4-2013 4-2014 4-2015 4-2016
4-2013 4-2014 4-2015 4-2016
4-2013 4-2014 4-2015 4-2016
4-2013 4-2014 4-2015 4-2016
4-2013 4-2014 4-2015 4-2016
4-2013 4-2014 4-2015 4-2016
4-2013 4-2014 4-2015 4-2016
4-2013 4-2014 4-2015 4-2016
4-2013 4-2014 4-2015 4-2016
4-2013 4-2014 4-2015 4-2016
4-2013 4-2014 4-2015 4-2016
Condo/TIC/Coop Activity Overview
Key metrics by report month and for year-to-date (YTD) starting from the first of the year.
Key Metrics Historical Sparkbars 4-2015 4-2016 Percent Change YTD 2015 YTD 2016 Percent Change
+ 2.6%
Pending Sales 280 239 - 14.6% 933 834 - 10.6%
New Listings 354 318 - 10.2% 1,249 1,282
Sold Listings 288 215 - 25.3% 871 775 - 11.0%
Median Sales Price $1,077,500 $1,149,000 + 6.6% $1,060,000 $1,100,000 + 3.8%
+ 0.9%
36 + 9.1%
$1,262,021
-- --
Days on Market 31 38 + 22.6% 33
Avg. Sales Price $1,317,148 $1,367,048 + 3.8% $1,250,723
Active Listings 495 608 + 22.8% --
% of Properties Sold Over List Price 71.2% 60.9% - 14.5% 67.0%
54
61.3% - 8.5%
- 2.7%
56 + 3.7%
105.5%% of List Price Received 109.3% 105.3% - 3.7% 108.4%
Current as of May 11, 2016. All data from the San Francisco MLS. Report © 2016 ShowingTime. | 3
Months Supply 1.9 2.6 + 36.8% -- -- --
Affordability Ratio 53 53 0.0%
4-2013 4-2014 4-2015 4-2016
4-2013 4-2014 4-2015 4-2016
4-2013 4-2014 4-2015 4-2016
4-2013 4-2014 4-2015 4-2016
4-2013 4-2014 4-2015 4-2016
4-2013 4-2014 4-2015 4-2016
4-2013 4-2014 4-2015 4-2016
4-2013 4-2014 4-2015 4-2016
4-2013 4-2014 4-2015 4-2016
4-2013 4-2014 4-2015 4-2016
4-2013 4-2014 4-2015 4-2016
New Listings
New Listings
Single
Family
Year-Over-Year
Change
Condo/TIC/
Coop
Year-Over-Year
Change
May-2015 259 -5.8% 335 -6.2%
Jun-2015 252 -9.0% 312 -13.1%
Jul-2015 255 -4.1% 294 -17.4%
Aug-2015 234 +3.5% 286 +4.8%
Sep-2015 324 -7.4% 438 +12.6%
Oct-2015 263 +5.2% 318 -5.1%
Nov-2015 143 +11.7% 194 +16.2%
Dec-2015 66 -15.4% 120 +9.1%
Jan-2016 178 -10.6% 286 +7.1%
Feb-2016 221 -7.1% 323 +9.1%
Mar-2016 246 -2.0% 355 +6.9%
Apr-2016 245 -2.4% 318 -10.2%
12-Month Avg 224 -3.7% 298 -0.4%
Historical New Listings by Month
Current as of May 11, 2016. All data from the San Francisco MLS. Report © 2016 ShowingTime. | 4
A count of the properties that have been newly listed on the market in a given month.
241
367
251
354
245
318
Single Family Condo/TIC/Coop
April
0
100
200
300
400
500
600
700
1-2005 1-2006 1-2007 1-2008 1-2009 1-2010 1-2011 1-2012 1-2013 1-2014 1-2015 1-2016
Single Family Condo/TIC/Coop
874
1,307
939
1,249
890
1,282
Single Family Condo/TIC/Coop
Year to Date
2014 2015 2016
- 10.2%- 3.5%- 2.4%+ 4.1% - 4.4%- 5.2%+ 7.4% + 2.6%
2014 2015 2016 2014 2015 2016 2014 2015 2016
- 19.7% - 9.8% - 6.2%- 7.3%
Pending Sales
Pending Sales
Single
Family
Year-Over-Year
Change
Condo/TIC/
Coop
Year-Over-Year
Change
May-2015 209 -2.3% 291 -1.7%
Jun-2015 220 +10.0% 294 -4.2%
Jul-2015 209 -7.9% 255 -6.9%
Aug-2015 205 +0.5% 231 -13.2%
Sep-2015 199 -6.6% 217 -19.0%
Oct-2015 265 -0.7% 283 -6.0%
Nov-2015 175 -16.7% 239 +9.6%
Dec-2015 131 -3.7% 176 -15.4%
Jan-2016 99 -9.2% 140 -6.0%
Feb-2016 125 -9.4% 228 +7.0%
Mar-2016 195 -15.9% 227 -22.0%
Apr-2016 208 -8.0% 239 -14.6%
12-Month Avg 187 -5.7% 235 -8.2%
Historical Pending Sales by Month
Current as of May 11, 2016. All data from the San Francisco MLS. Report © 2016 ShowingTime. | 5
A count of the properties on which offers have been accepted in a given month.
207
293
226
280
208
239
Single Family Condo/TIC/Coop
April
0
100
200
300
400
1-2005 1-2006 1-2007 1-2008 1-2009 1-2010 1-2011 1-2012 1-2013 1-2014 1-2015 1-2016
Single Family Condo/TIC/Coop
721
1,022
705
933
627
834
Single Family Condo/TIC/Coop
Year to Date
2014 2015 2016
- 14.6%- 4.4%- 8.0%+ 9.2% - 8.7%- 11.1%- 2.2% - 10.6%
2014 2015 2016 2014 2015 2016 2014 2015 2016
- 14.1% - 4.5% + 2.1%- 5.2%
Sold Listings
Sold Listings
Single
Family
Year-Over-Year
Change
Condo/TIC/
Coop
Year-Over-Year
Change
May-2015 205 -10.9% 286 -3.1%
Jun-2015 219 +14.1% 291 +1.7%
Jul-2015 236 +3.5% 272 -1.8%
Aug-2015 198 -6.2% 229 -20.2%
Sep-2015 164 -16.8% 181 -27.0%
Oct-2015 243 -12.6% 266 -16.6%
Nov-2015 187 -7.0% 206 -4.6%
Dec-2015 208 +6.1% 283 +24.7%
Jan-2016 105 -4.5% 147 -7.0%
Feb-2016 101 -21.7% 165 +2.5%
Mar-2016 157 -16.9% 248 -6.1%
Apr-2016 198 -9.2% 215 -25.3%
12-Month Avg 185 -6.6% 232 -7.8%
Historical Sold Listings by Month
Current as of May 11, 2016. All data from the San Francisco MLS. Report © 2016 ShowingTime. | 6
A count of the actual sales that closed in a given month.
206
326
218
288
198
215
Single Family Condo/TIC/Coop
April
0
100
200
300
400
1-2005 1-2006 1-2007 1-2008 1-2009 1-2010 1-2011 1-2012 1-2013 1-2014 1-2015 1-2016
Single Family Condo/TIC/Coop
673
994
646
871
561
775
Single Family Condo/TIC/Coop
Year to Date
2014 2015 2016
- 25.3%- 11.7%- 9.2%+ 5.8% - 12.4%- 13.2%- 4.0% - 11.0%
2014 2015 2016 2014 2015 2016 2014 2015 2016
- 6.8% - 6.3% + 6.2%+ 7.2%
Median Sales Price
Median Sales Price
Single
Family
Year-Over-Year
Change
Condo/TIC/
Coop
Year-Over-Year
Change
May-2015 $1,400,000 +28.4% $1,112,500 +18.4%
Jun-2015 $1,300,000 +10.6% $1,100,000 +15.2%
Jul-2015 $1,280,000 +18.4% $1,033,509 +8.8%
Aug-2015 $1,225,444 +26.6% $1,045,000 +12.4%
Sep-2015 $1,155,000 +11.6% $1,040,000 +13.7%
Oct-2015 $1,270,000 +6.7% $1,100,000 +15.2%
Nov-2015 $1,275,000 +13.2% $1,125,000 +10.3%
Dec-2015 $1,201,500 +12.1% $1,098,000 +18.7%
Jan-2016 $1,175,000 +20.5% $1,040,000 +15.6%
Feb-2016 $1,400,000 +25.6% $1,095,000 -0.5%
Mar-2016 $1,355,000 +8.4% $1,100,000 0.0%
Apr-2016 $1,400,000 +7.1% $1,149,000 +6.6%
12-Month Avg* $1,280,000 +14.8% $1,100,000 +12.4%
Historical Median Sales Price by Month
* Median Sales Price for all properties from May 2015 through April 2016. This is not the average
of the individual figures above.
Current as of May 11, 2016. All data from the San Francisco MLS. Report © 2016 ShowingTime. | 7
Point at which half of the sales sold for more and half sold for less, not accounting for seller concessions, in a given month.
$1,100,000
$905,000
$1,307,500
$1,077,500
$1,400,000
$1,149,000
Single Family Condo/TIC/Coop
April
$400,000
$600,000
$800,000
$1,000,000
$1,200,000
$1,400,000
$1,600,000
1-2005 1-2006 1-2007 1-2008 1-2009 1-2010 1-2011 1-2012 1-2013 1-2014 1-2015 1-2016
Single Family Condo/TIC/Coop
$1,000,800
$935,000
$1,209,000
$1,060,000
$1,350,000
$1,100,000
Single Family Condo/TIC/Coop
Year to Date
2014 2015 2016
+ 6.6%+ 19.1%+ 7.1%+ 18.9% + 13.4%+ 11.7%+ 20.8% + 3.8%
2014 2015 2016 2014 2015 2016 2014 2015 2016
+ 10.0% + 15.7% + 16.9%+ 7.1%
Average Sales Price
Avg. Sales Price
Single
Family
Year-Over-Year
Change
Condo/TIC/
Coop
Year-Over-Year
Change
May-2015 $1,839,795 +26.1% $1,329,588 +14.6%
Jun-2015 $1,776,727 +11.2% $1,298,673 +11.4%
Jul-2015 $1,657,986 +17.9% $1,214,445 +11.0%
Aug-2015 $1,505,629 +13.5% $1,159,211 +6.2%
Sep-2015 $1,390,736 +5.6% $1,166,494 +14.9%
Oct-2015 $1,627,981 -2.5% $1,184,400 +11.0%
Nov-2015 $1,704,450 +16.7% $1,262,796 +12.6%
Dec-2015 $1,497,221 +11.8% $1,249,856 +9.2%
Jan-2016 $1,573,224 +23.0% $1,166,245 +6.6%
Feb-2016 $1,618,843 +4.4% $1,210,302 +0.5%
Mar-2016 $1,787,032 +2.2% $1,262,150 -2.9%
Apr-2016 $1,794,963 +1.7% $1,367,048 +3.8%
12-Month Avg* $1,654,279 +10.0% $1,244,913 +8.4%
Historical Average Sales Price by Month
* Avg. Sales Price for all properties from May 2015 through April 2016. This is not the average of
the individual figures above.
Current as of May 11, 2016. All data from the San Francisco MLS. Report © 2016 ShowingTime. | 8
Average sales price for all closed sales, not accounting for seller concessions, in a given month.
$1,512,204
$1,112,733
$1,765,744
$1,317,148
$1,794,963
$1,367,048
Single Family Condo/TIC/Coop
April
$600,000
$800,000
$1,000,000
$1,200,000
$1,400,000
$1,600,000
$1,800,000
$2,000,000
1-2005 1-2006 1-2007 1-2008 1-2009 1-2010 1-2011 1-2012 1-2013 1-2014 1-2015 1-2016
Single Family Condo/TIC/Coop
$1,414,935
$1,071,236
$1,634,882
$1,250,723
$1,719,533
$1,262,021
Single Family Condo/TIC/Coop
Year to Date
2014 2015 2016
+ 3.8%+ 18.4%+ 1.7%+ 16.8% + 16.8%+ 5.2%+ 15.5% + 0.9%
2014 2015 2016 2014 2015 2016 2014 2015 2016
+ 11.4% + 15.5% + 16.0%+ 14.3%
Days on Market Until Sale
Days on Market
Single
Family
Year-Over-Year
Change
Condo/TIC/
Coop
Year-Over-Year
Change
May-2015 23 -4.2% 28 0.0%
Jun-2015 28 +3.7% 26 -21.2%
Jul-2015 25 -16.7% 29 -12.1%
Aug-2015 28 +3.7% 29 -12.1%
Sep-2015 27 +3.8% 34 -8.1%
Oct-2015 25 -16.7% 26 -29.7%
Nov-2015 28 -9.7% 34 -10.5%
Dec-2015 33 -15.4% 43 -8.5%
Jan-2016 40 -7.0% 44 -10.2%
Feb-2016 31 +10.7% 35 +20.7%
Mar-2016 25 +4.2% 30 +7.1%
Apr-2016 32 +39.1% 38 +22.6%
12-Month Avg* 28 -2.1% 32 -6.9%
Historical Days on Market Until Sale by Month
* Days on Market for all properties from May 2015 through April 2016. This is not the average of
the individual figures above.
Current as of May 11, 2016. All data from the San Francisco MLS. Report © 2016 ShowingTime. | 9
Average number of days between when a property is listed and when an offer is accepted in a given month.
35
31
23
3132
38
Single Family Condo/TIC/Coop
April
20
40
60
80
100
120
1-2005 1-2006 1-2007 1-2008 1-2009 1-2010 1-2011 1-2012 1-2013 1-2014 1-2015 1-2016
Single Family Condo/TIC/Coop
36 36
27
33
31
36
Single Family Condo/TIC/Coop
Year to Date
2014 2015 2016
+ 22.6%0.0%+ 39.1%- 34.3% - 8.3%+ 14.8%- 25.0% + 9.1%
2014 2015 2016 2014 2015 2016 2014 2015 2016
+ 9.4% - 7.7% - 20.0%- 16.2%
Inventory of Active Listings
Active Listings
Single
Family
Year-Over-Year
Change
Condo/TIC/
Coop
Year-Over-Year
Change
May-2015 387 +2.9% 502 -9.2%
Jun-2015 390 -7.6% 478 -16.4%
Jul-2015 399 -6.1% 480 -18.4%
Aug-2015 382 -4.0% 484 -7.3%
Sep-2015 471 -4.7% 668 +14.2%
Oct-2015 434 +0.9% 643 +13.8%
Nov-2015 354 +10.6% 526 +13.9%
Dec-2015 219 +4.3% 357 +28.9%
Jan-2016 283 +0.4% 473 +25.1%
Feb-2016 361 -0.3% 516 +18.1%
Mar-2016 394 +9.1% 591 +30.8%
Apr-2016 394 +9.7% 608 +22.8%
12-Month Avg* 372 +0.7% 527 +7.5%
Historical Inventory of Active Listings by Month
* Active Listings for all properties from May 2015 through April 2016. This is not the average of
the individual figures above.
Current as of May 11, 2016. All data from the San Francisco MLS. Report © 2016 ShowingTime. | 10
The number of properties available for sale in active status at the end of a given month.
337
516
359
495
394
608
Single Family Condo/TIC/Coop
April
200
400
600
800
1,000
1,200
1,400
1,600
1-2005 1-2006 1-2007 1-2008 1-2009 1-2010 1-2011 1-2012 1-2013 1-2014 1-2015 1-2016
Single Family Condo/TIC/Coop
2014 2015 2016
+ 22.8%- 4.1%+ 9.7%+ 6.5%
2014 2015 2016
- 24.1% - 22.1%
% of Properties Sold Over List Price
% of Properties
Sold Over List Price
Single
Family
Year-Over-Year
Change
Condo/TIC/
Coop
Year-Over-Year
Change
May-2015 83.4% -4.1% 76.6% +0.4%
Jun-2015 86.3% +9.0% 74.2% +7.2%
Jul-2015 84.3% -2.0% 73.9% +3.4%
Aug-2015 89.4% +10.9% 72.1% +4.0%
Sep-2015 88.4% +14.5% 71.8% +8.0%
Oct-2015 83.1% +0.8% 76.3% +10.1%
Nov-2015 77.5% -3.1% 69.9% +4.2%
Dec-2015 79.3% +7.9% 59.4% +7.0%
Jan-2016 76.2% +18.1% 53.7% -7.7%
Feb-2016 78.2% -4.9% 58.2% -11.6%
Mar-2016 82.8% +8.0% 68.1% -0.7%
Apr-2016 76.8% -8.0% 60.9% -14.5%
12-Month Avg 82.6% +3.0% 68.9% +1.1%
Historical % of Properties Sold Over List Price by Month
* % of Properties Sold Over List Price for all properties from May 2015 through April 2016. This is
not the average of the individual figures above.
Current as of May 11, 2016. All data from the San Francisco MLS. Report © 2016 ShowingTime. | 11
Percentage found when dividing the number of properties sold by properties sold over its original list price, not accounting for seller
concessions.
85.9%
69.9%
83.5%
71.2%
76.8%
60.9%
Single Family Condo/TIC/Coop
April
0.0%
20.0%
40.0%
60.0%
80.0%
100.0%
1-2005 1-2006 1-2007 1-2008 1-2009 1-2010 1-2011 1-2012 1-2013 1-2014 1-2015 1-2016
Single Family Condo/TIC/Coop
77.4%
65.6%
78.0%
67.0%
78.6%
61.3%
Single Family Condo/TIC/Coop
Year to Date
2014 2015 2016
- 14.5%+ 1.9%- 8.0%- 2.8% + 2.1%+ 0.8%+ 0.8% - 8.5%
2014 2015 2016 2014 2015 2016 2014 2015 2016
+ 7.9% + 5.3% + 11.4%+ 4.2%
% of List Price Received
% of List Price
Received
Single
Family
Year-Over-Year
Change
Condo/TIC/
Coop
Year-Over-Year
Change
May-2015 118.4% +2.3% 111.7% +2.4%
Jun-2015 117.1% +2.9% 110.1% +1.7%
Jul-2015 117.8% +3.2% 109.2% +1.0%
Aug-2015 117.3% +5.5% 108.7% +2.2%
Sep-2015 117.7% +5.5% 108.7% +3.3%
Oct-2015 114.5% +1.3% 109.3% +2.2%
Nov-2015 112.4% +1.0% 107.6% +1.1%
Dec-2015 112.3% +3.0% 104.3% +0.8%
Jan-2016 110.9% +2.8% 103.9% -1.0%
Feb-2016 112.8% -1.5% 106.0% -1.9%
Mar-2016 114.8% +1.0% 106.3% -3.0%
Apr-2016 113.8% -2.6% 105.3% -3.7%
12-Month Avg* 115.3% +2.1% 107.9% +0.5%
Historical % of List Price Received by Month
* % of List Price Received for all properties from May 2015 through April 2016. This is not the
average of the individual figures above.
Current as of May 11, 2016. All data from the San Francisco MLS. Report © 2016 ShowingTime. | 12
Percentage found when dividing a property’s sales price by its most recent list price, then taking the average for all properties sold in a given
month, not accounting for seller concessions.
115.1%
108.2%
116.8%
109.3%
113.8%
105.3%
Single Family Condo/TIC/Coop
April
111.6%
106.8%
113.9%
108.4%
113.3%
105.5%
Single Family Condo/TIC/Coop
Year to Date
95.0%
100.0%
105.0%
110.0%
115.0%
120.0%
1-2005 1-2006 1-2007 1-2008 1-2009 1-2010 1-2011 1-2012 1-2013 1-2014 1-2015 1-2016
Single Family Condo/TIC/Coop
2014 2015 2016
- 3.7%+ 1.0%- 2.6%+ 1.5%
2014 2015 2016
+ 3.1% + 2.5%
2014 2015 2016
- 2.7%+ 1.5%- 0.5%+ 2.1%
2014 2015 2016
+ 2.1% + 2.4%
Housing Affordability Ratio
Affordability Ratio
Single
Family
Year-Over-Year
Change
Condo/TIC/
Coop
Year-Over-Year
Change
May-2015 35 -16.7% 52 -7.1%
Jun-2015 37 -5.1% 51 -7.3%
Jul-2015 37 -11.9% 54 -1.8%
Aug-2015 39 -17.0% 53 -5.4%
Sep-2015 42 -4.5% 54 -5.3%
Oct-2015 38 -2.6% 51 -7.3%
Nov-2015 38 -7.3% 50 -3.8%
Dec-2015 40 -7.0% 51 -12.1%
Jan-2016 43 -15.7% 57 -9.5%
Feb-2016 38 -13.6% 56 +7.7%
Mar-2016 39 0.0% 55 +5.8%
Apr-2016 37 -2.6% 53 0.0%
12-Month Avg* 39 -12.4% 42 -4.3%
Historical Housing Affordability Ratio by Month
* Affordability Ratio for all properties from May 2015 through April 2016. This is not the average of
the individual figures above.
Current as of May 11, 2016. All data from the San Francisco MLS. Report © 2016 ShowingTime. | 13
This index measures housing affordability for the region. For example, an index of 120 means the median household income is 120% of what is
necessary to qualify for the median-priced home under prevailing interest rates. A higher number means greater affordability.
40
56
38
53
37
53
Single Family Condo/TIC/Coop
April
30
40
50
60
70
80
90
100
1-2005 1-2006 1-2007 1-2008 1-2009 1-2010 1-2011 1-2012 1-2013 1-2014 1-2015 1-2016
Single Family Condo/TIC/Coop
2014 2015 2016
0.0%- 5.4%- 2.6%- 5.0%
2014 2015 2016
- 20.0% - 17.6%
44
54
41
54
39
56
Single Family Condo/TIC/Coop
Year to Date
2014 2015 2016
+ 3.7%0.0%- 4.9%- 6.8%
2014 2015 2016
- 24.1% - 25.0%
Months Supply of Inventory
Months Supply
Single
Family
Year-Over-Year
Change
Condo/TIC/
Coop
Year-Over-Year
Change
May-2015 2.0 +11.1% 2.0 0.0%
Jun-2015 2.0 -4.8% 1.9 -9.5%
Jul-2015 2.0 -4.8% 1.9 -13.6%
Aug-2015 1.9 -5.0% 1.9 0.0%
Sep-2015 2.4 -4.0% 2.7 +22.7%
Oct-2015 2.2 +4.8% 2.6 +23.8%
Nov-2015 1.8 +12.5% 2.1 +16.7%
Dec-2015 1.1 0.0% 1.5 +36.4%
Jan-2016 1.5 +7.1% 2.0 +33.3%
Feb-2016 1.9 0.0% 2.1 +23.5%
Mar-2016 2.1 +16.7% 2.5 +38.9%
Apr-2016 2.1 +16.7% 2.6 +36.8%
12-Month Avg* 1.9 +4.2% 2.1 +16.6%
Historical Months Supply of Inventory by Month
* Months Supply for all properties from May 2015 through April 2016. This is not the average of
the individual figures above.
Current as of May 11, 2016. All data from the San Francisco MLS. Report © 2016 ShowingTime. | 14
The inventory of homes for sale at the end of a given month, divided by the average monthly pending sales from the last 12 months.
1.6
1.81.8 1.9
2.1
2.6
Single Family Condo/TIC/Coop
April
0.0
2.0
4.0
6.0
8.0
10.0
1-2005 1-2006 1-2007 1-2008 1-2009 1-2010 1-2011 1-2012 1-2013 1-2014 1-2015 1-2016
Single Family Condo/TIC/Coop
2014 2015 2016
+ 36.8%+ 5.6%+ 16.7%+ 12.5%
2014 2015 2016
- 23.8% - 28.0%
All Properties Activity Overview
Key metrics by report month and for year-to-date (YTD) starting from the first of the year.
Key Metrics Historical Sparkbars 4-2015 4-2016 Percent Change YTD 2015 YTD 2016 Percent Change
- 0.7%
Pending Sales 506 447 - 11.7% 1,638 1,461 - 10.8%
New Listings 605 563 - 6.9% 2,188 2,172
Sold Listings 506 413 - 18.4% 1,517 1,336 - 11.9%
Median Sales Price $1,210,000 $1,280,000 + 5.8% $1,110,000 $1,195,000 + 7.7%
+ 2.8%
34 + 9.7%
$1,454,135
-- --
Days on Market 27 35 + 29.6% 31
Avg. Sales Price $1,510,417 $1,572,198 + 4.1% $1,414,313
Active Listings 854 1,002 + 17.3% --
% of Properties Sold Over List Price 76.5% 68.5% - 10.5% 71.7%
41
68.6% - 4.3%
- 1.7%
42 + 2.4%
108.8%% of List Price Received 112.6% 109.4% - 2.8% 110.7%
Current as of May 11, 2016. All data from the San Francisco MLS. Report © 2016 ShowingTime. | 15
Months Supply 1.9 2.4 + 26.3% -- -- --
Affordability Ratio 38 39 + 2.6%
4-2013 4-2014 4-2015 4-2016
4-2013 4-2014 4-2015 4-2016
4-2013 4-2014 4-2015 4-2016
4-2013 4-2014 4-2015 4-2016
4-2013 4-2014 4-2015 4-2016
4-2013 4-2014 4-2015 4-2016
4-2013 4-2014 4-2015 4-2016
4-2013 4-2014 4-2015 4-2016
4-2013 4-2014 4-2015 4-2016
4-2013 4-2014 4-2015 4-2016
4-2013 4-2014 4-2015 4-2016
Activity by District
SF District 1: Northwest (Sea Cliff, Lake, Jordan Park / Laurel Heights, Outer Richmond, Central Richmond, Inner Richmond, Lone Mountain)
SF District 2: Central West (Outer Sunset, Central Sunset, Inner Sunset, Outer Parkside, Parkside, Inner Parkside, Golden Gate Heights)
SF District 3: Southwest (Pine Lake Park, Lake Shore, Merced Manor, Stonestown, Lakeside, Merced Heights, Ingleside, Ingleside Heights, Oceanview)
SF District 4: Twin Peaks W (Forest Hill (& Ext), W Portal, St Francis Wd, Balboa Terr, Mt Dav Manor, Ingleside Terr, Monterey Hts, Wstwd Pk & H'lnds, Shrwd Fst, Miraloma Pk, Dmnd Hts, Mdtwn Terr)
SF District 5: Central (Haight Ashbury, Cole Vly / Prnssus Hts, Clarndn Hts, Corona Hts, Twin Pks, Glen Pk, Noe Vly, Eureka Vly / Dolores Hts, Mission Dolores, Duboce Trngl, Buena Vista / Ashbury Hts)
SF District 6: Central North (Lower Pacific Heights, Anza Vista, Western Addition, North Panhandle, Alamo Square, Hayes Valley)
SF District 7: North (Marina, Cow Hollow, Presidio Heights, Pacific Heights)
SF District 8: Northeast (North Waterfront, North Beach, Russian Hill, Telegraph Hill, Nob Hill, Financial District / Barbary Coast, Downtown, Van Ness / Civic Center, Tenderloin)
SF District 9: Central East (Yerba Buena, South Beach, South of Market, Mission Bay, Inner Mission, Potrero Hill, Central Waterfront / Dogpatch, Bernal Heights)
SF District 10: Southeast (Outer Mission, Mission Terr, Excelsior, Portola, Bayview, Silver Terr, Hunters Pt, Candlestick Pt, Bayview Hts, Little Hollywood, Visitation Vly, Crocker Amazon)
4-2015 4-2016 + / – 4-2015 4-2016 + / – 4-2015 4-2016 + / – 4-2015 4-2016 + / – 4-2015 4-2016 + / –
Single Family
1 SF District 1 28 28 0.0% 25 22 -12.0% $1,800,000 $1,890,000 +5.0% 15 19 +26.7% 1.5 1.9 +26.7%
2 SF District 2 51 50 -2.0% 35 40 +14.3% $1,146,000 $1,200,000 +4.7% 23 26 +13.0% 1.4 1.4 0.0%
3 SF District 3 18 29 +61.1% 17 19 +11.8% $970,000 $1,050,000 +8.2% 21 33 +57.1% 1.3 1.9 +46.2%
4 SF District 4 42 45 +7.1% 29 28 -3.4% $1,250,455 $1,475,000 +18.0% 20 27 +35.0% 1.6 1.7 +6.3%
5 SF District 5 44 52 +18.2% 33 25 -24.2% $2,050,000 $2,250,000 +9.8% 17 32 +88.2% 1.7 2.2 +29.4%
6 SF District 6 5 8 +60.0% 4 4 0.0% $1,789,000 $1,300,000 -27.3% 25 52 +108.0% 1.6 2.5 +56.3%
7 SF District 7 29 39 +34.5% 10 13 +30.0% $5,252,500 $4,500,000 -14.3% 23 67 +191.3% 3.1 5.0 +61.3%
8 SF District 8 6 10 +66.7% 2 0 -100.0% $1,802,500 $0 -100.0% 10 0 -100.0% 2.9 4.7 +62.1%
9 SF District 9 34 48 +41.2% 25 16 -36.0% $1,440,000 $1,687,500 +17.2% 17 33 +94.1% 1.7 2.4 +41.2%
10 SF District 10 102 85 -16.7% 38 31 -18.4% $776,944 $850,000 +9.4% 40 33 -17.5% 2.4 2.2 -8.3%
Condo/TIC/Coop
1 SF District 1 24 29 +20.8% 8 8 0.0% $1,315,000 $889,000 -32.4% 32 37 +15.6% 1.8 2.2 +22.2%
2 SF District 2 6 10 +66.7% 6 4 -33.3% $957,500 $959,500 +0.2% 41 48 +17.1% 1.4 2.3 +64.3%
3 SF District 3 5 1 -80.0% 5 2 -60.0% $525,000 $664,000 +26.5% 12 21 +75.0% 1.2 0.2 -83.3%
4 SF District 4 12 6 -50.0% 6 3 -50.0% $1,010,500 $658,000 -34.9% 26 35 +34.6% 3.0 1.6 -46.7%
5 SF District 5 88 71 -19.3% 44 24 -45.5% $1,259,500 $1,380,000 +9.6% 18 26 +44.4% 2.3 2.1 -8.7%
6 SF District 6 45 69 +53.3% 20 16 -20.0% $1,135,000 $1,235,000 +8.8% 30 31 +3.3% 1.8 2.8 +55.6%
7 SF District 7 34 65 +91.2% 27 20 -25.9% $1,630,000 $1,348,750 -17.3% 24 25 +4.2% 1.3 3.3 +153.8%
8 SF District 8 85 93 +9.4% 50 50 0.0% $1,020,000 $1,095,000 +7.4% 42 31 -26.2% 2.1 2.3 +9.5%
9 SF District 9 169 245 +45.0% 111 85 -23.4% $1,025,000 $1,190,000 +16.1% 32 50 +56.3% 1.8 2.9 +61.1%
10 SF District 10 27 19 -29.6% 11 3 -72.7% $750,000 $985,000 +31.3% 46 55 +19.6% 5.2 3.4 -34.6%
Key metrics by report month for the districts of San Fransisco.
Current as of May 11, 2016. All data from the San Francisco MLS. Report © 2016 ShowingTime. | 16
Active Listings Sold Listings Median Sales Price Days on Market Months Supply

More Related Content

What's hot

San Francisco Market Focus April 2017
San Francisco Market Focus April 2017San Francisco Market Focus April 2017
San Francisco Market Focus April 2017Ronny Budiutama
 
San Francisco Market Focus June 2017
San Francisco Market Focus June 2017San Francisco Market Focus June 2017
San Francisco Market Focus June 2017Ronny Budiutama
 
San Francisco Market Focus May 2017
San Francisco Market Focus May 2017San Francisco Market Focus May 2017
San Francisco Market Focus May 2017Ronny Budiutama
 
San Francisco Market Focus March 2016
San Francisco Market Focus March 2016San Francisco Market Focus March 2016
San Francisco Market Focus March 2016Ronny Budiutama
 
San Francisco Market Focus February 2016
San Francisco Market Focus February 2016San Francisco Market Focus February 2016
San Francisco Market Focus February 2016Ronny Budiutama
 
San Francisco Market Focus February 2017
San Francisco Market Focus February 2017San Francisco Market Focus February 2017
San Francisco Market Focus February 2017Ronny Budiutama
 
San Francisco Market Focus April 2015
San Francisco Market Focus April 2015San Francisco Market Focus April 2015
San Francisco Market Focus April 2015Ronny Budiutama
 
San Francisco Market Focus June 2015
San Francisco Market Focus June 2015San Francisco Market Focus June 2015
San Francisco Market Focus June 2015Ronny Budiutama
 
San Francisco Market Focus August 2017
San Francisco Market Focus August 2017San Francisco Market Focus August 2017
San Francisco Market Focus August 2017Ronny Budiutama
 
San Francisco Market Focus May 2015
San Francisco Market Focus May 2015San Francisco Market Focus May 2015
San Francisco Market Focus May 2015Ronny Budiutama
 
San Francisco Market Focus December 2015
San Francisco Market Focus December 2015San Francisco Market Focus December 2015
San Francisco Market Focus December 2015Ronny Budiutama
 
San Francisco Market Focus October 2014
San Francisco Market Focus October 2014San Francisco Market Focus October 2014
San Francisco Market Focus October 2014Ronny Budiutama
 
San Francisco Market Focus Sept 2017
San Francisco Market Focus Sept 2017San Francisco Market Focus Sept 2017
San Francisco Market Focus Sept 2017Ronny Budiutama
 
San Francisco Market Focus January 2016
San Francisco Market Focus January 2016San Francisco Market Focus January 2016
San Francisco Market Focus January 2016Ronny Budiutama
 
San Francisco Market Focus May 2014
San Francisco Market Focus May 2014San Francisco Market Focus May 2014
San Francisco Market Focus May 2014Ronny Budiutama
 
San Francisco Market Focus March 2014
San Francisco Market Focus March 2014San Francisco Market Focus March 2014
San Francisco Market Focus March 2014Ronny Budiutama
 
San Francisco Market Focus July 2017
San Francisco Market Focus July 2017San Francisco Market Focus July 2017
San Francisco Market Focus July 2017Ronny Budiutama
 
San Francisco Market Focus March 2017
San Francisco Market Focus March 2017San Francisco Market Focus March 2017
San Francisco Market Focus March 2017Ronny Budiutama
 
San Francisco Real Estate Housing Market January 2017
San Francisco Real Estate Housing Market January 2017San Francisco Real Estate Housing Market January 2017
San Francisco Real Estate Housing Market January 2017Ronny Budiutama
 
San Francisco Market Focus November 2016
San Francisco Market Focus November 2016San Francisco Market Focus November 2016
San Francisco Market Focus November 2016Ronny Budiutama
 

What's hot (20)

San Francisco Market Focus April 2017
San Francisco Market Focus April 2017San Francisco Market Focus April 2017
San Francisco Market Focus April 2017
 
San Francisco Market Focus June 2017
San Francisco Market Focus June 2017San Francisco Market Focus June 2017
San Francisco Market Focus June 2017
 
San Francisco Market Focus May 2017
San Francisco Market Focus May 2017San Francisco Market Focus May 2017
San Francisco Market Focus May 2017
 
San Francisco Market Focus March 2016
San Francisco Market Focus March 2016San Francisco Market Focus March 2016
San Francisco Market Focus March 2016
 
San Francisco Market Focus February 2016
San Francisco Market Focus February 2016San Francisco Market Focus February 2016
San Francisco Market Focus February 2016
 
San Francisco Market Focus February 2017
San Francisco Market Focus February 2017San Francisco Market Focus February 2017
San Francisco Market Focus February 2017
 
San Francisco Market Focus April 2015
San Francisco Market Focus April 2015San Francisco Market Focus April 2015
San Francisco Market Focus April 2015
 
San Francisco Market Focus June 2015
San Francisco Market Focus June 2015San Francisco Market Focus June 2015
San Francisco Market Focus June 2015
 
San Francisco Market Focus August 2017
San Francisco Market Focus August 2017San Francisco Market Focus August 2017
San Francisco Market Focus August 2017
 
San Francisco Market Focus May 2015
San Francisco Market Focus May 2015San Francisco Market Focus May 2015
San Francisco Market Focus May 2015
 
San Francisco Market Focus December 2015
San Francisco Market Focus December 2015San Francisco Market Focus December 2015
San Francisco Market Focus December 2015
 
San Francisco Market Focus October 2014
San Francisco Market Focus October 2014San Francisco Market Focus October 2014
San Francisco Market Focus October 2014
 
San Francisco Market Focus Sept 2017
San Francisco Market Focus Sept 2017San Francisco Market Focus Sept 2017
San Francisco Market Focus Sept 2017
 
San Francisco Market Focus January 2016
San Francisco Market Focus January 2016San Francisco Market Focus January 2016
San Francisco Market Focus January 2016
 
San Francisco Market Focus May 2014
San Francisco Market Focus May 2014San Francisco Market Focus May 2014
San Francisco Market Focus May 2014
 
San Francisco Market Focus March 2014
San Francisco Market Focus March 2014San Francisco Market Focus March 2014
San Francisco Market Focus March 2014
 
San Francisco Market Focus July 2017
San Francisco Market Focus July 2017San Francisco Market Focus July 2017
San Francisco Market Focus July 2017
 
San Francisco Market Focus March 2017
San Francisco Market Focus March 2017San Francisco Market Focus March 2017
San Francisco Market Focus March 2017
 
San Francisco Real Estate Housing Market January 2017
San Francisco Real Estate Housing Market January 2017San Francisco Real Estate Housing Market January 2017
San Francisco Real Estate Housing Market January 2017
 
San Francisco Market Focus November 2016
San Francisco Market Focus November 2016San Francisco Market Focus November 2016
San Francisco Market Focus November 2016
 

Viewers also liked

Practica n 3
Practica n 3Practica n 3
Practica n 3Rn Cast
 
BCAA Poster 492 Design XXV
BCAA Poster 492 Design XXVBCAA Poster 492 Design XXV
BCAA Poster 492 Design XXVAndrea Rapp
 
2015 November Newsletter
2015 November Newsletter2015 November Newsletter
2015 November NewsletterAndrea Rapp
 
22.06.2015 Xanadu mines: Driving ahead in a copper hotspot, Dr. Andrew Stewart
22.06.2015 Xanadu mines: Driving ahead in a copper hotspot, Dr. Andrew Stewart 22.06.2015 Xanadu mines: Driving ahead in a copper hotspot, Dr. Andrew Stewart
22.06.2015 Xanadu mines: Driving ahead in a copper hotspot, Dr. Andrew Stewart The Business Council of Mongolia
 
DC resume 07-2016 - Copy
DC resume 07-2016 - CopyDC resume 07-2016 - Copy
DC resume 07-2016 - CopyDavid Craig
 
Is codes related to earthquake
Is codes related to earthquakeIs codes related to earthquake
Is codes related to earthquakeNeeraj Chourasia
 
San francisco residential apr 2011 apr 2013
San francisco residential apr 2011   apr 2013San francisco residential apr 2011   apr 2013
San francisco residential apr 2011 apr 2013Ronny Budiutama
 
Санхүүгийн аудитын тайлан
Санхүүгийн аудитын тайланСанхүүгийн аудитын тайлан
Санхүүгийн аудитын тайланChuka Davaanyam
 
History Lecture 1 Renaissance
History Lecture 1 RenaissanceHistory Lecture 1 Renaissance
History Lecture 1 RenaissanceSiddharth Khanna
 
9. Эсрэг утгатай үг
9. Эсрэг утгатай үг9. Эсрэг утгатай үг
9. Эсрэг утгатай үгoyunaadorj
 

Viewers also liked (12)

Practica n 3
Practica n 3Practica n 3
Practica n 3
 
BCAA Poster 492 Design XXV
BCAA Poster 492 Design XXVBCAA Poster 492 Design XXV
BCAA Poster 492 Design XXV
 
2015 November Newsletter
2015 November Newsletter2015 November Newsletter
2015 November Newsletter
 
Karen Resume 2015
Karen Resume 2015Karen Resume 2015
Karen Resume 2015
 
22.06.2015 Xanadu mines: Driving ahead in a copper hotspot, Dr. Andrew Stewart
22.06.2015 Xanadu mines: Driving ahead in a copper hotspot, Dr. Andrew Stewart 22.06.2015 Xanadu mines: Driving ahead in a copper hotspot, Dr. Andrew Stewart
22.06.2015 Xanadu mines: Driving ahead in a copper hotspot, Dr. Andrew Stewart
 
DC resume 07-2016 - Copy
DC resume 07-2016 - CopyDC resume 07-2016 - Copy
DC resume 07-2016 - Copy
 
Is codes related to earthquake
Is codes related to earthquakeIs codes related to earthquake
Is codes related to earthquake
 
tema 5
tema 5tema 5
tema 5
 
San francisco residential apr 2011 apr 2013
San francisco residential apr 2011   apr 2013San francisco residential apr 2011   apr 2013
San francisco residential apr 2011 apr 2013
 
Санхүүгийн аудитын тайлан
Санхүүгийн аудитын тайланСанхүүгийн аудитын тайлан
Санхүүгийн аудитын тайлан
 
History Lecture 1 Renaissance
History Lecture 1 RenaissanceHistory Lecture 1 Renaissance
History Lecture 1 Renaissance
 
9. Эсрэг утгатай үг
9. Эсрэг утгатай үг9. Эсрэг утгатай үг
9. Эсрэг утгатай үг
 

Similar to SF Housing Market Remains Strong in April 2016

San Francisco Market Focus September 2015
San Francisco Market Focus September 2015San Francisco Market Focus September 2015
San Francisco Market Focus September 2015Ronny Budiutama
 
San Francisco Market Focus March 2018
San Francisco Market Focus March 2018San Francisco Market Focus March 2018
San Francisco Market Focus March 2018Ronny Budiutama
 
San Francisco Market Focus February 2015
San Francisco Market Focus February 2015San Francisco Market Focus February 2015
San Francisco Market Focus February 2015Ronny Budiutama
 
San Francisco Market Focus Report May
San Francisco Market Focus Report MaySan Francisco Market Focus Report May
San Francisco Market Focus Report MayRonny Budiutama
 
San Francisco Market Focus August 2017
San Francisco Market Focus August 2017San Francisco Market Focus August 2017
San Francisco Market Focus August 2017Ronny Budiutama
 
San Francisco Market Focus July 2015
San Francisco Market Focus July 2015San Francisco Market Focus July 2015
San Francisco Market Focus July 2015Ronny Budiutama
 
San Francisco Market Focus Report July
San Francisco Market Focus Report JulySan Francisco Market Focus Report July
San Francisco Market Focus Report JulyRonny Budiutama
 
San Francisco Market Report March 2021
San Francisco Market Report March 2021San Francisco Market Report March 2021
San Francisco Market Report March 2021Ronny Budiutama
 
San Francisco Market Focus Report May 2019
San Francisco Market Focus Report May 2019San Francisco Market Focus Report May 2019
San Francisco Market Focus Report May 2019Ronny Budiutama
 
San Francisco Market Focus Report October 2018
San Francisco Market Focus Report October 2018San Francisco Market Focus Report October 2018
San Francisco Market Focus Report October 2018Ronny Budiutama
 
San Francisco Market Focus April 2018
San Francisco Market Focus April 2018San Francisco Market Focus April 2018
San Francisco Market Focus April 2018Ronny Budiutama
 
San Francisco Market Focus October 2015
San Francisco Market Focus October 2015San Francisco Market Focus October 2015
San Francisco Market Focus October 2015Ronny Budiutama
 

Similar to SF Housing Market Remains Strong in April 2016 (12)

San Francisco Market Focus September 2015
San Francisco Market Focus September 2015San Francisco Market Focus September 2015
San Francisco Market Focus September 2015
 
San Francisco Market Focus March 2018
San Francisco Market Focus March 2018San Francisco Market Focus March 2018
San Francisco Market Focus March 2018
 
San Francisco Market Focus February 2015
San Francisco Market Focus February 2015San Francisco Market Focus February 2015
San Francisco Market Focus February 2015
 
San Francisco Market Focus Report May
San Francisco Market Focus Report MaySan Francisco Market Focus Report May
San Francisco Market Focus Report May
 
San Francisco Market Focus August 2017
San Francisco Market Focus August 2017San Francisco Market Focus August 2017
San Francisco Market Focus August 2017
 
San Francisco Market Focus July 2015
San Francisco Market Focus July 2015San Francisco Market Focus July 2015
San Francisco Market Focus July 2015
 
San Francisco Market Focus Report July
San Francisco Market Focus Report JulySan Francisco Market Focus Report July
San Francisco Market Focus Report July
 
San Francisco Market Report March 2021
San Francisco Market Report March 2021San Francisco Market Report March 2021
San Francisco Market Report March 2021
 
San Francisco Market Focus Report May 2019
San Francisco Market Focus Report May 2019San Francisco Market Focus Report May 2019
San Francisco Market Focus Report May 2019
 
San Francisco Market Focus Report October 2018
San Francisco Market Focus Report October 2018San Francisco Market Focus Report October 2018
San Francisco Market Focus Report October 2018
 
San Francisco Market Focus April 2018
San Francisco Market Focus April 2018San Francisco Market Focus April 2018
San Francisco Market Focus April 2018
 
San Francisco Market Focus October 2015
San Francisco Market Focus October 2015San Francisco Market Focus October 2015
San Francisco Market Focus October 2015
 

More from Ronny Budiutama

San Francisco January 2024 Market Report
San Francisco January 2024 Market ReportSan Francisco January 2024 Market Report
San Francisco January 2024 Market ReportRonny Budiutama
 
San Francisco December 2023 Market Report
San Francisco December 2023 Market ReportSan Francisco December 2023 Market Report
San Francisco December 2023 Market ReportRonny Budiutama
 
San Francisco November 2023 Market Report
San Francisco November 2023 Market ReportSan Francisco November 2023 Market Report
San Francisco November 2023 Market ReportRonny Budiutama
 
2023 Annual San Francisco Housing Market
2023 Annual San Francisco Housing Market2023 Annual San Francisco Housing Market
2023 Annual San Francisco Housing MarketRonny Budiutama
 
October 2023 Report: San Francisco Real Estate Market Insights
October 2023 Report: San Francisco Real Estate Market InsightsOctober 2023 Report: San Francisco Real Estate Market Insights
October 2023 Report: San Francisco Real Estate Market InsightsRonny Budiutama
 
CA Weekly MLS Market Data Report - August 2023
CA Weekly MLS Market Data Report - August 2023CA Weekly MLS Market Data Report - August 2023
CA Weekly MLS Market Data Report - August 2023Ronny Budiutama
 
San Francisco Market Report July 2023.pdf
San Francisco Market Report July 2023.pdfSan Francisco Market Report July 2023.pdf
San Francisco Market Report July 2023.pdfRonny Budiutama
 
San Francisco May 2023 Market Report.pdf
San Francisco May 2023 Market Report.pdfSan Francisco May 2023 Market Report.pdf
San Francisco May 2023 Market Report.pdfRonny Budiutama
 
San Francisco June 2023 Market Report.pdf
San Francisco June 2023 Market Report.pdfSan Francisco June 2023 Market Report.pdf
San Francisco June 2023 Market Report.pdfRonny Budiutama
 
San Francisco Market Report March 2023.pdf
San Francisco Market Report March 2023.pdfSan Francisco Market Report March 2023.pdf
San Francisco Market Report March 2023.pdfRonny Budiutama
 
San Francisco Market Report February 2023
San Francisco Market Report February 2023San Francisco Market Report February 2023
San Francisco Market Report February 2023Ronny Budiutama
 
San Francisco Market Report January 2023.pdf
San Francisco Market Report January 2023.pdfSan Francisco Market Report January 2023.pdf
San Francisco Market Report January 2023.pdfRonny Budiutama
 
Annual Report on the San Francisco County Housing Market.pdf
Annual Report on the San Francisco County Housing Market.pdfAnnual Report on the San Francisco County Housing Market.pdf
Annual Report on the San Francisco County Housing Market.pdfRonny Budiutama
 
San Francisco Market Report December 2022.pdf
San Francisco Market Report December 2022.pdfSan Francisco Market Report December 2022.pdf
San Francisco Market Report December 2022.pdfRonny Budiutama
 
San Francisco Market Report November 2022.pdf
San Francisco Market Report November 2022.pdfSan Francisco Market Report November 2022.pdf
San Francisco Market Report November 2022.pdfRonny Budiutama
 
San Francisco Market Report October 2022.pdf
San Francisco Market Report October 2022.pdfSan Francisco Market Report October 2022.pdf
San Francisco Market Report October 2022.pdfRonny Budiutama
 
San Francisco Market Report September 2022.pdf
San Francisco Market Report September 2022.pdfSan Francisco Market Report September 2022.pdf
San Francisco Market Report September 2022.pdfRonny Budiutama
 
San Francisco Market Report August 2022.pdf
San Francisco Market Report August 2022.pdfSan Francisco Market Report August 2022.pdf
San Francisco Market Report August 2022.pdfRonny Budiutama
 
San Francisco Market Report July 2022.pdf
San Francisco Market Report July 2022.pdfSan Francisco Market Report July 2022.pdf
San Francisco Market Report July 2022.pdfRonny Budiutama
 
San Francisco Market Report June 2022.pdf
San Francisco Market Report June 2022.pdfSan Francisco Market Report June 2022.pdf
San Francisco Market Report June 2022.pdfRonny Budiutama
 

More from Ronny Budiutama (20)

San Francisco January 2024 Market Report
San Francisco January 2024 Market ReportSan Francisco January 2024 Market Report
San Francisco January 2024 Market Report
 
San Francisco December 2023 Market Report
San Francisco December 2023 Market ReportSan Francisco December 2023 Market Report
San Francisco December 2023 Market Report
 
San Francisco November 2023 Market Report
San Francisco November 2023 Market ReportSan Francisco November 2023 Market Report
San Francisco November 2023 Market Report
 
2023 Annual San Francisco Housing Market
2023 Annual San Francisco Housing Market2023 Annual San Francisco Housing Market
2023 Annual San Francisco Housing Market
 
October 2023 Report: San Francisco Real Estate Market Insights
October 2023 Report: San Francisco Real Estate Market InsightsOctober 2023 Report: San Francisco Real Estate Market Insights
October 2023 Report: San Francisco Real Estate Market Insights
 
CA Weekly MLS Market Data Report - August 2023
CA Weekly MLS Market Data Report - August 2023CA Weekly MLS Market Data Report - August 2023
CA Weekly MLS Market Data Report - August 2023
 
San Francisco Market Report July 2023.pdf
San Francisco Market Report July 2023.pdfSan Francisco Market Report July 2023.pdf
San Francisco Market Report July 2023.pdf
 
San Francisco May 2023 Market Report.pdf
San Francisco May 2023 Market Report.pdfSan Francisco May 2023 Market Report.pdf
San Francisco May 2023 Market Report.pdf
 
San Francisco June 2023 Market Report.pdf
San Francisco June 2023 Market Report.pdfSan Francisco June 2023 Market Report.pdf
San Francisco June 2023 Market Report.pdf
 
San Francisco Market Report March 2023.pdf
San Francisco Market Report March 2023.pdfSan Francisco Market Report March 2023.pdf
San Francisco Market Report March 2023.pdf
 
San Francisco Market Report February 2023
San Francisco Market Report February 2023San Francisco Market Report February 2023
San Francisco Market Report February 2023
 
San Francisco Market Report January 2023.pdf
San Francisco Market Report January 2023.pdfSan Francisco Market Report January 2023.pdf
San Francisco Market Report January 2023.pdf
 
Annual Report on the San Francisco County Housing Market.pdf
Annual Report on the San Francisco County Housing Market.pdfAnnual Report on the San Francisco County Housing Market.pdf
Annual Report on the San Francisco County Housing Market.pdf
 
San Francisco Market Report December 2022.pdf
San Francisco Market Report December 2022.pdfSan Francisco Market Report December 2022.pdf
San Francisco Market Report December 2022.pdf
 
San Francisco Market Report November 2022.pdf
San Francisco Market Report November 2022.pdfSan Francisco Market Report November 2022.pdf
San Francisco Market Report November 2022.pdf
 
San Francisco Market Report October 2022.pdf
San Francisco Market Report October 2022.pdfSan Francisco Market Report October 2022.pdf
San Francisco Market Report October 2022.pdf
 
San Francisco Market Report September 2022.pdf
San Francisco Market Report September 2022.pdfSan Francisco Market Report September 2022.pdf
San Francisco Market Report September 2022.pdf
 
San Francisco Market Report August 2022.pdf
San Francisco Market Report August 2022.pdfSan Francisco Market Report August 2022.pdf
San Francisco Market Report August 2022.pdf
 
San Francisco Market Report July 2022.pdf
San Francisco Market Report July 2022.pdfSan Francisco Market Report July 2022.pdf
San Francisco Market Report July 2022.pdf
 
San Francisco Market Report June 2022.pdf
San Francisco Market Report June 2022.pdfSan Francisco Market Report June 2022.pdf
San Francisco Market Report June 2022.pdf
 

Recently uploaded

Everything you ever Wanted to Know about Florida Property Tax Exemptions.pdf
Everything you ever Wanted to Know about Florida Property Tax Exemptions.pdfEverything you ever Wanted to Know about Florida Property Tax Exemptions.pdf
Everything you ever Wanted to Know about Florida Property Tax Exemptions.pdfTim Wilmath
 
Covid 19 and Market Impact during the Pandemic
Covid 19 and Market Impact during the PandemicCovid 19 and Market Impact during the Pandemic
Covid 19 and Market Impact during the PandemicTim Wilmath
 
MADHUGIRI FARM LAND BROCHURES (11)_compressed (1).pdf
MADHUGIRI FARM LAND BROCHURES (11)_compressed (1).pdfMADHUGIRI FARM LAND BROCHURES (11)_compressed (1).pdf
MADHUGIRI FARM LAND BROCHURES (11)_compressed (1).pdfknoxdigital1
 
LCAR Unit 22 - Leasing and Property Management - 14th Edition Revised.pptx
LCAR Unit 22 - Leasing and Property Management - 14th Edition Revised.pptxLCAR Unit 22 - Leasing and Property Management - 14th Edition Revised.pptx
LCAR Unit 22 - Leasing and Property Management - 14th Edition Revised.pptxTom Blefko
 
Experion Elements Sector 45 Noida_Brochure.pdf.pdf
Experion Elements Sector 45 Noida_Brochure.pdf.pdfExperion Elements Sector 45 Noida_Brochure.pdf.pdf
Experion Elements Sector 45 Noida_Brochure.pdf.pdfkratirudram
 
Low Rate Call Girls in Triveni Complex Delhi Call 9990771857
Low Rate Call Girls in Triveni Complex Delhi Call 9990771857Low Rate Call Girls in Triveni Complex Delhi Call 9990771857
Low Rate Call Girls in Triveni Complex Delhi Call 9990771857delhimodel235
 
Eco-Efficient Living: Redefining Sustainability through Leech's Green Design ...
Eco-Efficient Living: Redefining Sustainability through Leech's Green Design ...Eco-Efficient Living: Redefining Sustainability through Leech's Green Design ...
Eco-Efficient Living: Redefining Sustainability through Leech's Green Design ...Newman George Leech
 
Provident Solitaire Park Square Kanakapura Road, Bangalore E- Brochure.pdf
Provident Solitaire Park Square Kanakapura Road, Bangalore E- Brochure.pdfProvident Solitaire Park Square Kanakapura Road, Bangalore E- Brochure.pdf
Provident Solitaire Park Square Kanakapura Road, Bangalore E- Brochure.pdffaheemali990101
 
Managed Farmland Brochures to get more in
Managed Farmland Brochures to get more inManaged Farmland Brochures to get more in
Managed Farmland Brochures to get more inknoxdigital1
 
Pride Wonderland Dhanori Pune Brochure.pdf
Pride Wonderland Dhanori Pune Brochure.pdfPride Wonderland Dhanori Pune Brochure.pdf
Pride Wonderland Dhanori Pune Brochure.pdfabbu831446
 
Partner With the Golden Life Community for Single Women Over 55
Partner With the Golden Life Community for Single Women Over 55Partner With the Golden Life Community for Single Women Over 55
Partner With the Golden Life Community for Single Women Over 55Ron Surz
 
Affordable and Quality Construction SVTN's Signature Blend of Cost-Efficiency...
Affordable and Quality Construction SVTN's Signature Blend of Cost-Efficiency...Affordable and Quality Construction SVTN's Signature Blend of Cost-Efficiency...
Affordable and Quality Construction SVTN's Signature Blend of Cost-Efficiency...AditiAlishetty
 
Rustomjee The Panorama At Pali Hill, Bandra West, Mumbai - Brochure.pdf
Rustomjee The Panorama At Pali Hill, Bandra West, Mumbai - Brochure.pdfRustomjee The Panorama At Pali Hill, Bandra West, Mumbai - Brochure.pdf
Rustomjee The Panorama At Pali Hill, Bandra West, Mumbai - Brochure.pdfmonikasharma630
 
SVN Live 4.22.24 Weekly Property Broadcast
SVN Live 4.22.24 Weekly Property BroadcastSVN Live 4.22.24 Weekly Property Broadcast
SVN Live 4.22.24 Weekly Property BroadcastSVN International Corp.
 
Choose Noida's Leading Architect
Choose    Noida's    Leading   ArchitectChoose    Noida's    Leading   Architect
Choose Noida's Leading ArchitectMM Design Studio
 
Call Girls in Pitampura Delhi 💯Call Us 🔝8264348440🔝
Call Girls in Pitampura Delhi 💯Call Us 🔝8264348440🔝Call Girls in Pitampura Delhi 💯Call Us 🔝8264348440🔝
Call Girls in Pitampura Delhi 💯Call Us 🔝8264348440🔝soniya singh
 
The Role of Mortgage Brokers in Retirement Housing: Key Considerations
The Role of Mortgage Brokers in Retirement Housing: Key ConsiderationsThe Role of Mortgage Brokers in Retirement Housing: Key Considerations
The Role of Mortgage Brokers in Retirement Housing: Key Considerationssunlite Mortgage
 

Recently uploaded (20)

Everything you ever Wanted to Know about Florida Property Tax Exemptions.pdf
Everything you ever Wanted to Know about Florida Property Tax Exemptions.pdfEverything you ever Wanted to Know about Florida Property Tax Exemptions.pdf
Everything you ever Wanted to Know about Florida Property Tax Exemptions.pdf
 
Covid 19 and Market Impact during the Pandemic
Covid 19 and Market Impact during the PandemicCovid 19 and Market Impact during the Pandemic
Covid 19 and Market Impact during the Pandemic
 
MADHUGIRI FARM LAND BROCHURES (11)_compressed (1).pdf
MADHUGIRI FARM LAND BROCHURES (11)_compressed (1).pdfMADHUGIRI FARM LAND BROCHURES (11)_compressed (1).pdf
MADHUGIRI FARM LAND BROCHURES (11)_compressed (1).pdf
 
LCAR Unit 22 - Leasing and Property Management - 14th Edition Revised.pptx
LCAR Unit 22 - Leasing and Property Management - 14th Edition Revised.pptxLCAR Unit 22 - Leasing and Property Management - 14th Edition Revised.pptx
LCAR Unit 22 - Leasing and Property Management - 14th Edition Revised.pptx
 
Experion Elements Sector 45 Noida_Brochure.pdf.pdf
Experion Elements Sector 45 Noida_Brochure.pdf.pdfExperion Elements Sector 45 Noida_Brochure.pdf.pdf
Experion Elements Sector 45 Noida_Brochure.pdf.pdf
 
Low Rate Call Girls in Triveni Complex Delhi Call 9990771857
Low Rate Call Girls in Triveni Complex Delhi Call 9990771857Low Rate Call Girls in Triveni Complex Delhi Call 9990771857
Low Rate Call Girls in Triveni Complex Delhi Call 9990771857
 
9953056974 Low Rate Call Girls In Saket, Delhi NCR
9953056974 Low Rate Call Girls In Saket, Delhi NCR9953056974 Low Rate Call Girls In Saket, Delhi NCR
9953056974 Low Rate Call Girls In Saket, Delhi NCR
 
young call girls in Lajpat Nagar,🔝 9953056974 🔝 escort Service
young call girls in Lajpat Nagar,🔝 9953056974 🔝 escort Serviceyoung call girls in Lajpat Nagar,🔝 9953056974 🔝 escort Service
young call girls in Lajpat Nagar,🔝 9953056974 🔝 escort Service
 
Eco-Efficient Living: Redefining Sustainability through Leech's Green Design ...
Eco-Efficient Living: Redefining Sustainability through Leech's Green Design ...Eco-Efficient Living: Redefining Sustainability through Leech's Green Design ...
Eco-Efficient Living: Redefining Sustainability through Leech's Green Design ...
 
Provident Solitaire Park Square Kanakapura Road, Bangalore E- Brochure.pdf
Provident Solitaire Park Square Kanakapura Road, Bangalore E- Brochure.pdfProvident Solitaire Park Square Kanakapura Road, Bangalore E- Brochure.pdf
Provident Solitaire Park Square Kanakapura Road, Bangalore E- Brochure.pdf
 
Managed Farmland Brochures to get more in
Managed Farmland Brochures to get more inManaged Farmland Brochures to get more in
Managed Farmland Brochures to get more in
 
Pride Wonderland Dhanori Pune Brochure.pdf
Pride Wonderland Dhanori Pune Brochure.pdfPride Wonderland Dhanori Pune Brochure.pdf
Pride Wonderland Dhanori Pune Brochure.pdf
 
Partner With the Golden Life Community for Single Women Over 55
Partner With the Golden Life Community for Single Women Over 55Partner With the Golden Life Community for Single Women Over 55
Partner With the Golden Life Community for Single Women Over 55
 
Affordable and Quality Construction SVTN's Signature Blend of Cost-Efficiency...
Affordable and Quality Construction SVTN's Signature Blend of Cost-Efficiency...Affordable and Quality Construction SVTN's Signature Blend of Cost-Efficiency...
Affordable and Quality Construction SVTN's Signature Blend of Cost-Efficiency...
 
Rustomjee The Panorama At Pali Hill, Bandra West, Mumbai - Brochure.pdf
Rustomjee The Panorama At Pali Hill, Bandra West, Mumbai - Brochure.pdfRustomjee The Panorama At Pali Hill, Bandra West, Mumbai - Brochure.pdf
Rustomjee The Panorama At Pali Hill, Bandra West, Mumbai - Brochure.pdf
 
SVN Live 4.22.24 Weekly Property Broadcast
SVN Live 4.22.24 Weekly Property BroadcastSVN Live 4.22.24 Weekly Property Broadcast
SVN Live 4.22.24 Weekly Property Broadcast
 
Hot call girls in Moti Bagh🔝 9953056974 🔝 escort Service
Hot call girls in Moti Bagh🔝 9953056974 🔝 escort ServiceHot call girls in Moti Bagh🔝 9953056974 🔝 escort Service
Hot call girls in Moti Bagh🔝 9953056974 🔝 escort Service
 
Choose Noida's Leading Architect
Choose    Noida's    Leading   ArchitectChoose    Noida's    Leading   Architect
Choose Noida's Leading Architect
 
Call Girls in Pitampura Delhi 💯Call Us 🔝8264348440🔝
Call Girls in Pitampura Delhi 💯Call Us 🔝8264348440🔝Call Girls in Pitampura Delhi 💯Call Us 🔝8264348440🔝
Call Girls in Pitampura Delhi 💯Call Us 🔝8264348440🔝
 
The Role of Mortgage Brokers in Retirement Housing: Key Considerations
The Role of Mortgage Brokers in Retirement Housing: Key ConsiderationsThe Role of Mortgage Brokers in Retirement Housing: Key Considerations
The Role of Mortgage Brokers in Retirement Housing: Key Considerations
 

SF Housing Market Remains Strong in April 2016

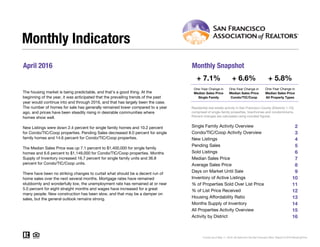
  • 1. April 2016 Monthly Snapshot One-Year Change in One-Year Change in Median Sales Price Single Family Median Sales Price Condo/TIC/Coop 2 3 4 5 6 7 8 9 10 11 12 13 14 15 16 Current as of May 11, 2016. All data from the San Francisco MLS. Report © 2016 ShowingTime. Condo/TIC/Coop Activity Overview Inventory of Active Listings % of Properties Sold Over List Price % of List Price Received Housing Affordability Ratio All Properties Activity Overview New Listings Pending Sales Sold Listings Median Sales Price Average Sales Price Days on Market Until Sale Activity by District Monthly Indicators + 7.1% + 6.6% + 5.8% One-Year Change in The housing market is being predictable, and that's a good thing. At the beginning of the year, it was anticipated that the prevailing trends of the past year would continue into and through 2016, and that has largely been the case. The number of homes for sale has generally remained lower compared to a year ago, and prices have been steadily rising in desirable communities where homes show well. New Listings were down 2.4 percent for single family homes and 10.2 percent for Condo/TIC/Coop properties. Pending Sales decreased 8.0 percent for single family homes and 14.6 percent for Condo/TIC/Coop properties. The Median Sales Price was up 7.1 percent to $1,400,000 for single family homes and 6.6 percent to $1,149,000 for Condo/TIC/Coop properties. Months Supply of Inventory increased 16.7 percent for single family units and 36.8 percent for Condo/TIC/Coop units. There have been no striking changes to curtail what should be a decent run of home sales over the next several months. Mortgage rates have remained stubbornly and wonderfully low, the unemployment rate has remained at or near 5.0 percent for eight straight months and wages have increased for a great many people. New construction has been slow, and that may be a damper on sales, but the general outlook remains strong. Median Sales Price All Property Types Residential real estate activity in San Francisco County (Districts 1-10), comprised of single-family properties, townhomes and condominiums. Percent changes are calculated using rounded figures. Single Family Activity Overview Months Supply of Inventory
  • 2. Single Family Activity Overview Key metrics by report month and for year-to-date (YTD) starting from the first of the year. Key Metrics Historical Sparkbars 4-2015 4-2016 Percent Change YTD 2015 YTD 2016 Percent Change - 5.2%890 561 - 13.2% $1,350,000 + 11.7% + 5.2% Pending Sales 226 208 - 8.0% - 11.1%705 627 New Listings 251 245 - 2.4% 939 Sold Listings 218 198 - 9.2% 646 Median Sales Price $1,307,500 $1,400,000 + 7.1% $1,209,000 31 + 14.8% $1,719,533 -- -- Days on Market 23 32 + 39.1% 27 Avg. Sales Price $1,765,744 $1,794,963 + 1.7% $1,634,882 Active Listings 359 394 + 9.7% -- % of Properties Sold Over List Price 83.5% 76.8% - 8.0% 78.0% 41 78.6% + 0.8% - 0.5% 39 - 4.9% 113.3%% of List Price Received 116.8% 113.8% - 2.6% 113.9% Current as of May 11, 2016. All data from the San Francisco MLS. Report © 2016 ShowingTime. | 2 Months Supply 1.8 2.1 + 16.7% -- -- -- Affordability Ratio 38 37 - 2.6% 4-2013 4-2014 4-2015 4-2016 4-2013 4-2014 4-2015 4-2016 4-2013 4-2014 4-2015 4-2016 4-2013 4-2014 4-2015 4-2016 4-2013 4-2014 4-2015 4-2016 4-2013 4-2014 4-2015 4-2016 4-2013 4-2014 4-2015 4-2016 4-2013 4-2014 4-2015 4-2016 4-2013 4-2014 4-2015 4-2016 4-2013 4-2014 4-2015 4-2016 4-2013 4-2014 4-2015 4-2016
  • 3. Condo/TIC/Coop Activity Overview Key metrics by report month and for year-to-date (YTD) starting from the first of the year. Key Metrics Historical Sparkbars 4-2015 4-2016 Percent Change YTD 2015 YTD 2016 Percent Change + 2.6% Pending Sales 280 239 - 14.6% 933 834 - 10.6% New Listings 354 318 - 10.2% 1,249 1,282 Sold Listings 288 215 - 25.3% 871 775 - 11.0% Median Sales Price $1,077,500 $1,149,000 + 6.6% $1,060,000 $1,100,000 + 3.8% + 0.9% 36 + 9.1% $1,262,021 -- -- Days on Market 31 38 + 22.6% 33 Avg. Sales Price $1,317,148 $1,367,048 + 3.8% $1,250,723 Active Listings 495 608 + 22.8% -- % of Properties Sold Over List Price 71.2% 60.9% - 14.5% 67.0% 54 61.3% - 8.5% - 2.7% 56 + 3.7% 105.5%% of List Price Received 109.3% 105.3% - 3.7% 108.4% Current as of May 11, 2016. All data from the San Francisco MLS. Report © 2016 ShowingTime. | 3 Months Supply 1.9 2.6 + 36.8% -- -- -- Affordability Ratio 53 53 0.0% 4-2013 4-2014 4-2015 4-2016 4-2013 4-2014 4-2015 4-2016 4-2013 4-2014 4-2015 4-2016 4-2013 4-2014 4-2015 4-2016 4-2013 4-2014 4-2015 4-2016 4-2013 4-2014 4-2015 4-2016 4-2013 4-2014 4-2015 4-2016 4-2013 4-2014 4-2015 4-2016 4-2013 4-2014 4-2015 4-2016 4-2013 4-2014 4-2015 4-2016 4-2013 4-2014 4-2015 4-2016
  • 4. New Listings New Listings Single Family Year-Over-Year Change Condo/TIC/ Coop Year-Over-Year Change May-2015 259 -5.8% 335 -6.2% Jun-2015 252 -9.0% 312 -13.1% Jul-2015 255 -4.1% 294 -17.4% Aug-2015 234 +3.5% 286 +4.8% Sep-2015 324 -7.4% 438 +12.6% Oct-2015 263 +5.2% 318 -5.1% Nov-2015 143 +11.7% 194 +16.2% Dec-2015 66 -15.4% 120 +9.1% Jan-2016 178 -10.6% 286 +7.1% Feb-2016 221 -7.1% 323 +9.1% Mar-2016 246 -2.0% 355 +6.9% Apr-2016 245 -2.4% 318 -10.2% 12-Month Avg 224 -3.7% 298 -0.4% Historical New Listings by Month Current as of May 11, 2016. All data from the San Francisco MLS. Report © 2016 ShowingTime. | 4 A count of the properties that have been newly listed on the market in a given month. 241 367 251 354 245 318 Single Family Condo/TIC/Coop April 0 100 200 300 400 500 600 700 1-2005 1-2006 1-2007 1-2008 1-2009 1-2010 1-2011 1-2012 1-2013 1-2014 1-2015 1-2016 Single Family Condo/TIC/Coop 874 1,307 939 1,249 890 1,282 Single Family Condo/TIC/Coop Year to Date 2014 2015 2016 - 10.2%- 3.5%- 2.4%+ 4.1% - 4.4%- 5.2%+ 7.4% + 2.6% 2014 2015 2016 2014 2015 2016 2014 2015 2016 - 19.7% - 9.8% - 6.2%- 7.3%
  • 5. Pending Sales Pending Sales Single Family Year-Over-Year Change Condo/TIC/ Coop Year-Over-Year Change May-2015 209 -2.3% 291 -1.7% Jun-2015 220 +10.0% 294 -4.2% Jul-2015 209 -7.9% 255 -6.9% Aug-2015 205 +0.5% 231 -13.2% Sep-2015 199 -6.6% 217 -19.0% Oct-2015 265 -0.7% 283 -6.0% Nov-2015 175 -16.7% 239 +9.6% Dec-2015 131 -3.7% 176 -15.4% Jan-2016 99 -9.2% 140 -6.0% Feb-2016 125 -9.4% 228 +7.0% Mar-2016 195 -15.9% 227 -22.0% Apr-2016 208 -8.0% 239 -14.6% 12-Month Avg 187 -5.7% 235 -8.2% Historical Pending Sales by Month Current as of May 11, 2016. All data from the San Francisco MLS. Report © 2016 ShowingTime. | 5 A count of the properties on which offers have been accepted in a given month. 207 293 226 280 208 239 Single Family Condo/TIC/Coop April 0 100 200 300 400 1-2005 1-2006 1-2007 1-2008 1-2009 1-2010 1-2011 1-2012 1-2013 1-2014 1-2015 1-2016 Single Family Condo/TIC/Coop 721 1,022 705 933 627 834 Single Family Condo/TIC/Coop Year to Date 2014 2015 2016 - 14.6%- 4.4%- 8.0%+ 9.2% - 8.7%- 11.1%- 2.2% - 10.6% 2014 2015 2016 2014 2015 2016 2014 2015 2016 - 14.1% - 4.5% + 2.1%- 5.2%
  • 6. Sold Listings Sold Listings Single Family Year-Over-Year Change Condo/TIC/ Coop Year-Over-Year Change May-2015 205 -10.9% 286 -3.1% Jun-2015 219 +14.1% 291 +1.7% Jul-2015 236 +3.5% 272 -1.8% Aug-2015 198 -6.2% 229 -20.2% Sep-2015 164 -16.8% 181 -27.0% Oct-2015 243 -12.6% 266 -16.6% Nov-2015 187 -7.0% 206 -4.6% Dec-2015 208 +6.1% 283 +24.7% Jan-2016 105 -4.5% 147 -7.0% Feb-2016 101 -21.7% 165 +2.5% Mar-2016 157 -16.9% 248 -6.1% Apr-2016 198 -9.2% 215 -25.3% 12-Month Avg 185 -6.6% 232 -7.8% Historical Sold Listings by Month Current as of May 11, 2016. All data from the San Francisco MLS. Report © 2016 ShowingTime. | 6 A count of the actual sales that closed in a given month. 206 326 218 288 198 215 Single Family Condo/TIC/Coop April 0 100 200 300 400 1-2005 1-2006 1-2007 1-2008 1-2009 1-2010 1-2011 1-2012 1-2013 1-2014 1-2015 1-2016 Single Family Condo/TIC/Coop 673 994 646 871 561 775 Single Family Condo/TIC/Coop Year to Date 2014 2015 2016 - 25.3%- 11.7%- 9.2%+ 5.8% - 12.4%- 13.2%- 4.0% - 11.0% 2014 2015 2016 2014 2015 2016 2014 2015 2016 - 6.8% - 6.3% + 6.2%+ 7.2%
  • 7. Median Sales Price Median Sales Price Single Family Year-Over-Year Change Condo/TIC/ Coop Year-Over-Year Change May-2015 $1,400,000 +28.4% $1,112,500 +18.4% Jun-2015 $1,300,000 +10.6% $1,100,000 +15.2% Jul-2015 $1,280,000 +18.4% $1,033,509 +8.8% Aug-2015 $1,225,444 +26.6% $1,045,000 +12.4% Sep-2015 $1,155,000 +11.6% $1,040,000 +13.7% Oct-2015 $1,270,000 +6.7% $1,100,000 +15.2% Nov-2015 $1,275,000 +13.2% $1,125,000 +10.3% Dec-2015 $1,201,500 +12.1% $1,098,000 +18.7% Jan-2016 $1,175,000 +20.5% $1,040,000 +15.6% Feb-2016 $1,400,000 +25.6% $1,095,000 -0.5% Mar-2016 $1,355,000 +8.4% $1,100,000 0.0% Apr-2016 $1,400,000 +7.1% $1,149,000 +6.6% 12-Month Avg* $1,280,000 +14.8% $1,100,000 +12.4% Historical Median Sales Price by Month * Median Sales Price for all properties from May 2015 through April 2016. This is not the average of the individual figures above. Current as of May 11, 2016. All data from the San Francisco MLS. Report © 2016 ShowingTime. | 7 Point at which half of the sales sold for more and half sold for less, not accounting for seller concessions, in a given month. $1,100,000 $905,000 $1,307,500 $1,077,500 $1,400,000 $1,149,000 Single Family Condo/TIC/Coop April $400,000 $600,000 $800,000 $1,000,000 $1,200,000 $1,400,000 $1,600,000 1-2005 1-2006 1-2007 1-2008 1-2009 1-2010 1-2011 1-2012 1-2013 1-2014 1-2015 1-2016 Single Family Condo/TIC/Coop $1,000,800 $935,000 $1,209,000 $1,060,000 $1,350,000 $1,100,000 Single Family Condo/TIC/Coop Year to Date 2014 2015 2016 + 6.6%+ 19.1%+ 7.1%+ 18.9% + 13.4%+ 11.7%+ 20.8% + 3.8% 2014 2015 2016 2014 2015 2016 2014 2015 2016 + 10.0% + 15.7% + 16.9%+ 7.1%
  • 8. Average Sales Price Avg. Sales Price Single Family Year-Over-Year Change Condo/TIC/ Coop Year-Over-Year Change May-2015 $1,839,795 +26.1% $1,329,588 +14.6% Jun-2015 $1,776,727 +11.2% $1,298,673 +11.4% Jul-2015 $1,657,986 +17.9% $1,214,445 +11.0% Aug-2015 $1,505,629 +13.5% $1,159,211 +6.2% Sep-2015 $1,390,736 +5.6% $1,166,494 +14.9% Oct-2015 $1,627,981 -2.5% $1,184,400 +11.0% Nov-2015 $1,704,450 +16.7% $1,262,796 +12.6% Dec-2015 $1,497,221 +11.8% $1,249,856 +9.2% Jan-2016 $1,573,224 +23.0% $1,166,245 +6.6% Feb-2016 $1,618,843 +4.4% $1,210,302 +0.5% Mar-2016 $1,787,032 +2.2% $1,262,150 -2.9% Apr-2016 $1,794,963 +1.7% $1,367,048 +3.8% 12-Month Avg* $1,654,279 +10.0% $1,244,913 +8.4% Historical Average Sales Price by Month * Avg. Sales Price for all properties from May 2015 through April 2016. This is not the average of the individual figures above. Current as of May 11, 2016. All data from the San Francisco MLS. Report © 2016 ShowingTime. | 8 Average sales price for all closed sales, not accounting for seller concessions, in a given month. $1,512,204 $1,112,733 $1,765,744 $1,317,148 $1,794,963 $1,367,048 Single Family Condo/TIC/Coop April $600,000 $800,000 $1,000,000 $1,200,000 $1,400,000 $1,600,000 $1,800,000 $2,000,000 1-2005 1-2006 1-2007 1-2008 1-2009 1-2010 1-2011 1-2012 1-2013 1-2014 1-2015 1-2016 Single Family Condo/TIC/Coop $1,414,935 $1,071,236 $1,634,882 $1,250,723 $1,719,533 $1,262,021 Single Family Condo/TIC/Coop Year to Date 2014 2015 2016 + 3.8%+ 18.4%+ 1.7%+ 16.8% + 16.8%+ 5.2%+ 15.5% + 0.9% 2014 2015 2016 2014 2015 2016 2014 2015 2016 + 11.4% + 15.5% + 16.0%+ 14.3%
  • 9. Days on Market Until Sale Days on Market Single Family Year-Over-Year Change Condo/TIC/ Coop Year-Over-Year Change May-2015 23 -4.2% 28 0.0% Jun-2015 28 +3.7% 26 -21.2% Jul-2015 25 -16.7% 29 -12.1% Aug-2015 28 +3.7% 29 -12.1% Sep-2015 27 +3.8% 34 -8.1% Oct-2015 25 -16.7% 26 -29.7% Nov-2015 28 -9.7% 34 -10.5% Dec-2015 33 -15.4% 43 -8.5% Jan-2016 40 -7.0% 44 -10.2% Feb-2016 31 +10.7% 35 +20.7% Mar-2016 25 +4.2% 30 +7.1% Apr-2016 32 +39.1% 38 +22.6% 12-Month Avg* 28 -2.1% 32 -6.9% Historical Days on Market Until Sale by Month * Days on Market for all properties from May 2015 through April 2016. This is not the average of the individual figures above. Current as of May 11, 2016. All data from the San Francisco MLS. Report © 2016 ShowingTime. | 9 Average number of days between when a property is listed and when an offer is accepted in a given month. 35 31 23 3132 38 Single Family Condo/TIC/Coop April 20 40 60 80 100 120 1-2005 1-2006 1-2007 1-2008 1-2009 1-2010 1-2011 1-2012 1-2013 1-2014 1-2015 1-2016 Single Family Condo/TIC/Coop 36 36 27 33 31 36 Single Family Condo/TIC/Coop Year to Date 2014 2015 2016 + 22.6%0.0%+ 39.1%- 34.3% - 8.3%+ 14.8%- 25.0% + 9.1% 2014 2015 2016 2014 2015 2016 2014 2015 2016 + 9.4% - 7.7% - 20.0%- 16.2%
  • 10. Inventory of Active Listings Active Listings Single Family Year-Over-Year Change Condo/TIC/ Coop Year-Over-Year Change May-2015 387 +2.9% 502 -9.2% Jun-2015 390 -7.6% 478 -16.4% Jul-2015 399 -6.1% 480 -18.4% Aug-2015 382 -4.0% 484 -7.3% Sep-2015 471 -4.7% 668 +14.2% Oct-2015 434 +0.9% 643 +13.8% Nov-2015 354 +10.6% 526 +13.9% Dec-2015 219 +4.3% 357 +28.9% Jan-2016 283 +0.4% 473 +25.1% Feb-2016 361 -0.3% 516 +18.1% Mar-2016 394 +9.1% 591 +30.8% Apr-2016 394 +9.7% 608 +22.8% 12-Month Avg* 372 +0.7% 527 +7.5% Historical Inventory of Active Listings by Month * Active Listings for all properties from May 2015 through April 2016. This is not the average of the individual figures above. Current as of May 11, 2016. All data from the San Francisco MLS. Report © 2016 ShowingTime. | 10 The number of properties available for sale in active status at the end of a given month. 337 516 359 495 394 608 Single Family Condo/TIC/Coop April 200 400 600 800 1,000 1,200 1,400 1,600 1-2005 1-2006 1-2007 1-2008 1-2009 1-2010 1-2011 1-2012 1-2013 1-2014 1-2015 1-2016 Single Family Condo/TIC/Coop 2014 2015 2016 + 22.8%- 4.1%+ 9.7%+ 6.5% 2014 2015 2016 - 24.1% - 22.1%
  • 11. % of Properties Sold Over List Price % of Properties Sold Over List Price Single Family Year-Over-Year Change Condo/TIC/ Coop Year-Over-Year Change May-2015 83.4% -4.1% 76.6% +0.4% Jun-2015 86.3% +9.0% 74.2% +7.2% Jul-2015 84.3% -2.0% 73.9% +3.4% Aug-2015 89.4% +10.9% 72.1% +4.0% Sep-2015 88.4% +14.5% 71.8% +8.0% Oct-2015 83.1% +0.8% 76.3% +10.1% Nov-2015 77.5% -3.1% 69.9% +4.2% Dec-2015 79.3% +7.9% 59.4% +7.0% Jan-2016 76.2% +18.1% 53.7% -7.7% Feb-2016 78.2% -4.9% 58.2% -11.6% Mar-2016 82.8% +8.0% 68.1% -0.7% Apr-2016 76.8% -8.0% 60.9% -14.5% 12-Month Avg 82.6% +3.0% 68.9% +1.1% Historical % of Properties Sold Over List Price by Month * % of Properties Sold Over List Price for all properties from May 2015 through April 2016. This is not the average of the individual figures above. Current as of May 11, 2016. All data from the San Francisco MLS. Report © 2016 ShowingTime. | 11 Percentage found when dividing the number of properties sold by properties sold over its original list price, not accounting for seller concessions. 85.9% 69.9% 83.5% 71.2% 76.8% 60.9% Single Family Condo/TIC/Coop April 0.0% 20.0% 40.0% 60.0% 80.0% 100.0% 1-2005 1-2006 1-2007 1-2008 1-2009 1-2010 1-2011 1-2012 1-2013 1-2014 1-2015 1-2016 Single Family Condo/TIC/Coop 77.4% 65.6% 78.0% 67.0% 78.6% 61.3% Single Family Condo/TIC/Coop Year to Date 2014 2015 2016 - 14.5%+ 1.9%- 8.0%- 2.8% + 2.1%+ 0.8%+ 0.8% - 8.5% 2014 2015 2016 2014 2015 2016 2014 2015 2016 + 7.9% + 5.3% + 11.4%+ 4.2%
  • 12. % of List Price Received % of List Price Received Single Family Year-Over-Year Change Condo/TIC/ Coop Year-Over-Year Change May-2015 118.4% +2.3% 111.7% +2.4% Jun-2015 117.1% +2.9% 110.1% +1.7% Jul-2015 117.8% +3.2% 109.2% +1.0% Aug-2015 117.3% +5.5% 108.7% +2.2% Sep-2015 117.7% +5.5% 108.7% +3.3% Oct-2015 114.5% +1.3% 109.3% +2.2% Nov-2015 112.4% +1.0% 107.6% +1.1% Dec-2015 112.3% +3.0% 104.3% +0.8% Jan-2016 110.9% +2.8% 103.9% -1.0% Feb-2016 112.8% -1.5% 106.0% -1.9% Mar-2016 114.8% +1.0% 106.3% -3.0% Apr-2016 113.8% -2.6% 105.3% -3.7% 12-Month Avg* 115.3% +2.1% 107.9% +0.5% Historical % of List Price Received by Month * % of List Price Received for all properties from May 2015 through April 2016. This is not the average of the individual figures above. Current as of May 11, 2016. All data from the San Francisco MLS. Report © 2016 ShowingTime. | 12 Percentage found when dividing a property’s sales price by its most recent list price, then taking the average for all properties sold in a given month, not accounting for seller concessions. 115.1% 108.2% 116.8% 109.3% 113.8% 105.3% Single Family Condo/TIC/Coop April 111.6% 106.8% 113.9% 108.4% 113.3% 105.5% Single Family Condo/TIC/Coop Year to Date 95.0% 100.0% 105.0% 110.0% 115.0% 120.0% 1-2005 1-2006 1-2007 1-2008 1-2009 1-2010 1-2011 1-2012 1-2013 1-2014 1-2015 1-2016 Single Family Condo/TIC/Coop 2014 2015 2016 - 3.7%+ 1.0%- 2.6%+ 1.5% 2014 2015 2016 + 3.1% + 2.5% 2014 2015 2016 - 2.7%+ 1.5%- 0.5%+ 2.1% 2014 2015 2016 + 2.1% + 2.4%
  • 13. Housing Affordability Ratio Affordability Ratio Single Family Year-Over-Year Change Condo/TIC/ Coop Year-Over-Year Change May-2015 35 -16.7% 52 -7.1% Jun-2015 37 -5.1% 51 -7.3% Jul-2015 37 -11.9% 54 -1.8% Aug-2015 39 -17.0% 53 -5.4% Sep-2015 42 -4.5% 54 -5.3% Oct-2015 38 -2.6% 51 -7.3% Nov-2015 38 -7.3% 50 -3.8% Dec-2015 40 -7.0% 51 -12.1% Jan-2016 43 -15.7% 57 -9.5% Feb-2016 38 -13.6% 56 +7.7% Mar-2016 39 0.0% 55 +5.8% Apr-2016 37 -2.6% 53 0.0% 12-Month Avg* 39 -12.4% 42 -4.3% Historical Housing Affordability Ratio by Month * Affordability Ratio for all properties from May 2015 through April 2016. This is not the average of the individual figures above. Current as of May 11, 2016. All data from the San Francisco MLS. Report © 2016 ShowingTime. | 13 This index measures housing affordability for the region. For example, an index of 120 means the median household income is 120% of what is necessary to qualify for the median-priced home under prevailing interest rates. A higher number means greater affordability. 40 56 38 53 37 53 Single Family Condo/TIC/Coop April 30 40 50 60 70 80 90 100 1-2005 1-2006 1-2007 1-2008 1-2009 1-2010 1-2011 1-2012 1-2013 1-2014 1-2015 1-2016 Single Family Condo/TIC/Coop 2014 2015 2016 0.0%- 5.4%- 2.6%- 5.0% 2014 2015 2016 - 20.0% - 17.6% 44 54 41 54 39 56 Single Family Condo/TIC/Coop Year to Date 2014 2015 2016 + 3.7%0.0%- 4.9%- 6.8% 2014 2015 2016 - 24.1% - 25.0%
  • 14. Months Supply of Inventory Months Supply Single Family Year-Over-Year Change Condo/TIC/ Coop Year-Over-Year Change May-2015 2.0 +11.1% 2.0 0.0% Jun-2015 2.0 -4.8% 1.9 -9.5% Jul-2015 2.0 -4.8% 1.9 -13.6% Aug-2015 1.9 -5.0% 1.9 0.0% Sep-2015 2.4 -4.0% 2.7 +22.7% Oct-2015 2.2 +4.8% 2.6 +23.8% Nov-2015 1.8 +12.5% 2.1 +16.7% Dec-2015 1.1 0.0% 1.5 +36.4% Jan-2016 1.5 +7.1% 2.0 +33.3% Feb-2016 1.9 0.0% 2.1 +23.5% Mar-2016 2.1 +16.7% 2.5 +38.9% Apr-2016 2.1 +16.7% 2.6 +36.8% 12-Month Avg* 1.9 +4.2% 2.1 +16.6% Historical Months Supply of Inventory by Month * Months Supply for all properties from May 2015 through April 2016. This is not the average of the individual figures above. Current as of May 11, 2016. All data from the San Francisco MLS. Report © 2016 ShowingTime. | 14 The inventory of homes for sale at the end of a given month, divided by the average monthly pending sales from the last 12 months. 1.6 1.81.8 1.9 2.1 2.6 Single Family Condo/TIC/Coop April 0.0 2.0 4.0 6.0 8.0 10.0 1-2005 1-2006 1-2007 1-2008 1-2009 1-2010 1-2011 1-2012 1-2013 1-2014 1-2015 1-2016 Single Family Condo/TIC/Coop 2014 2015 2016 + 36.8%+ 5.6%+ 16.7%+ 12.5% 2014 2015 2016 - 23.8% - 28.0%
  • 15. All Properties Activity Overview Key metrics by report month and for year-to-date (YTD) starting from the first of the year. Key Metrics Historical Sparkbars 4-2015 4-2016 Percent Change YTD 2015 YTD 2016 Percent Change - 0.7% Pending Sales 506 447 - 11.7% 1,638 1,461 - 10.8% New Listings 605 563 - 6.9% 2,188 2,172 Sold Listings 506 413 - 18.4% 1,517 1,336 - 11.9% Median Sales Price $1,210,000 $1,280,000 + 5.8% $1,110,000 $1,195,000 + 7.7% + 2.8% 34 + 9.7% $1,454,135 -- -- Days on Market 27 35 + 29.6% 31 Avg. Sales Price $1,510,417 $1,572,198 + 4.1% $1,414,313 Active Listings 854 1,002 + 17.3% -- % of Properties Sold Over List Price 76.5% 68.5% - 10.5% 71.7% 41 68.6% - 4.3% - 1.7% 42 + 2.4% 108.8%% of List Price Received 112.6% 109.4% - 2.8% 110.7% Current as of May 11, 2016. All data from the San Francisco MLS. Report © 2016 ShowingTime. | 15 Months Supply 1.9 2.4 + 26.3% -- -- -- Affordability Ratio 38 39 + 2.6% 4-2013 4-2014 4-2015 4-2016 4-2013 4-2014 4-2015 4-2016 4-2013 4-2014 4-2015 4-2016 4-2013 4-2014 4-2015 4-2016 4-2013 4-2014 4-2015 4-2016 4-2013 4-2014 4-2015 4-2016 4-2013 4-2014 4-2015 4-2016 4-2013 4-2014 4-2015 4-2016 4-2013 4-2014 4-2015 4-2016 4-2013 4-2014 4-2015 4-2016 4-2013 4-2014 4-2015 4-2016
  • 16. Activity by District SF District 1: Northwest (Sea Cliff, Lake, Jordan Park / Laurel Heights, Outer Richmond, Central Richmond, Inner Richmond, Lone Mountain) SF District 2: Central West (Outer Sunset, Central Sunset, Inner Sunset, Outer Parkside, Parkside, Inner Parkside, Golden Gate Heights) SF District 3: Southwest (Pine Lake Park, Lake Shore, Merced Manor, Stonestown, Lakeside, Merced Heights, Ingleside, Ingleside Heights, Oceanview) SF District 4: Twin Peaks W (Forest Hill (& Ext), W Portal, St Francis Wd, Balboa Terr, Mt Dav Manor, Ingleside Terr, Monterey Hts, Wstwd Pk & H'lnds, Shrwd Fst, Miraloma Pk, Dmnd Hts, Mdtwn Terr) SF District 5: Central (Haight Ashbury, Cole Vly / Prnssus Hts, Clarndn Hts, Corona Hts, Twin Pks, Glen Pk, Noe Vly, Eureka Vly / Dolores Hts, Mission Dolores, Duboce Trngl, Buena Vista / Ashbury Hts) SF District 6: Central North (Lower Pacific Heights, Anza Vista, Western Addition, North Panhandle, Alamo Square, Hayes Valley) SF District 7: North (Marina, Cow Hollow, Presidio Heights, Pacific Heights) SF District 8: Northeast (North Waterfront, North Beach, Russian Hill, Telegraph Hill, Nob Hill, Financial District / Barbary Coast, Downtown, Van Ness / Civic Center, Tenderloin) SF District 9: Central East (Yerba Buena, South Beach, South of Market, Mission Bay, Inner Mission, Potrero Hill, Central Waterfront / Dogpatch, Bernal Heights) SF District 10: Southeast (Outer Mission, Mission Terr, Excelsior, Portola, Bayview, Silver Terr, Hunters Pt, Candlestick Pt, Bayview Hts, Little Hollywood, Visitation Vly, Crocker Amazon) 4-2015 4-2016 + / – 4-2015 4-2016 + / – 4-2015 4-2016 + / – 4-2015 4-2016 + / – 4-2015 4-2016 + / – Single Family 1 SF District 1 28 28 0.0% 25 22 -12.0% $1,800,000 $1,890,000 +5.0% 15 19 +26.7% 1.5 1.9 +26.7% 2 SF District 2 51 50 -2.0% 35 40 +14.3% $1,146,000 $1,200,000 +4.7% 23 26 +13.0% 1.4 1.4 0.0% 3 SF District 3 18 29 +61.1% 17 19 +11.8% $970,000 $1,050,000 +8.2% 21 33 +57.1% 1.3 1.9 +46.2% 4 SF District 4 42 45 +7.1% 29 28 -3.4% $1,250,455 $1,475,000 +18.0% 20 27 +35.0% 1.6 1.7 +6.3% 5 SF District 5 44 52 +18.2% 33 25 -24.2% $2,050,000 $2,250,000 +9.8% 17 32 +88.2% 1.7 2.2 +29.4% 6 SF District 6 5 8 +60.0% 4 4 0.0% $1,789,000 $1,300,000 -27.3% 25 52 +108.0% 1.6 2.5 +56.3% 7 SF District 7 29 39 +34.5% 10 13 +30.0% $5,252,500 $4,500,000 -14.3% 23 67 +191.3% 3.1 5.0 +61.3% 8 SF District 8 6 10 +66.7% 2 0 -100.0% $1,802,500 $0 -100.0% 10 0 -100.0% 2.9 4.7 +62.1% 9 SF District 9 34 48 +41.2% 25 16 -36.0% $1,440,000 $1,687,500 +17.2% 17 33 +94.1% 1.7 2.4 +41.2% 10 SF District 10 102 85 -16.7% 38 31 -18.4% $776,944 $850,000 +9.4% 40 33 -17.5% 2.4 2.2 -8.3% Condo/TIC/Coop 1 SF District 1 24 29 +20.8% 8 8 0.0% $1,315,000 $889,000 -32.4% 32 37 +15.6% 1.8 2.2 +22.2% 2 SF District 2 6 10 +66.7% 6 4 -33.3% $957,500 $959,500 +0.2% 41 48 +17.1% 1.4 2.3 +64.3% 3 SF District 3 5 1 -80.0% 5 2 -60.0% $525,000 $664,000 +26.5% 12 21 +75.0% 1.2 0.2 -83.3% 4 SF District 4 12 6 -50.0% 6 3 -50.0% $1,010,500 $658,000 -34.9% 26 35 +34.6% 3.0 1.6 -46.7% 5 SF District 5 88 71 -19.3% 44 24 -45.5% $1,259,500 $1,380,000 +9.6% 18 26 +44.4% 2.3 2.1 -8.7% 6 SF District 6 45 69 +53.3% 20 16 -20.0% $1,135,000 $1,235,000 +8.8% 30 31 +3.3% 1.8 2.8 +55.6% 7 SF District 7 34 65 +91.2% 27 20 -25.9% $1,630,000 $1,348,750 -17.3% 24 25 +4.2% 1.3 3.3 +153.8% 8 SF District 8 85 93 +9.4% 50 50 0.0% $1,020,000 $1,095,000 +7.4% 42 31 -26.2% 2.1 2.3 +9.5% 9 SF District 9 169 245 +45.0% 111 85 -23.4% $1,025,000 $1,190,000 +16.1% 32 50 +56.3% 1.8 2.9 +61.1% 10 SF District 10 27 19 -29.6% 11 3 -72.7% $750,000 $985,000 +31.3% 46 55 +19.6% 5.2 3.4 -34.6% Key metrics by report month for the districts of San Fransisco. Current as of May 11, 2016. All data from the San Francisco MLS. Report © 2016 ShowingTime. | 16 Active Listings Sold Listings Median Sales Price Days on Market Months Supply