1. Zicklin School of Business, Baruch College, City University of New York
CIS 4800 – Systems Analysis and Design
Spring 2002, Prof. R. Benbunan-Fich
System Architect ® Quick Guide to DFD
Start the System Architect® program, by going through Start | Programs | System
Architect Student Edition | System Architect 2001.
The SA 2001 window is divided in three parts. The upper left corner is the browse
window, the lower left corner is the browse detail and the right side is the drawing
workspace. The browse window is organized in tab sheets. The All Methods (All) sheet is
displayed by default in the browse window.
This tutorial assumes that you have some basic familiarity with the SA 2001 software,
toolbar and features. The objective of this guide is to help you draw a set of Data Flow
Diagrams (context level, level-0 and level-1) and show you how to check their
completeness and correctness.
Part I: Drawing a Context DFD
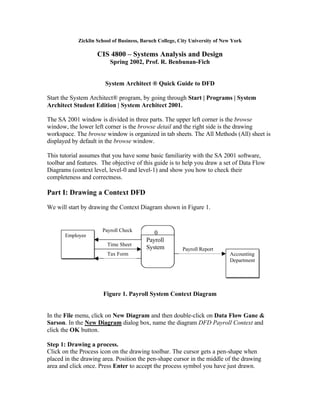
We will start by drawing the Context Diagram shown in Figure 1.
Payroll Check
Employee 0
Payroll
Time Sheet
System Payroll Report
Tax Form Accounting
Department
Figure 1. Payroll System Context Diagram
In the File menu, click on New Diagram and then double-click on Data Flow Gane &
Sarson. In the New Diagram dialog box, name the diagram DFD Payroll Context and
click the OK button.
Step 1: Drawing a process.
Click on the Process icon on the drawing toolbar. The cursor gets a pen-shape when
placed in the drawing area. Position the pen-shape cursor in the middle of the drawing
area and click once. Press Enter to accept the process symbol you have just drawn.
2. Right click on the symbol, select Edit… and enter the name and the number of your
process. Type the name Payroll System in the name window of the Model Object dialog
box. Then select the symbol tab and enter the number of the process. Since this is a
context diagram you should enter 0 as the number for the process. Click the OK button
when done.
Click on the Select Mode icon (leftmost arrow) on the drawing toolbar to get back the
standard cursor.
Step 2: Drawing External Entities
Click on the External Entity icon on the drawing toolbar. Position the pen-shape cursor to
the left of the process and click once. Press Enter to accept the External Entity. Right
click on this symbol and select Edit… from the pop-up menu. Name your external entity
Employee (you can leave the description area empty). Click OK when done.
Repeat these steps to generate another External Entity to the right of the Payroll System
process and name it Accounting Department.
Step 3: Drawing Data Flows
1. Click on the Data Flow icon on the drawing toolbar. To draw the “time sheet”
data flow, click once on the origin of the data flow (External Entity Employee)
and drag the cursor to the destination of the data flow (Payroll System Process).
Release the cursor on the destination of the data flow to draw the arrow.
2. Press Enter to accept the symbol you have just drawn. The Associative
Properties dialog box will appear. Check that the boxes To and From contain the
correct origin and destination of the data flow. If one of these boxes is empty, the
data flow will not be properly associated with the other symbols of the diagram.
Click OK to close the dialog box, even if the associations are not correct. If one
of the associations is missing, get the standard cursor back and re-attach the loose
end to the corresponding symbol. To make sure that the attachment has
succeeded, right click on the arrow and select Associative… from the pop-up
menu.
3. Right click on the name of the data flow and select Edit… from the pop-up menu.
Name the data flow Time Sheet. Instead of Edit… you can select Symbol
Rename and enter the name of your data flow.
Repeat the three-steps described above to draw the remaining data flows of the context
diagram. If you like to reshape any data flow (e.g. reduce the number of corners), use the
standard cursor and click once on the arrow you want to modify. Drag the corners (small
black squares) until you achieve the desired shape for the line.
Step 4: Saving your Context Diagram
You can save your work by pressing CTRL+S or by going through the File menu, Save
Diagram option. In either case, click on Yes when asked to confirm.
3. Part II: Drawing a Level 0 Data Flow Diagram
Now we will draw the Level 0 diagram of the Payroll system (see Figure 2).
Employee 1 2
Create Compute
Time Sheet Weekly Hrs. Worked Weekly
Payroll Paycheck
Record
Payroll Paycheck
Paycheck
Data
3 Accounting
Deduction Data Department
Prepare Payroll report
Payroll
Summary
Tax Form 4
Prepare
Employee
Tax Form
Erroneous Data Flow
Figure 2. Level 0 Data Flow Diagram
Please note that the Diagram presented in Figure 2 has two mistakes. The Data Flow
labeled “Hrs. Worked” is pointing in the wrong direction and there is an extra arrow
(labeled “Erroneous Data Flow” connecting two external entities). In this tutorial, you
will learn how to detect and correct these mistakes.
Step 1: Attaching a child diagram to its parent.
Start System Architect®, click on the plus sign (+) next to Diagrams in the browser
window and click on the plus sign (+) next to Data Flow Gane & Sarson. Double click on
DFD Payroll Context to open the diagram in the drawing window.
Select the process “Payroll System” by clicking on it once. Right click and select Child
Create from the pop-up menu. Name the system “Payroll System Level 0” and click OK.
The Leveling Data dialog box will appear, with the following message:
4. In the child diagram, which of the following materials should be included?
Image of parent symbol
Line/flows attached to parent
Symbols attached to lines/flows
These three options will be checked by default. Unselect the first option (Image of parent
symbol) and leave the last two options checked. Click OK to accept.
The drawing area will show the external entities and their ingoing and outgoing data
flows. Using the techniques learned in the first part of this tutorial, draw the diagram
presented in Figure 2, as shown.
If the Image is too small you can select Actual Size from the View menu or Zoom.
To re-route the lines from the existing data flows, click on each data flow to select and
choose Route Line from the pop up menu. Then, select Assign connections and
reconnect the data flow to the appropriate symbol, by dragging the end of the line you
want to reconnect.
Save your work when finished, by pressing CTRL+S and confirm by clicking on YES
when prompted.
Step 2: Checking the correctness of your diagram.
To check if your diagram is correct, select Rules Check from the Report Menu in the
menu bar. A dialog box will appear with the following message
Since the Report option did not contain a Rules Check report specification, the default
specification will be used.
Click OK to accept the default specification as the basis for checking the correctness of
your diagram.
SA 2001 will check your diagram and will issue the following report in a separate
window.
Rules Check
Enter project name
SA/2001 Educational Version
Diagram Type Diagram Name
Symbol Type Symbol Name
Rules
Data Flow Gane & Sarson Payroll System Level 0
Data Flow Erroneous Data Flow
R2 - Not defined.
R8 - No process at either connection.
Process Compute Weekly Paycheck
R9 - No input flow.
Process Create Weekly Payroll Record
R10 - No output flow.
as of 2/11/02
Page 1
SA/2001 Educational Version
5. For each error, the report gives the rule number, a brief explanation of the violation and
the name and type of the symbol in the error. The report can be printed if desired. To
print the report, right click on it. From the Floating Menu, select Print. (You can also use
the Print icon or File| Print.)
The Rules Check option also flags the errors directly on the diagram, with a circle next to
the symbol and a rule number.
Let us examine and correct each one of the errors highlighted in the report.
1. As expected, the Data Flow labeled “Erroneous Data Flow” is incorrect because it
does not originate or terminate in a process. Follow the instructions below to
delete this Data Flow.
2. Due to the wrong direction of the “Hrs. Worked” data flow, the process “Compute
Weekly Paycheck” has no input flow and the process “Create Weekly Payroll
Record” has no output flow. Delete this data flow, following the instructions
given below, and redraw it in the right direction.
To erase the visible error indicators from the diagram, use the Clear Errors command
(last option) in the Reports Menu.
Step 3: Deleting a symbol from a diagram
In order to erase a symbol from a diagram, it is not enough to simply delete it from the
graph. The underlying definition of the symbol must also be removed. Let us examine
the definitions of the symbols we have created first.
1. Click on the [Struct] tab on the browse window and then click on the plus sign
next to Definitions. There will be four categories of definitions (Data Element,
Data Flow, Data Store, External and Process). If you click on the plus sign next to
each, you will see the names of the elements you have drawn in your diagram.
This is a good opportunity to check that there are no duplications or erroneous
names in each category.
2. In order to delete the “Hrs. Worked” data flow that incorrectly points to the first
process (in Figure 2), highlight its name in the Data Flow definition list in the
browser, right click and select the Delete option. Click Yes in the deletion option
dialog box. The definition will be removed from the list. To delete the symbol
from the diagram, click on it once and choose the delete option from Edit in the
menu bar.
When you have made all the corrections, save your changes.
6. It is recommended that your run the Rules Check report again to make sure that you have
corrected all the errors. You should get a message indicating that the report is empty
when your diagram is correct.
Part III: Drawing a Level 1 Data Flow Diagram
Now we will draw the Level 1 for process 2 in the Payroll system (see Figure 3).
2.1 Gross 2.2 2.3
Pay Net Pay
Hrs. Worked Data Data
Compute Compute Create
Gross Pay Net Pay Payroll
Check
Payroll
Payroll Paycheck
Check
Data
Paycheck Data
S1 Payroll Data File
Figure 3. Level 1 Data Flow Diagram
In order to start creating this diagram, you should have the Level-0 diagram in the
drawing area. Select process 2 (Compute Weekly Paycheck) in the Level 0 Diagram,
right click to get to the context sensitive menu and choose the option Child Create…
Press OK in the Child Create dialog box to create a Gane & Sarson Data Flow Diagram.
In the Leveling Data dialog box, unselect the first and the third option, and leave a check
mark in the option line/flows attached to parent.
Draw the three processes as described in Part I. Name each process as shown in the
figure, and number each one with the extensions only (e.g. 1, 2, 3, etc).
Then draw a Data Store, following these steps:
Select the data store symbol from the toolbar; the cursor will get a pen-shape. Click on
the area of the diagram where you want to draw the symbol. Hit enter to accept and right
click to get the Edit menu. Enter the name of the data store (Payroll Data File) and click
OK.
Draw the new data flows and reassign the existing ones as described in Part II. Save your
diagram when finished.