SlideShare a Scribd company logo
1 of 42
Reclaimed Water Benefit-Cost Calculator For Irrigation - Worksheet
                             Instructions

1. Is reclaimed water service available to your
operation? If Yes, continue to Question 2. If        YES, continue to
No, Stop Here.                                         Question 2.                 NO, Stop Here
2. Is reclaimed water the only water source
available to your operation? If Yes, Stop Here.                            NO, continue to Question 3 and
If No, continue to Question 3 and complete the                             complete the RW Comparison
RW Comparison Worksheet.                             YES, Stop Here                 Worksheet.
3. What other water source(s) are available to
your operation for irrigation? (circle all that
apply)                                                Floridan aquifer
                                                   Intermediate aquifer
                                                   Surface water source
                                                  Other, please specify:
4. Of these water sources, which is the water source that would be
replaced, in whole or in part, by reclaimed water? For the purposes of
the RW Comparison Worksheet, this water source will be called the
"Next Available Water Source" or NAWS.

5. Has the applicant obtained, from the reclaimed water provider, the
nutrient contents and chemical constituents in the reclaimed water,
including nitrogen, phosphorus, potassium, trace elements including               YES ______
boron, and the electrical conductivity and sodium absorption ratio                 NO _____
(sodium, chloride and magnesium) of the water? This information
should be used to assist in estimating the benefits and costs of using
reclaimed water for irrigation.

Enter the information in the Spreadsheet titled "RW Comparison Worksheet".
The other spreadsheets calculate values referred to by the "RW Comparison
Worksheet" spreadsheet.

Color Code of RW Comparison Worksheet
                      means calculated numbers
                      means entered by user
                      means this is a drop down menu
                      means parameters of equations (assumed
                      values)
                      means keep as blank cell

Use the following sources to determine prevailing energy costs:
 Gasoline and Diesel Fuel: U.S. Government: http://tonto.eia.doe.gov/oog/info/gdu/gasdiesel.asp
                                       AAA: http://www.fuelgaugereport.com/FLmetro.asp
               Electricity: U.S. Government: http://www.neo.ne.gov/statshtml/115.htm
                                                  http://www.eia.doe.gov/cneaf/electricity/epm/table5_6_
                                                  a.html
For fertilizer prices go to:
http://www.ers.usda.gov/Data/FertilizerUse/
Use Table 7 (Excel Spreadsheet) to determine the current price of fertilizer. Scroll down to the most
recent year and use the cost of "Urea 45-46% Nitrogen.

D:ConFacconversion8656488reclaimedwaterbccalculatorirrigation1522.xlsx
RW Comparison Worksheet Instruc                                                                        7/21/2011
Prepared by: Hazen and Sawyer, July 8, 2010


D:ConFacconversion8656488reclaimedwaterbccalculatorirrigation1522.xlsx
RW Comparison Worksheet Instruc                                              7/21/2011
MODEL DISCLAIMER

The Reclaimed Water Benefit-Cost Calculator for Irrigation is to be used to provide guidance as to the
economic feasibility of using reclaimed water for a specific purpose. The values that the user will input
into the model are estimates and the model results should not be the only factor in determining
economic feasibility. Instead, the model results should be viewed in the proper context of all other
information submitted and relevant to the water use permit application or renewal.


The example values used in the models and referenced in the accompanying report are purely
illustrative for the purposes of this study presentation only. Readers and users are advised to develop
proper estimates of costs and benefits that would be appropriate for their individual site(s). Except
where explicitly directed (e.g. , to obtain the proper values of nitrogen fertilizer and fuel costs from
specific websites), the example values provided in the model and in this report are NOT “default”
values.


For information regarding how to use this Reclaimed Water Benefit-Cost Calculator for Irrigation, please
read Chapter 3.0 Reclaimed Water Benefit-Cost Evaluation for Irrigation Uses found in the document
titled "Economic Feasibility of Reclaimed Water Use by Non-Utility Water Use Permittees and Applicants",
Final Report, June 2010, prepared by Hazen and Sawyer for the Southwest Florida Water Management
District, Brooksville, Florida.


D:ConFacconversion8656488reclaimedwaterbccalculatorirrigation1522.xlsx
RW Comparison Worksheet Instruc                                                                  7/21/2011
Reclaimed Water Benefit Cost Calculator for Irrigation
         Economic Comparison of Reclaimed Water Versus Next Available Water
          Source For Irrigation by Agricultural, Recreation and Aesthetic Water
                                          Users

                                                                                      Reclaimed Water NAWS Minus
                                                                                       Used Instead &     RW/Other
                                                                       Next Available Other Sources if (Except A. which
 Row                                                                   Water Source      Applicable      is RW/Other
 No.                    Benefit or Cost Item                             (NAWS)         (RW/Other)       minus NAWS)
  (1)                               (2)                                     (3)              (4)              (5)
        Name of Next Available Water Source / Name
   1    of Reclaimed Water Provider                                    Floridan Aquifer   Utility Name

        A. Amount of Water Needed and
        Available in million gallons (mg) -
   2    Annual                                        74.00        84.00                                           10.00
   3    B. Installation Costs (if not already installed or replaced) (a)
        (a) The replacement cost of existing items within five years of the end of their useful lives should be included in
        this list as if purchased new. The remaining or "salvage" value of these existing items may be entered as
        indicated below. Do not forget to consider the cost of the backup water supply in Column (4) should reclaimed
        water be temporarily unavailable. The user may enter all appropriate names of cost items in Column (2), Rows
   4    5 to 12.
   5      Pipes and Pumps                                                    $1,000               $2,000
   6      Storage                                                            $2,000               $3,000
          Filtration system (if needed for drip/microjet irrigation
   7    system)                                                              $3,000               $4,000
   8      Land Development not included in items above                       $4,000               $5,000
   9      Item 1:                                                                $0                    $0
  10      Item 2:                                                            $6,000               $7,000
  11      Item 3:                                                            $7,000               $8,000
  12      Item 4:                                                            $8,000               $9,000

        Salvage Value of Existing Items that are replaced
        and included above (enter value as a negative
        number). It is included as 1/5th of this value in
  13    Total Annualized Installation Cost below.                              -$2,000                $0
  14    Total Installation Cost                                                $29,000           $38,000
  15    Annual Interest Rate (i.e. 6%)                                          6.00%             6.00%
  16    Useful Life of Items in Years
  17                                            Pipes and Pumps                     10                   10
  18                                                       Storage                  20                   20
           Filtration system (if needed for drip/microjet irrigation
  19                                                       system)                   7                    7
  20              Land Development not included in items above                      20                   20
  21                                                         Item 1:                10                   10
  22                                                         Item 2:                10                   10
  23                                                         Item 3:                10                   10
  24                                                         Item 4:                10                   10
  25    Total Annualized Installation Cost                                   $3,650            $4,947           -$1,297


D:ConFacconversion8656488reclaimedwaterbccalculatorirrigation1522.xlsx
RW Comparison Worksheet                                                                                            7/21/2011
Reclaimed Water Benefit Cost Calculator for Irrigation
         Economic Comparison of Reclaimed Water Versus Next Available Water
          Source For Irrigation by Agricultural, Recreation and Aesthetic Water
                                          Users

                                                                             Reclaimed Water NAWS Minus
                                                                              Used Instead &     RW/Other
                                                              Next Available Other Sources if (Except A. which
 Row                                                          Water Source      Applicable      is RW/Other
 No.                  Benefit or Cost Item                      (NAWS)         (RW/Other)       minus NAWS)
  (1)                            (2)                               (3)              (4)              (5)
        Total Annualized Installation Cost per
  26    1,000 Gallons of Water                                        $0.05           $0.06           -$0.02


D:ConFacconversion8656488reclaimedwaterbccalculatorirrigation1522.xlsx
RW Comparison Worksheet                                                                               7/21/2011
Reclaimed Water Benefit Cost Calculator for Irrigation
         Economic Comparison of Reclaimed Water Versus Next Available Water
          Source For Irrigation by Agricultural, Recreation and Aesthetic Water
                                          Users

                                                                                       Reclaimed Water NAWS Minus
                                                                                        Used Instead &     RW/Other
                                                                        Next Available Other Sources if (Except A. which
 Row                                                                    Water Source      Applicable      is RW/Other
 No.                    Benefit or Cost Item                              (NAWS)         (RW/Other)       minus NAWS)
  (1)                               (2)                                      (3)              (4)              (5)

  27    C. Annual O&M Costs
  28    1.0 Payments to Reclaimed Water Utility and, if applicable, to NAWS Water Utility
  29    Annual Fixed Payment                                            $0.00         $144.00
  30    Price per 1,000 gallons                                                  $0.00              $0.05
  31    Total Utility Payment - Annual                                              $0             $4,344      -$4,344.00
  32    2.0 Irrigation Pumping Energy Cost - Annual
  33                                          Energy Source:              Electricity      Electricity
  34                              Total Dynamic Head in Feet:                        300                 30
  35
        Cost of energy source, Dollars per KWH or gallon (obtain
  36                                      from appropriate web site):            $0.11              $0.11
  37                               Energy cost to pump 1 Kgal:                   $0.16              $0.02          $0.15
  38    Total irrigation pumping energy cost - Annual                          $12,069             $1,370        $10,699
  39    3.0 Irrigation Maintenance Labor Cost - Annual
  40                                       Labor Cost per Hour:                 $10.00             $10.00
  41                              Pumping System Labor Hours:                       52                 26
                 Irrigation System Labor Hours (include relevant
             issues such as fungus and algae management that
           involve repairing tubes and cleaning jets, maintaining
  42                                              storage pond):                   156                   208
  43                 Salinity or pH management Labor Hours:                         20                 52
  44    Total Maintenance Labor Cost - Annual                                   $2,280             $2,860          -$580
        4.0 Annual Cost of Chemicals To Manage Irrigation Water or Soil, other than Nitrogen, specify chemical
  45    name
  46    Gypsum                                                                  $2,000             $5,000        -$3,000
  47    Chemical Name:                                                              $0                 $0             $0
  48    Chemical Name:                                                              $0                 $0             $0

  49    5.0 Reporting or Record Keeping Costs - Annual                            $500             $1,500        -$1,000
  50    6.0 Other Annual Costs, specify below
  51    Item A:                                                                      $0                  $0           $0
  52    Item B:                                                                      $0                  $0           $0
  53    Item C                                                                       $0                  $0           $0
  54    Total Annual O&M Cost                                              $16,849           $15,074           $1,775
        Total Annual O&M Cost per 1,000 Gallons
  55    of Irrigation Water                                                    $0.23              $0.18           $0.02


D:ConFacconversion8656488reclaimedwaterbccalculatorirrigation1522.xlsx
RW Comparison Worksheet                                                                                          7/21/2011
Reclaimed Water Benefit Cost Calculator for Irrigation
         Economic Comparison of Reclaimed Water Versus Next Available Water
          Source For Irrigation by Agricultural, Recreation and Aesthetic Water
                                          Users

                                                                             Reclaimed Water NAWS Minus
                                                                              Used Instead &     RW/Other
                                                              Next Available Other Sources if (Except A. which
 Row                                                          Water Source      Applicable      is RW/Other
 No.                  Benefit or Cost Item                      (NAWS)         (RW/Other)       minus NAWS)
  (1)                            (2)                               (3)              (4)              (5)

  56    D. Recurring O&M Costs, Other than Annual
  57    Filter Media Replacement                                      $11,000         $11,000
  58    Item a replaced:                                                   $0              $0
  59    Item b replaced:                                                 $500          $3,000
  60    Item c replaced:                                                 $400          $2,000
  61    Item d replaced:                                                 $300          $1,000
  62    Replacement Frequency - No. of Years
  63                             Filter Media Replacement                    5              3
  64                                       Item a replaced:
  65                                       Item b replaced:                  3              5
  66                                       Item c replaced:                  3              5
  67                                       Item d replaced:                  3              5
        Total Annualized Recurring O&M
  68    Cost                                                        $3,060          $5,540          -$2,479
        Total Annualized Recurring O&M Cost per
  69    1,000 Gallons of Irrigation Water                             $0.04           $0.07           -$0.03


D:ConFacconversion8656488reclaimedwaterbccalculatorirrigation1522.xlsx
RW Comparison Worksheet                                                                               7/21/2011
Reclaimed Water Benefit Cost Calculator for Irrigation
         Economic Comparison of Reclaimed Water Versus Next Available Water
          Source For Irrigation by Agricultural, Recreation and Aesthetic Water
                                          Users

                                                                                    Reclaimed Water NAWS Minus
                                                                                     Used Instead &     RW/Other
                                                                     Next Available Other Sources if (Except A. which
 Row                                                                 Water Source      Applicable      is RW/Other
 No.                  Benefit or Cost Item                             (NAWS)         (RW/Other)       minus NAWS)
  (1)                             (2)                                     (3)              (4)              (5)

  70    E. Nitrogen Fertilizer Cost Savings - Annual:
  71                                    N Fertilizer Cost per Ton:            $552             $552
             Nitrogen concentration in ppm or mg/l of Irrigation
             Water (for reclaimed water, obtain from utility. For
  72                   NAWS, use available info or assume 0):                    0                 6
         Percent of Nitrogen in water that is taken up by the
  73                                                   plant:                  50%              50%
        Nitrogen Fertilizer Cost Savings Per 1,000
  74    gallons of irrigation water:                                        $0.00          -$0.015           $0.015
        Nitrogen Fertilizer Cost Savings due
  75    to N in applied water - Annual                                         $0         -$1,258           $1,258
        Total Annualized Cost, including the
        Cost Savings (Negative cost means cost
  76    increase associated with reclaimed water)                       $23,559          $24,302             -$743

        Total Annualized Cost, including the
        Cost Savings Per 1,000 Gallons of
        Irrigation Water (Negative cost means cost
  77    increase associated with reclaimed water)                       $0.3184          $0.2893            -$0.01


D:ConFacconversion8656488reclaimedwaterbccalculatorirrigation1522.xlsx
RW Comparison Worksheet                                                                                      7/21/2011
Reclaimed Water Benefit Cost Calculator for Irrigation
         Economic Comparison of Reclaimed Water Versus Next Available Water
          Source For Irrigation by Agricultural, Recreation and Aesthetic Water
                                          Users

                                                                                   Reclaimed Water NAWS Minus
                                                                                    Used Instead &     RW/Other
                                                                    Next Available Other Sources if (Except A. which
 Row                                                                Water Source      Applicable      is RW/Other
 No.                   Benefit or Cost Item                           (NAWS)         (RW/Other)       minus NAWS)
  (1)                              (2)                                   (3)              (4)              (5)

  78    F. Change in Value of Crop Production - Annual
  79    Average crop production in number of units per acre when irrigating with reclaimed water (b):                 525.00
          Average crop production in number of units per acre when irrigating with the next available
  80                                                                                   water source:                  500.00

  81                                                                                       Name of Unit: Boxes of Oranges
  82     Change in Crop Production in Units per Acre Due to Reclaimed Water (b)                                     25.00
  83     Market Value of Crop Less Cost of Harvesting and Selling Per Unit                                          $2.56
  84     Number of Acres                                                                                              100
  85    Net Value of Change in Crop Production - Annual                                                            $6,400
        (b) This average crop production is an estimate and could be due to increased reliability of reclaimed water,
        differences in water quality, increased availability of water for frost/freeze protection and/or more water available
  86    to meet crop water requirements when compared to next available water source (NAWS).


  87    G. Change in Quality of Nursery Plant, Lawn and/or Landscape - Annual
        Change in Net Revenue (Market Value minus Variable Cost) -
  88    Annual (c)                                                       $5,000
        (c) This change in net revenue is an estimate and can be positive or negative. This value would be positive if
        more water is available to meet the plant's water requirements when compared to the next available water
        source (NAWS) which results in improved plant quality and, thus, increases landscape plant prices or revenue.
        For golf courses, improved quality of lawn and landscape during drought could increase golf course use and,
        thus, sales. The net revenue during a drought year would be the change in revenue minus the change in cost
        due to having reclaimed water during a drought year. This net revenue during a drought year would be
        multiplied by the proportion of years that a drought occurs. For example, a proportion of 0.10 means that
        drought restrictions occur once every ten years. Variable cost includes the costs that increase with increasing
        production or sales, and decrease with decreasing production or sales. The change in net revenue would be
        negative if the use of reclaimed water reduces plant quality which reduces revenue through lower plant sales or
  89    number of golfers.


  90    H. Value of Additional Water Available from Reclaimed Water Source
                 Additional Water Available from Reclaimed Water Source in million gallons per year
  91                               compared to amount needed and available from NAWS- Annual:                          10.00


D:ConFacconversion8656488reclaimedwaterbccalculatorirrigation1522.xlsx
RW Comparison Worksheet                                                                                             7/21/2011
Reclaimed Water Benefit Cost Calculator for Irrigation
         Economic Comparison of Reclaimed Water Versus Next Available Water
          Source For Irrigation by Agricultural, Recreation and Aesthetic Water
                                          Users

                                                                                  Reclaimed Water NAWS Minus
                                                                                   Used Instead &     RW/Other
                                                                   Next Available Other Sources if (Except A. which
 Row                                                               Water Source      Applicable      is RW/Other
 No.                   Benefit or Cost Item                          (NAWS)         (RW/Other)       minus NAWS)
  (1)                              (2)                                  (3)              (4)              (5)
        What is the cost per 1,000 gallons to obtain this fresh water, including any pumping costs?
        This is a lower bound estimate of the value of water to the operation. The actual value is
        likely much higher than this value. (This can be calculated by the irrigation water user using
  92    another spreadsheet.)                                                                                 $0.30

        Value of Additional Water Available from Reclaimed Water
  93    Source - Annual                                                                                   $3,000


D:ConFacconversion8656488reclaimedwaterbccalculatorirrigation1522.xlsx
RW Comparison Worksheet                                                                                    7/21/2011
Reclaimed Water Benefit Cost Calculator for Irrigation
         Economic Comparison of Reclaimed Water Versus Next Available Water
          Source For Irrigation by Agricultural, Recreation and Aesthetic Water
                                          Users

                                                                                 Reclaimed Water NAWS Minus
                                                                                  Used Instead &     RW/Other
                                                                  Next Available Other Sources if (Except A. which
 Row                                                              Water Source      Applicable      is RW/Other
 No.                   Benefit or Cost Item                         (NAWS)         (RW/Other)       minus NAWS)
  (1)                              (2)                                 (3)              (4)              (5)


  94    I. Value of the Additional Water "Freed Up" by the Reclaimed Water Use
         Percent of water needed and available from NAWS that will be "freed up" and used for other
  95        purposes when reclaimed water used (% of water amount entered in Row 2, Column (3)):           20.00%
        Amount of fresh water that would be "freed up" due to the reclaimed water use and would be
        used for other reasonable / beneficial uses, including other irrigation needs, by the applicant
  96    during a year in million gallons (on average)?                                                         15
        Cost per 1,000 gallons of fresh water, including any pumping costs. This is a lower bound
        estimate of the value of water to the operation. The actual value is likely much higher than
  97    this value. (From H. above)                                                                          $0.30
  98    Value of "freed up" NAWS water - Annual                                                           $4,440

  99    J. Value of Water Available During NAWS Water Shortage Restrictions
  100   Number of years every ten years when NAWS Water Shortage Restriction in Place                          1.0
        Percent of total annual water use that is used during the months when NAWS Water
  101   Shortage Restriction in Place                                                                      30.00%
        Cutback percent or percent of NAWS water use that is cut back during water restriction
  102   period:                                                                                            20.00%
        Annualized amount of water available during NAWS Water Shortage Restriction Due to
  103   Reclaimed Water Use in million gallons per year                                                       0.44
        Cost per 1,000 gallons of fresh water, including any pumping costs. This is a lower bound
        estimate of the value of water to the operation. The actual value is likely much higher than
  104   this value. (From H. above)                                                                          $0.30

        Value of Water Available During NAWS Water Shortage
  105   Restrictions                                                                                       $133


D:ConFacconversion8656488reclaimedwaterbccalculatorirrigation1522.xlsx
RW Comparison Worksheet                                                                                   7/21/2011
Reclaimed Water Benefit Cost Calculator for Irrigation
         Economic Comparison of Reclaimed Water Versus Next Available Water
          Source For Irrigation by Agricultural, Recreation and Aesthetic Water
                                          Users

                                                                               Reclaimed Water NAWS Minus
                                                                                Used Instead &     RW/Other
                                                                Next Available Other Sources if (Except A. which
 Row                                                            Water Source      Applicable      is RW/Other
 No.                  Benefit or Cost Item                        (NAWS)         (RW/Other)       minus NAWS)
  (1)                             (2)                                (3)              (4)              (5)
        Total Benefit Value of Reclaimed Water (Other Than Cost
  106   Savings) - Annual                                                                                  $18,973
        Total Benefit Value of Reclaimed Water per 1,000 Gallons
  107   (Other Than Cost Savings)                                                                              $0.23
        Net Benefit of Reclaimed Water Use Relative to Next
  108   Available Water Source - Annual (d)                                                             $18,230
        Net Benefit of Reclaimed Water Use Relative to Next
        Available Water Source Per 1,000 Gallons of Irrigation
  109   Water (d)                                                                                           $0.22
        (d) Net Benefit is the sum of the benefits minus the sum of the costs of RW/Other. These are benefits and
        costs when compared to the Next Available Water Source (NAWS). A positive number means the estimated
        value of the total benefit of RW/Other is greater than the estimated value of the total cost of RW/Other. A
        negative number means the estimated value of the total benefit of RW/Other is less than the estimated value of
  110   the total cost of RW/Other.


D:ConFacconversion8656488reclaimedwaterbccalculatorirrigation1522.xlsx
RW Comparison Worksheet                                                                                       7/21/2011
MODEL CALCULATIONS


                                      Annualized Installation Cost


        Next Available Water Source Other Than Reclaimed                If Reclaimed Water is Used
                              Water                                               Instead
                                                       $136                                      $272
                                                       $174                                      $262

                                                           $537                                   $717
                                                           $349                                   $436
                                                             $0                                     $0
                                                           $815                                   $951
                                                           $951                                 $1,087
                                                         $1,087                                 $1,223


     Color Code
                                                                     means calculated numbers
                                                                     means entered by respondent
                                                                     means this is a drop down menu
                                                                     means parameters of equations
                                                                     (assumed values)
                                                                     means keep as blank cell

     Use the following sources to determine prevailing energy costs:
                                      Gasoline and Diesel Fuel:                       U.S. Government: http://tonto.eia.doe.
                                                                                                 AAA: http://www.fuelgaug
                                                      Electricity:                    U.S. Government: http://www.neo.ne.go


D:ConFacconversion8656488reclaimedwaterbccalculatorirrigation1522.xlsx
RW Comparison Worksheet                                                                                      7/21/2011
http://www.eia.doe.


D:ConFacconversion8656488reclaimedwaterbccalculatorirrigation1522.xlsx
RW Comparison Worksheet                                                           7/21/2011
UF Study (1991) - Energy Use in Irrigation:
     http://www.p2pays.org/ref/12/11366.pdf

     Next Available Water Source Other Than Reclaimed Water
     Calculate energy cost to pump 1,000 gallons of water, depending upon fuel source per 1,000 gallons.
                                                      Electricity             $0.16                        1.428
                                                         Diesel                N/A                         0.114
                                                       Gasoline                N/A                         0.149
     Unit Cost:                                                               $0.16


     Reclaimed Water
     Calculate energy cost to pump 1,000 gallons of water, depending upon fuel source per 1,000 gallons.
                                                    Electricity             $0.02                        0.1428
                                                       Diesel                N/A                          0.011

                                                       Gasoline                N/A                         0.015
     Unit Cost:                                                              $0.0163


                  Annualized Recurring O&M Costs


D:ConFacconversion8656488reclaimedwaterbccalculatorirrigation1522.xlsx
RW Comparison Worksheet                                                                               7/21/2011
Next Available Water Source Other Than Reclaimed Water    If Reclaimed Water is Used Instead
                                                         $2,611                               $4,115
                                                             $0                                   $0
                                                           $187                                 $712
                                                           $150                                 $475
                                                           $112                                 $237


     For fertilizer prices go to:


D:ConFacconversion8656488reclaimedwaterbccalculatorirrigation1522.xlsx
RW Comparison Worksheet                                                                                7/21/2011
http://www.ers.usda.gov/Data/FertilizerUse/
     Use Table 7 (Excel Spreadsheet) to determine the current price of fertilizer. Scroll down to the most recent year a


        Next Available Water Source Other Than Reclaimed Water     If Reclaimed Water is Used Instead


                                                            0.00                                  0.05 Pounds of N per 1,0

     50% Used by Manatee County Cooperative Extension in their presentation.

                                                                                                      Cost per pound of n
                                                           $0.60                                $0.60 46% nitrogen fertiliz


                                                                                                  1.36 Pounds of N per acre


                                                                                                               27154


D:ConFacconversion8656488reclaimedwaterbccalculatorirrigation1522.xlsx
RW Comparison Worksheet                                                                                     7/21/2011
D:ConFacconversion8656488reclaimedwaterbccalculatorirrigation1522.xlsx
RW Comparison Worksheet                                                      7/21/2011
D:ConFacconversion8656488reclaimedwaterbccalculatorirrigation1522.xlsx
RW Comparison Worksheet                                                      7/21/2011
D:ConFacconversion8656488reclaimedwaterbccalculatorirrigation1522.xlsx
RW Comparison Worksheet                                                      7/21/2011
$0.22


D:ConFacconversion8656488reclaimedwaterbccalculatorirrigation1522.xlsx
RW Comparison Worksheet                                                      7/21/2011
p://tonto.eia.doe.gov/oog/info/gdu/gasdiesel.asp
p://www.fuelgaugereport.com/FLmetro.asp
p://www.neo.ne.gov/statshtml/115.htm


            D:ConFacconversion8656488reclaimedwaterbccalculatorirrigation1522.xlsx
            RW Comparison Worksheet                                                      7/21/2011
p://www.eia.doe.gov/cneaf/electricity/epm/table5_6_a.html


           D:ConFacconversion8656488reclaimedwaterbccalculatorirrigation1522.xlsx
           RW Comparison Worksheet                                                      7/21/2011
lons.
        KWH required to pump 1,000 gallons
        gallons diesel fuel required to pump 1,000 gallons
        gallons gasoline required to pump 1,000 gallons


lons.
        KWH required to pump 1,000 gallons
        gallons diesel fuel required to pump 1,000 gallons

        gallons gasoline required to pump 1,000 gallons


        D:ConFacconversion8656488reclaimedwaterbccalculatorirrigation1522.xlsx
        RW Comparison Worksheet                                                      7/21/2011
D:ConFacconversion8656488reclaimedwaterbccalculatorirrigation1522.xlsx
RW Comparison Worksheet                                                      7/21/2011
most recent year and use the cost of "Urea 45-46% Nitrogen.


 unds of N per 1,000 gallons of irrigation water


st per pound of nitrogen (using cost of 1 ton of Urea 45-
% nitrogen fertilizer)


 unds of N per acre with 1 inch of irrigation water


              Gallons per 1 acre inch of water


              D:ConFacconversion8656488reclaimedwaterbccalculatorirrigation1522.xlsx
              RW Comparison Worksheet                                                      7/21/2011
D:ConFacconversion8656488reclaimedwaterbccalculatorirrigation1522.xlsx
RW Comparison Worksheet                                                      7/21/2011
D:ConFacconversion8656488reclaimedwaterbccalculatorirrigation1522.xlsx
RW Comparison Worksheet                                                      7/21/2011
D:ConFacconversion8656488reclaimedwaterbccalculatorirrigation1522.xlsx
RW Comparison Worksheet                                                      7/21/2011
D:ConFacconversion8656488reclaimedwaterbccalculatorirrigation1522.xlsx
RW Comparison Worksheet                                                      7/21/2011
Calculate Fertlizer Cost


Calculation to determine cost per pound of nitrogen in 1 ton of fertilizer
                                        $0.60 =SUM(Cost of Fertilizer per Ton/0.46)/2000          $0.60         0.6 where 0.46 is the proportion of N in the fertilizer.
Calculation to determine weight of nitrogen per Kgal of Reclaimed Water
                                       0.0500 =SUM(J60*1000*8.33)/1000000                        0.0500 OK          = 8.33 pounds per gallon times parts per million times 1,000 gallons
Use the following source (Table 7) to determine the current price of fertilizer.             http://www.ers.usda.gov/Data/FertilizerUse/
Table 7 is an Excel Spreadsheet. Scroll down to the most recent year and use the cost of "Urea 45-46% Nitrogen.
                                                                                                        http://www.ers.usda.gov/Data/FertilizerUse/
The nitrogen added to the crop due to nitrate in the irrigation source water can be determined as follows:
N concentration in RW, mg/l or ppm                                6
Inches of irrigation water applied                                1              1 acre inch of water equals            27,154 gallons
                                                                       How much of this would be used by the plant? IFAS uses 50% for tomatoes. "Effect of Nitrogen Rate on Yield of Tomato Grown with
N in pounds per acre                                     1.356         Seepage Irrigation and Reclaimed Water" (Phyllis Gilreath presentation)
Pounds of N per 1,000 gallons of water applied       0.049937
Source: "Water and Florida Citrus: Use, Regulation, Systems and Management", Edited by Brian Boman, University of Florida, IFAS, SP 281, July 2002, page 415 to 416.
                                                                               in groundwater can contribute significant amounts of nitrogen torwards a grapevine's nutritional
                                                                     3
                                               Nitrate Nitrogen is NO --N      requirement and should be considered when planning a fertilizer program.
                                                                           Labs report NO3--N concentrations in ppm (mg/l). This is converted to pounds of nitrogen per acre-foot
                                                                           by mulitplying by 2.7.
                                               From "The Use of Soil and Water Analysis, Bill Peacock, Tulare County Farm Advisor, University of California Cooperative Extension, Publ. # IG3-96.

                                                      0.22661114                    2.712


                                                            0.050                                 0.1        0.01
                                                                                                  0.2        0.02
                                                                                                  0.3        0.03
                                                                                                  0.4        0.04
                                                                                                  0.5        0.05
                                                                                                  0.6        0.06
                                                                                                  0.7        0.07
                                                                                                  0.8        0.08
                                                                                                  0.9        0.09
                                                                                                    1         0.1
                                                                                                             0.55


D:ConFacconversion8656488reclaimedwaterbccalculatorirrigation1522.xlsx
N Fertilizer Cost                                                                                                                                                                                        7/21/2011
Pumping Energy Equations - Next Available Water Source
                                                             Matches
                                          Matches EEE       SWFWMD
Electicity                                   paper            calcs          Matches Jorge paper
Total Dynamic Head (TDH) in feet                    300              300                       245
Gallons per Minute of flow (GPM)                   1000             1000                        25
                                                                                                       Gal of diesel fuel
                                                                                                       used per hour of
                                                                                                      pumping, 1000 gpm,                              Gallons per hour of
Pump efficiency                                     0.75             0.75                        0.64       300 tdh            kWh of electricity          gasoline
Motor power in hp (brake horsepower)              101.11           101.11                        2.42                  6.86                  84.97                   8.95 From EEE Paper
hp-hours per gallon                                 1.18             1.18                       1.127                  0.96
One hour or Hours it takes to pump
1,000 gallons                                       1.00              0.02                       6.00                   1.13                   1.34                                              11.0011
kWh of electicity needed                           85.69              1.43                      12.88                  12.88                   0.88                 1.18                        0.889996
Cost per kWh                                       0.119           0.1142                       0.119                                          1.13                                             1.187085 14.66276
Cost of electricity per 1,000 gallons             $10.20            $0.16                       $1.53
Motor efficiency assumed to be 0.88.                                                                    From IFAS "Loading Effects on Irrigation Power Unit Performance, A.G. Smajstrla nad F.S. Zazueta, AE 242, June 2003.
                                                    1.43                                                From Energy Efficiency & Environmental News: Energy Use in Irrigation, Nov. 1991, Florida Energy Extension Service and Helen H. Whiffen.

                                                                                                 1.00
                                          Matches EEE
Diesel fuel                                  paper
Total Dynamic Head (TDH) in feet                     300               300
Gallons per Minute of flow (GPM)                   1000              1000
Pump efficiency                                     0.75              0.75
Motor power in hp                                101.11            101.11 From Hydraulic Machines and Equipment, page 18-7, Professional Publications Inc. (Jorge Atoche) and Energy Efficiency and Environmental News: Energy Use in Irrigation, IFAS.
hp-hours per gallon                               14.75             14.75 From IFAS Energy Requirement for Drip Irrigation of Tomatoes in North Florida and Loading Effects on Irrigation Power Unit Performance, BUL 289, July 2002.
One hour or Hours it takes to pump
1,000 gallons                                       1.00             0.02
Gallons of diesel fuel needed                       6.86             0.11                      0.11                   0.0678
Cost per Gallon of diesel fuel                     2.772           $0.114 See sources in Pumping Costs SS
Cost of diesel fuel per 1,000 gallons             $19.00            $0.01
Motor efficiency assumed to be 0.88.

                                          Matches EEE
Gasoline                                     paper           Answer
Total Dynamic Head (TDH) in feet                     300               300
Gallons per Minute of flow (GPM)                   1000              1000
Pump efficiency                                     0.75              0.75
Motor power in hp                                101.11            101.11
hp-hours per gallon                               11.30             11.30
One hour or Hours it takes to pump
1,000 gallons                                       1.00              0.02
Gallons of gasoline fuel needed                     8.95              0.15
Cost per Gallon of gasoline fuel                   2.626           0.1142
Cost of gasoline fuel per 1,000 gallons           $23.50            $0.02
Motor efficiency assumed to be 0.88.


D:ConFacconversion8656488reclaimedwaterbccalculatorirrigation1522.xlsx
Next Available Source Pump Ener                                                                                                                                                                                                             7/21/2011
elen H. Whiffen.


gy Use in Irrigation, IFAS.


            D:ConFacconversion8656488reclaimedwaterbccalculatorirrigation1522.xlsx
            Next Available Source Pump Ener                                              7/21/2011
Pumping Energy Equations - Reclaimed Water
                                                             Matches
                                          Matches EEE       SWFWMD
Electicity                                   paper            calcs          Matches Jorge paper
Total Dynamic Head (TDH) in feet                    300                30                      245
Gallons per Minute of flow (GPM)                   1000               200                       25
                                                                                                      Gal of diesel fuel
                                                                                                      used per hour of
                                                                                                     pumping, 1000 gpm,                             Gallons per hour of
Pump efficiency                                     0.75             0.75                       0.64       300 tdh           kWh of electricity          gasoline
Motor power in hp (brake horsepower)              101.11             2.02                       2.42                  6.86                 84.97                   8.95 From EEE Paper
hp-hours per gallon                                 1.18             1.18                      1.127                  0.96
One hour or Hours it takes to pump
1,000 gallons                                       1.00              0.08                      6.00                  1.13                   1.34
kWh of electicity needed                           85.69        0.142814                       12.88                 12.88                   0.88                 1.18                                    16.66667
Cost per kWh                                       0.119           0.1142                      0.119                                         1.13                                                         0.000253
Cost of electricity per 1,000 gallons             $10.20            $0.02                      $1.53                                                                                                       0.00357
Motor efficiency assumed to be 0.88.                                                                                                                                                                      0.142814


                                          Matches EEE
Diesel fuel                                  paper
Total Dynamic Head (TDH) in feet                     300               30                                            6000
Gallons per Minute of flow (GPM)                   1000               200
Pump efficiency                                     0.75             0.75
Motor power in hp                                101.11              2.02 From Hydraulic Machines and Equipment, page 18-7, Professional Publications Inc. (Jorge Atoche) and Energy Efficiency and Environmental News: Energy Use in Irrigation, IFAS.
hp-hours per gallon                               14.75             14.75 From IFAS Energy Requirement for Drip Irrigation of Tomatoes in North Florida and Loading Effects on Irrigation Power Unit Performance.
One hour or Hours it takes to pump
1,000 gallons                                       1.00              0.08
Gallons of diesel fuel needed                       6.86            0.011                      0.57                 0.0678
Cost per Gallon of diesel fuel                     2.772           0.1142 See sources in Pumping Costs SS
Cost of diesel fuel per 1,000 gallons             $19.00            $0.00
Motor efficiency assumed to be 0.88.

                                          Matches EEE
Gasoline                                     paper           Answer
Total Dynamic Head (TDH) in feet                     300               30
Gallons per Minute of flow (GPM)                   1000               200
Pump efficiency                                     0.75             0.75
Motor power in hp                                101.11              2.02
hp-hours per gallon                               11.30             11.30
One hour or Hours it takes to pump
1,000 gallons                                       1.00              0.08
Gallons of gasoline fuel needed                     8.95            0.015
Cost per Gallon of gasoline fuel                   2.626           0.1142
Cost of gasoline fuel per 1,000 gallons           $23.50            $0.00
Motor efficiency assumed to be 0.88.


D:ConFacconversion8656488reclaimedwaterbccalculatorirrigation1522.xlsx
Reclaimed Water Pump Energy                                                                                                                                                                                                                7/21/2011
gy Use in Irrigation, IFAS.


            D:ConFacconversion8656488reclaimedwaterbccalculatorirrigation1522.xlsx
            Reclaimed Water Pump Energy                                                  7/21/2011
Table 10.1—GROSS DOMESTIC PRODUCT AND DEFLATORS USED IN THE HISTORIC
                                                        (Fiscal Year 2000 = 1.000)
                                       % Change in
               GDP (in      GDP
                                      GDP (Chained)
       Year   billions of (Chained)
                                       Price Index                Total         Total
               dollars) Price Index                    Total
                                          (GMJ)                  Defense     Nondefense
1940                96.8     0.0978                     0.0870      0.0836         0.0878
1941               114.1     0.1014                     0.0928      0.0994         0.0876
1942               144.3     0.1089                     0.1028      0.1186         0.0757
1943               180.3     0.1163                     0.1122      0.1268         0.0682
1944               209.2     0.1209                     0.1061      0.1157         0.0689
1945               221.4     0.1239                     0.1041      0.1071         0.0843
1946               222.7     0.1328                     0.1071      0.1052         0.1140
1947               233.2     0.1466                     0.1162      0.1137         0.1177
1948               256.7     0.1606                     0.1273      0.1052         0.1402
1949               271.3     0.1660                     0.1246      0.1062         0.1367
1950               273.2     0.1635                     0.1287      0.1059         0.1434
1951               320.3     0.1723                     0.1279      0.1113         0.1523
1952               348.7     0.1792                     0.1280      0.1162         0.1633
1953               372.6     0.1825                     0.1368      0.1269         0.1661
1954               377.1     0.1846                     0.1409      0.1290         0.1784
1955               395.9     0.1862                     0.1455      0.1335         0.1709
1956               427.0     0.1911                     0.1526      0.1425         0.1710
1957               450.9     0.1983                     0.1601      0.1497         0.1780
1958               460.0     0.2043                     0.1687      0.1562         0.1885
1959               490.2     0.2075                     0.1746      0.1647         0.1875
1960               518.9     0.2100                     0.1750      0.1603         0.1945
1961               529.9     0.2130                     0.1795      0.1645         0.1981
1962               567.8     0.2154                     0.1803      0.1657         0.1971
1963               599.2     0.2181                     0.1873      0.1726         0.2034
1964               641.4     0.2207           0.0119    0.1900      0.1739         0.2064
1965               687.5     0.2245           0.0172    0.1928      0.1735         0.2102
1966               755.8     0.2293           0.0214    0.1974      0.1800         0.2131
1967               810.2     0.2367           0.0323    0.2026      0.1863         0.2185
1968               868.5     0.2451           0.0355    0.2103      0.1950         0.2254
1969               948.3     0.2563           0.0457    0.2230      0.2062         0.2390
1970             1,012.9     0.2703           0.0546    0.2363      0.2178         0.2515
1971             1,080.3     0.2838           0.0499    0.2519      0.2314         0.2661
1972             1,176.9     0.2972           0.0472    0.2690      0.2551         0.2769
1973             1,311.0     0.3103           0.0441    0.2833      0.2752         0.2872
1974             1,438.9     0.3327           0.0722    0.3070      0.2967         0.3116
1975             1,560.8     0.3673           0.1040    0.3384      0.3293         0.3418
1976             1,738.8     0.3938           0.0721    0.3640      0.3547         0.3670
TQ                 459.6     0.4063                     0.3752      0.3648         0.3785
1977             1,974.4     0.4233           0.0749    0.3934      0.3881         0.3951
1978             2,218.3     0.4518           0.0673    0.4194      0.4161         0.4204
1979             2,502.4     0.4882           0.0806    0.4552      0.4520         0.4561
1980             2,725.4     0.5310           0.0877    0.5029      0.5017         0.5033
1981             3,058.6     0.5830           0.0979    0.5562      0.5582         0.5556
1982             3,225.5     0.6229           0.0684    0.5958      0.6037         0.5932
1983             3,442.7     0.6504           0.0441    0.6245      0.6348         0.6210
1984             3,846.7     0.6744           0.0369    0.6555      0.6809         0.6467
1985             4,148.9     0.6963           0.0325    0.6781      0.7089         0.6676
1986             4,406.7     0.7125           0.0233    0.6947      0.7180         0.6861
1987             4,654.4     0.7311           0.0261    0.7143      0.7284         0.7090
1988             5,011.9     0.7541           0.0315    0.7359      0.7386         0.7349
1989             5,401.7     0.7834           0.0389    0.7631      0.7609         0.7639
1990                     5,737.0      0.8125            0.0371       0.7882      0.7822            0.7902
1991                     5,934.2      0.8430            0.0375       0.8226      0.8189            0.8236
1992                     6,240.6      0.8642            0.0251       0.8508      0.8422            0.8531
1993                     6,578.4      0.8838            0.0227       0.8725      0.8555            0.8770
1994                     6,964.2      0.9028            0.0215       0.8902      0.8724            0.8946
1995                     7,325.1      0.9218            0.0210       0.9120      0.8895            0.9171
1996                     7,697.4      0.9395            0.0192       0.9328      0.9190            0.9356
1997                     8,186.6      0.9559            0.0175       0.9508      0.9381            0.9534
1998                     8,626.3      0.9675            0.0121       0.9603      0.9499            0.9623
1999                     9,127.0      0.9802            0.0131       0.9748      0.9690            0.9759
2000                     9,708.4      1.0000            0.0202       1.0000      1.0000            1.0000
2001                    10,059.8      1.0236            0.0236       1.0234      1.0256            1.0229
2002                    10,378.4      1.0432            0.0191       1.0425      1.0582            1.0393
2003                    10,803.7      1.0643            0.0202       1.0703      1.1109            1.0613
2004                    11,503.7      1.0920            0.0260       1.1014      1.1561            1.0886
2005                    12,234.9      1.1270            0.0321       1.1417      1.2158            1.1245
2006                    13,009.9      1.1652            0.0339       1.1809      1.2669            1.1616
2007                    13,642.3      1.1971            0.0274       1.2081      1.3061            1.1856
2008                    14,222.3      1.2256            0.0238       1.2584      1.3355            1.2398
2009 estimate           14,240.2      1.2435            0.0146       1.2785      1.3484            1.2648
2010 estimate           14,728.8      1.2560                         1.2807      1.3650            1.2614
2011 estimate           15,499.8      1.2733                         1.2975      1.3838            1.2797
2012 estimate           16,470.4      1.2945                         1.3195      1.4068            1.3024
2013 estimate           17,497.8      1.3178                         1.3443      1.4322            1.3280
2014 estimate           18,386.4      1.3415                         1.3705      1.4579            1.3550
Note: Constant dollar research and development outlays are based on the GDP (chained) price index.


Source: http://www.whitehouse.gov/omb/budget/Historicals/

                  Average 18 years                     0.0218
                  Average 20 years                     0.0234


                  2007 to 2009                           1.039
                  2008 to 2009                           1.015
                  2005 to 2009                           1.103
                  2006 to 2009                           1.067
ORS USED IN THE HISTORICAL TABLES: 1940–2014
0)
                                               Composite Outlay Deflators
                                                                                         Undistributed
                 Payments for Individuals
                                                         Other Grants    Net Interest     Offsetting      All Other
            Total         Direct            Grants                                         Receipts
               0.0931         0.0931            0.0931          0.0703          0.0978           0.0608      0.0847
               0.0963         0.0963            0.0963          0.0640          0.1014           0.0583      0.0809
               0.1053         0.1053            0.1053          0.0631          0.1089           0.0565      0.0661
               0.1165         0.1165            0.1165          0.0675          0.1163           0.0554      0.0583
               0.1251         0.1251            0.1251          0.0689          0.1209           0.0552      0.0562
               0.1315         0.1316            0.1311          0.0691          0.1239           0.0569      0.0586
               0.1387         0.1388            0.1385          0.0747          0.1328           0.0632      0.0684
               0.1493         0.1493            0.1492          0.1022          0.1466           0.0834      0.0868
               0.1631         0.1631            0.1630          0.1036          0.1606           0.1059      0.1117
               0.1676         0.1676            0.1674          0.1110          0.1660           0.1033      0.1092
               0.1656         0.1656            0.1650          0.1042          0.1635           0.1088      0.1162
               0.1749         0.1750            0.1742          0.1198          0.1723           0.1045      0.1154
               0.1816         0.1817            0.1810          0.1218          0.1792           0.1094      0.1222
               0.1844         0.1845            0.1839          0.1291          0.1825           0.1156      0.1288
               0.1868         0.1869            0.1866          0.1260          0.1846           0.1170      0.1360
               0.1870         0.1870            0.1869          0.1292          0.1862           0.1204      0.1310
               0.1894         0.1894            0.1893          0.1321          0.1911           0.1231      0.1317
               0.1948         0.1949            0.1947          0.1434          0.1983           0.1277      0.1379
               0.2006         0.2006            0.2005          0.1571          0.2043           0.1361      0.1491
               0.2036         0.2037            0.2035          0.1667          0.2075           0.1423      0.1536
               0.2073         0.2073            0.2071          0.1680          0.2100           0.1400      0.1570
               0.2103         0.2104            0.2102          0.1656          0.2130           0.1464      0.1647
               0.2123         0.2124            0.2122          0.1671          0.2154           0.1489      0.1665
               0.2149         0.2149            0.2147          0.1727          0.2181           0.1533      0.1756
               0.2178         0.2178            0.2176          0.1760          0.2207           0.1575      0.1832
               0.2208         0.2208            0.2206          0.1807          0.2245           0.1656      0.1905
               0.2248         0.2248            0.2246          0.1779          0.2293           0.1714      0.1956
               0.2308         0.2308            0.2307          0.1820          0.2367           0.1773      0.2002
               0.2380         0.2380            0.2379          0.1889          0.2451           0.1848      0.2061
               0.2482         0.2482            0.2481          0.1999          0.2563           0.1974      0.2210
               0.2602         0.2602            0.2601          0.2138          0.2703           0.2123      0.2343
               0.2719         0.2719            0.2718          0.2293          0.2838           0.2284      0.2526
               0.2823         0.2824            0.2822          0.2398          0.2972           0.2455      0.2692
               0.2931         0.2931            0.2930          0.2473          0.3103           0.2587      0.2838
               0.3167         0.3168            0.3166          0.2714          0.3327           0.2765      0.3014
               0.3491         0.3492            0.3490          0.3011          0.3673           0.3034      0.3277
               0.3722         0.3722            0.3720          0.3267          0.3938           0.3325      0.3597
               0.3840         0.3840            0.3838          0.3404          0.4063           0.3454      0.3704
               0.4002         0.4003            0.4000          0.3525          0.4233           0.3679      0.3945
               0.4272         0.4273            0.4270          0.3758          0.4518           0.3898      0.4156
               0.4625         0.4626            0.4623          0.4096          0.4882           0.4159      0.4476
               0.5110         0.5110            0.5108          0.4563          0.5310           0.4584      0.4873
               0.5604         0.5604            0.5602          0.5081          0.5830           0.5076      0.5371
               0.5950         0.5950            0.5948          0.5514          0.6229           0.5364      0.5677
               0.6223         0.6223            0.6221          0.5794          0.6504           0.5622      0.5910
               0.6464         0.6464            0.6461          0.6088          0.6744           0.5753      0.6127
               0.6681         0.6682            0.6677          0.6329          0.6963           0.5968      0.6312
               0.6861         0.6861            0.6857          0.6557          0.7125           0.6107      0.6465
               0.7071         0.7071            0.7068          0.6866          0.7311           0.6245      0.6667
               0.7345         0.7345            0.7344          0.7107          0.7541           0.6429      0.6885
               0.7670         0.7670            0.7670          0.7365          0.7834           0.6599      0.7031
0.7996   0.7996   0.7999   0.7693   0.8125   0.6845   0.7194
    0.8333   0.8333   0.8333   0.7994   0.8430   0.7285   0.7599
    0.8574   0.8575   0.8572   0.8181   0.8642   0.7459   0.7972
    0.8787   0.8788   0.8783   0.8418   0.8838   0.7863   0.8407
    0.8967   0.8968   0.8962   0.8644   0.9028   0.8199   0.8604
    0.9168   0.9169   0.9165   0.8922   0.9218   0.8458   0.8950
    0.9355   0.9355   0.9352   0.9151   0.9395   0.8851   0.9244
    0.9537   0.9537   0.9533   0.9318   0.9559   0.9095   0.9402
    0.9629   0.9630   0.9628   0.9449   0.9675   0.9329   0.9481
    0.9763   0.9763   0.9762   0.9649   0.9802   0.9591   0.9683
    1.0000   1.0000   1.0000   1.0000   1.0000   1.0000   1.0000
    1.0223   1.0223   1.0223   1.0305   1.0236   1.0265   1.0223
    1.0366   1.0366   1.0368   1.0539   1.0432   1.0721   1.0533
    1.0568   1.0568   1.0570   1.0917   1.0643   1.1158   1.0847
    1.0817   1.0817   1.0819   1.1352   1.0920   1.1790   1.1296
    1.1133   1.1131   1.1141   1.2063   1.1270   1.2374   1.1806
    1.1479   1.1477   1.1491   1.2736   1.1652   1.2872   1.2214
    1.1734   1.1730   1.1751   1.3360   1.1971   1.3359   1.2350
    1.2298   1.2294   1.2316   1.4197   1.2256   1.3677   1.2746
    1.2187   1.2183   1.2204   1.4439   1.2435   1.3877   1.3568
    1.2358   1.2353   1.2379   1.4898   1.2560   1.4016   1.3241
    1.2569   1.2564   1.2594   1.5410   1.2733   1.4209   1.3424
    1.2820   1.2815   1.2844   1.5980   1.2945   1.4445   1.3647
    1.3088   1.3084   1.3105   1.6597   1.3178   1.4705   1.3892
    1.3362   1.3359   1.3378   1.7245   1.3415   1.4970   1.4143
.
Addendum: Direct Capital
Total      Defense     Nondefense
  0.1897      0.1623         0.2044
  0.1830      0.1725         0.2149
  0.1799      0.1772         0.2303
  0.1736      0.1731         0.2278
  0.1677      0.1675         0.2285
  0.1559      0.1557         0.2286
  0.1604      0.1595         0.2190
  0.1839      0.1796         0.2128
  0.2083      0.2009         0.2390
  0.2222      0.2117         0.2501
  0.2183      0.2107         0.2311
  0.2306      0.2278         0.2429
  0.2397      0.2380         0.2574
  0.2426      0.2407         0.2698
  0.2400      0.2383         0.2660
  0.2473      0.2465         0.2603
  0.2614      0.2611         0.2674
  0.2783      0.2780         0.2822
  0.2881      0.2878         0.2924
  0.2928      0.2926         0.2956
  0.2951      0.2945         0.3006
  0.2968      0.2960         0.3038
  0.2999      0.2988         0.3086
  0.3068      0.3056         0.3158
  0.3081      0.3050         0.3282
  0.3096      0.3056         0.3299
  0.3112      0.3082         0.3278
  0.3165      0.3134         0.3402
  0.3244      0.3212         0.3553
  0.3368      0.3339         0.3699
  0.3560      0.3522         0.3962
  0.3818      0.3759         0.4284
  0.4216      0.4166         0.4503
  0.4565      0.4541         0.4681
  0.4789      0.4747         0.4985
  0.5207      0.5099         0.5669
  0.5586      0.5464         0.6087
  0.5873      0.5773         0.6222
  0.6093      0.6013         0.6412
  0.6492      0.6449         0.6646
  0.6902      0.6867         0.7034
  0.7391      0.7326         0.7663
  0.7981      0.7911         0.8308
  0.8614      0.8569         0.8874
  0.9033      0.9038         0.8999
  0.9344      0.9396         0.9007
  0.9380      0.9427         0.9089
  0.9199      0.9204         0.9164
  0.9027      0.8992         0.9276
  0.8895      0.8806         0.9447
  0.8977      0.8875         0.9677
0.9121   0.9004   0.9867
0.9371   0.9249   1.0067
0.9484   0.9362   1.0013
0.9669   0.9574   1.0066
0.9880   0.9809   1.0168
1.0078   1.0003   1.0314
1.0186   1.0141   1.0309
1.0022   0.9982   1.0131
0.9913   0.9893   0.9983
0.9950   0.9961   0.9922
1.0000   1.0000   1.0000
0.9982   0.9952   1.0050
0.9879   0.9844   0.9960
0.9892   0.9884   0.9911
0.9972   0.9979   0.9949
1.0186   1.0196   1.0153
1.0354   1.0375   1.0283
1.0494   1.0534   1.0355
1.0745   1.0785   1.0604
1.0894   1.0942   1.0757
1.1005   1.1052   1.0864
1.1163   1.1204   1.1014
1.1355   1.1391   1.1197
1.1560   1.1596   1.1399
1.1768   1.1804   1.1604
Cost per 1,000 Gallons to pump groundwater
                            2009
     2008       0.45       $0.46
     2005       0.23       $0.25
     2006       0.31       $0.33

Average        2009       $0.35
                          $0.20
                          $0.10
                          $0.36
                          $0.36

More Related Content

Viewers also liked

Okavango Benefit (Cost) Sharing Presentation
Okavango Benefit (Cost) Sharing PresentationOkavango Benefit (Cost) Sharing Presentation
Okavango Benefit (Cost) Sharing PresentationIwl Pcu
 
Day 1, Session 1: The Role of Policy Analysis for Informing the Agricultural ...
Day 1, Session 1: The Role of Policy Analysis for Informing the Agricultural ...Day 1, Session 1: The Role of Policy Analysis for Informing the Agricultural ...
Day 1, Session 1: The Role of Policy Analysis for Informing the Agricultural ...IFPRI-NSSP
 
Day 2, Session 1, Part 1: Unlocking Agricultural Growth through Technology an...
Day 2, Session 1, Part 1: Unlocking Agricultural Growth through Technology an...Day 2, Session 1, Part 1: Unlocking Agricultural Growth through Technology an...
Day 2, Session 1, Part 1: Unlocking Agricultural Growth through Technology an...IFPRI-NSSP
 
Food security as a public good
Food security as a public goodFood security as a public good
Food security as a public goodHemesiri Kotagama
 
Whole farm modelling farmer decision behaviour
Whole farm modelling farmer decision behaviourWhole farm modelling farmer decision behaviour
Whole farm modelling farmer decision behaviourDaniel Sandars
 
Evaluating extension reforms implications for nigeria
Evaluating extension reforms   implications for nigeriaEvaluating extension reforms   implications for nigeria
Evaluating extension reforms implications for nigeriaIFPRI-NSSP
 
Texas Project for Ag Water Efficiency - From River to Farm
Texas Project for Ag Water Efficiency - From River to FarmTexas Project for Ag Water Efficiency - From River to Farm
Texas Project for Ag Water Efficiency - From River to FarmThe Texas Network, LLC
 
Economic incentieves and water demand mamangent 2
Economic incentieves and water demand mamangent 2Economic incentieves and water demand mamangent 2
Economic incentieves and water demand mamangent 2Hemesiri Kotagama
 
Improving Agriculture Water Productivity in the Region “Investment in Irrigat...
Improving Agriculture Water Productivity in the Region“Investment in Irrigat...Improving Agriculture Water Productivity in the Region“Investment in Irrigat...
Improving Agriculture Water Productivity in the Region “Investment in Irrigat...FAO
 
Benifit cost analysis
Benifit cost analysisBenifit cost analysis
Benifit cost analysisjnujaipur
 
Presentation 1 falck zepeda introduction to socioeconomics
Presentation 1 falck zepeda introduction to socioeconomicsPresentation 1 falck zepeda introduction to socioeconomics
Presentation 1 falck zepeda introduction to socioeconomicsJose Falck Zepeda
 
Cost Benefit Analysis
Cost Benefit AnalysisCost Benefit Analysis
Cost Benefit AnalysisWisconsinF2S
 
Social Benefit Analysis of Modern Wholesale Markets
Social Benefit Analysis of Modern Wholesale MarketsSocial Benefit Analysis of Modern Wholesale Markets
Social Benefit Analysis of Modern Wholesale MarketsKomal03
 
A Community Project For Aquaculture in Kenya
A Community Project For Aquaculture in KenyaA Community Project For Aquaculture in Kenya
A Community Project For Aquaculture in Kenyamaymayli
 

Viewers also liked (20)

Are you brave enough? Economic evaluation of climate change adaptation projects
Are you brave enough? Economic evaluation of climate change adaptation projectsAre you brave enough? Economic evaluation of climate change adaptation projects
Are you brave enough? Economic evaluation of climate change adaptation projects
 
Okavango Benefit (Cost) Sharing Presentation
Okavango Benefit (Cost) Sharing PresentationOkavango Benefit (Cost) Sharing Presentation
Okavango Benefit (Cost) Sharing Presentation
 
Institutional analysis in the Indo-Ganges basin
Institutional analysis in the Indo-Ganges basinInstitutional analysis in the Indo-Ganges basin
Institutional analysis in the Indo-Ganges basin
 
Day 1, Session 1: The Role of Policy Analysis for Informing the Agricultural ...
Day 1, Session 1: The Role of Policy Analysis for Informing the Agricultural ...Day 1, Session 1: The Role of Policy Analysis for Informing the Agricultural ...
Day 1, Session 1: The Role of Policy Analysis for Informing the Agricultural ...
 
Feasibility of itq
Feasibility of itqFeasibility of itq
Feasibility of itq
 
Day 2, Session 1, Part 1: Unlocking Agricultural Growth through Technology an...
Day 2, Session 1, Part 1: Unlocking Agricultural Growth through Technology an...Day 2, Session 1, Part 1: Unlocking Agricultural Growth through Technology an...
Day 2, Session 1, Part 1: Unlocking Agricultural Growth through Technology an...
 
Food security as a public good
Food security as a public goodFood security as a public good
Food security as a public good
 
Calculating economic value to producers mc clellan
Calculating economic value to producers   mc clellanCalculating economic value to producers   mc clellan
Calculating economic value to producers mc clellan
 
Whole farm modelling farmer decision behaviour
Whole farm modelling farmer decision behaviourWhole farm modelling farmer decision behaviour
Whole farm modelling farmer decision behaviour
 
Evaluating extension reforms implications for nigeria
Evaluating extension reforms   implications for nigeriaEvaluating extension reforms   implications for nigeria
Evaluating extension reforms implications for nigeria
 
Texas Project for Ag Water Efficiency - From River to Farm
Texas Project for Ag Water Efficiency - From River to FarmTexas Project for Ag Water Efficiency - From River to Farm
Texas Project for Ag Water Efficiency - From River to Farm
 
Economic incentieves and water demand mamangent 2
Economic incentieves and water demand mamangent 2Economic incentieves and water demand mamangent 2
Economic incentieves and water demand mamangent 2
 
Improving Agriculture Water Productivity in the Region “Investment in Irrigat...
Improving Agriculture Water Productivity in the Region“Investment in Irrigat...Improving Agriculture Water Productivity in the Region“Investment in Irrigat...
Improving Agriculture Water Productivity in the Region “Investment in Irrigat...
 
Decisions, Decisions: What Policymakers Need to Know About Cost-Benefit Analysis
Decisions, Decisions: What Policymakers Need to Know About Cost-Benefit AnalysisDecisions, Decisions: What Policymakers Need to Know About Cost-Benefit Analysis
Decisions, Decisions: What Policymakers Need to Know About Cost-Benefit Analysis
 
Benifit cost analysis
Benifit cost analysisBenifit cost analysis
Benifit cost analysis
 
Presentation 1 falck zepeda introduction to socioeconomics
Presentation 1 falck zepeda introduction to socioeconomicsPresentation 1 falck zepeda introduction to socioeconomics
Presentation 1 falck zepeda introduction to socioeconomics
 
Integrated Hydrologic - Economic modelling of river basins
Integrated Hydrologic - Economic modelling of river basinsIntegrated Hydrologic - Economic modelling of river basins
Integrated Hydrologic - Economic modelling of river basins
 
Cost Benefit Analysis
Cost Benefit AnalysisCost Benefit Analysis
Cost Benefit Analysis
 
Social Benefit Analysis of Modern Wholesale Markets
Social Benefit Analysis of Modern Wholesale MarketsSocial Benefit Analysis of Modern Wholesale Markets
Social Benefit Analysis of Modern Wholesale Markets
 
A Community Project For Aquaculture in Kenya
A Community Project For Aquaculture in KenyaA Community Project For Aquaculture in Kenya
A Community Project For Aquaculture in Kenya
 

Similar to Reclaimed_Water_BC_Calculator_Irrigation

Lecture 2 hydrological and demand survey
Lecture 2 hydrological and demand survey Lecture 2 hydrological and demand survey
Lecture 2 hydrological and demand survey shahabuddin khan
 
Page 324, problems 46, 4846. For the PAC1 counter, which p.docx
Page 324, problems 46, 4846. For the PAC1 counter, which p.docxPage 324, problems 46, 4846. For the PAC1 counter, which p.docx
Page 324, problems 46, 4846. For the PAC1 counter, which p.docxalfred4lewis58146
 
Energy-Balance-Assessment-Tool-current (uploaded).xlsm.pdf
Energy-Balance-Assessment-Tool-current (uploaded).xlsm.pdfEnergy-Balance-Assessment-Tool-current (uploaded).xlsm.pdf
Energy-Balance-Assessment-Tool-current (uploaded).xlsm.pdfAnjum9869
 
Water Indicators
Water IndicatorsWater Indicators
Water IndicatorsFAO
 
Non Revenue Water Reduction- A Tool for Achiving 24x7 Water Supply
Non Revenue Water Reduction- A Tool for Achiving 24x7 Water SupplyNon Revenue Water Reduction- A Tool for Achiving 24x7 Water Supply
Non Revenue Water Reduction- A Tool for Achiving 24x7 Water SupplyIOSR Journals
 
Calculator Overview97 2003
Calculator Overview97 2003Calculator Overview97 2003
Calculator Overview97 2003JeromeLengkeek
 
The Rate Setting Process
The Rate Setting ProcessThe Rate Setting Process
The Rate Setting ProcessRishi Kumar
 
SDG target 6.4: water use efficiency and water stress indicators
SDG target 6.4: water use efficiency and water stress indicatorsSDG target 6.4: water use efficiency and water stress indicators
SDG target 6.4: water use efficiency and water stress indicatorsFAO
 
3-The SHARE main objective
3-The SHARE main objective3-The SHARE main objective
3-The SHARE main objectiveSHAREPROJECT
 
Product optimization by scheduling formulation & optimal storage strategy...
Product optimization by scheduling formulation & optimal storage strategy...Product optimization by scheduling formulation & optimal storage strategy...
Product optimization by scheduling formulation & optimal storage strategy...eSAT Journals
 
How to perform a commercial water audit
How to perform a commercial water auditHow to perform a commercial water audit
How to perform a commercial water auditTroy Aichele
 
Group Project to Design Water Infrastructure for a Theoretical Small Town.
Group Project to Design Water Infrastructure for a Theoretical Small Town.Group Project to Design Water Infrastructure for a Theoretical Small Town.
Group Project to Design Water Infrastructure for a Theoretical Small Town.Jonathan Damora
 
Download-manuals-ground water-manual-gw-volume8operationmanualdataprocessing...
 Download-manuals-ground water-manual-gw-volume8operationmanualdataprocessing... Download-manuals-ground water-manual-gw-volume8operationmanualdataprocessing...
Download-manuals-ground water-manual-gw-volume8operationmanualdataprocessing...hydrologyproject001
 
LA Energy and Water Efficiency Statistics using Tableau
LA Energy and Water Efficiency Statistics using TableauLA Energy and Water Efficiency Statistics using Tableau
LA Energy and Water Efficiency Statistics using TableauMonika Mishra
 
05 Water and Energy
05 Water and Energy05 Water and Energy
05 Water and EnergyJill Watkins
 
Design and Estimation of Rain Water Harvesting Scheme in VIVA Institute of T...
Design and Estimation of Rain Water Harvesting Scheme in VIVA  Institute of T...Design and Estimation of Rain Water Harvesting Scheme in VIVA  Institute of T...
Design and Estimation of Rain Water Harvesting Scheme in VIVA Institute of T...vivatechijri
 
Final Report - Updating Groundwater and Salinity Maps_June_22_2016 (2)
Final Report  - Updating Groundwater and Salinity Maps_June_22_2016 (2)Final Report  - Updating Groundwater and Salinity Maps_June_22_2016 (2)
Final Report - Updating Groundwater and Salinity Maps_June_22_2016 (2)Stephen Olubunmi Fadeyi
 

Similar to Reclaimed_Water_BC_Calculator_Irrigation (20)

Lecture 2 hydrological and demand survey
Lecture 2 hydrological and demand survey Lecture 2 hydrological and demand survey
Lecture 2 hydrological and demand survey
 
Page 324, problems 46, 4846. For the PAC1 counter, which p.docx
Page 324, problems 46, 4846. For the PAC1 counter, which p.docxPage 324, problems 46, 4846. For the PAC1 counter, which p.docx
Page 324, problems 46, 4846. For the PAC1 counter, which p.docx
 
Energy-Balance-Assessment-Tool-current (uploaded).xlsm.pdf
Energy-Balance-Assessment-Tool-current (uploaded).xlsm.pdfEnergy-Balance-Assessment-Tool-current (uploaded).xlsm.pdf
Energy-Balance-Assessment-Tool-current (uploaded).xlsm.pdf
 
Water Indicators
Water IndicatorsWater Indicators
Water Indicators
 
Non Revenue Water Reduction- A Tool for Achiving 24x7 Water Supply
Non Revenue Water Reduction- A Tool for Achiving 24x7 Water SupplyNon Revenue Water Reduction- A Tool for Achiving 24x7 Water Supply
Non Revenue Water Reduction- A Tool for Achiving 24x7 Water Supply
 
Water conservation and reuse strategies
Water conservation and reuse strategiesWater conservation and reuse strategies
Water conservation and reuse strategies
 
Calculator Overview97 2003
Calculator Overview97 2003Calculator Overview97 2003
Calculator Overview97 2003
 
The Rate Setting Process
The Rate Setting ProcessThe Rate Setting Process
The Rate Setting Process
 
SDG target 6.4: water use efficiency and water stress indicators
SDG target 6.4: water use efficiency and water stress indicatorsSDG target 6.4: water use efficiency and water stress indicators
SDG target 6.4: water use efficiency and water stress indicators
 
3-The SHARE main objective
3-The SHARE main objective3-The SHARE main objective
3-The SHARE main objective
 
Product optimization by scheduling formulation & optimal storage strategy...
Product optimization by scheduling formulation & optimal storage strategy...Product optimization by scheduling formulation & optimal storage strategy...
Product optimization by scheduling formulation & optimal storage strategy...
 
How to perform a commercial water audit
How to perform a commercial water auditHow to perform a commercial water audit
How to perform a commercial water audit
 
Group Project to Design Water Infrastructure for a Theoretical Small Town.
Group Project to Design Water Infrastructure for a Theoretical Small Town.Group Project to Design Water Infrastructure for a Theoretical Small Town.
Group Project to Design Water Infrastructure for a Theoretical Small Town.
 
Ssssss
SsssssSsssss
Ssssss
 
Download-manuals-ground water-manual-gw-volume8operationmanualdataprocessing...
 Download-manuals-ground water-manual-gw-volume8operationmanualdataprocessing... Download-manuals-ground water-manual-gw-volume8operationmanualdataprocessing...
Download-manuals-ground water-manual-gw-volume8operationmanualdataprocessing...
 
LA Energy and Water Efficiency Statistics using Tableau
LA Energy and Water Efficiency Statistics using TableauLA Energy and Water Efficiency Statistics using Tableau
LA Energy and Water Efficiency Statistics using Tableau
 
05 Water and Energy
05 Water and Energy05 Water and Energy
05 Water and Energy
 
Design and Estimation of Rain Water Harvesting Scheme in VIVA Institute of T...
Design and Estimation of Rain Water Harvesting Scheme in VIVA  Institute of T...Design and Estimation of Rain Water Harvesting Scheme in VIVA  Institute of T...
Design and Estimation of Rain Water Harvesting Scheme in VIVA Institute of T...
 
Next Gen Filton Airfield, UK
Next Gen Filton Airfield, UKNext Gen Filton Airfield, UK
Next Gen Filton Airfield, UK
 
Final Report - Updating Groundwater and Salinity Maps_June_22_2016 (2)
Final Report  - Updating Groundwater and Salinity Maps_June_22_2016 (2)Final Report  - Updating Groundwater and Salinity Maps_June_22_2016 (2)
Final Report - Updating Groundwater and Salinity Maps_June_22_2016 (2)
 

More from Quickoffice Test (20)

call02
call02call02
call02
 
call03
call03call03
call03
 
call06
call06call06
call06
 
call07
call07call07
call07
 
test
testtest
test
 
EGNYTE
EGNYTEEGNYTE
EGNYTE
 
egnyte rename
egnyte renameegnyte rename
egnyte rename
 
A
AA
A
 
Quickword How To
Quickword How ToQuickword How To
Quickword How To
 
evi
evievi
evi
 
Docx test
Docx testDocx test
Docx test
 
Presentation
PresentationPresentation
Presentation
 
april
aprilapril
april
 
April
AprilApril
April
 
April
AprilApril
April
 
April
AprilApril
April
 
test
testtest
test
 
!!!zzz To
!!!zzz To!!!zzz To
!!!zzz To
 
!!!zzz itttest1
!!!zzz itttest1!!!zzz itttest1
!!!zzz itttest1
 
mac_pp_2011
mac_pp_2011mac_pp_2011
mac_pp_2011
 

Recently uploaded

A Deep Dive on Passkeys: FIDO Paris Seminar.pptx
A Deep Dive on Passkeys: FIDO Paris Seminar.pptxA Deep Dive on Passkeys: FIDO Paris Seminar.pptx
A Deep Dive on Passkeys: FIDO Paris Seminar.pptxLoriGlavin3
 
Why device, WIFI, and ISP insights are crucial to supporting remote Microsoft...
Why device, WIFI, and ISP insights are crucial to supporting remote Microsoft...Why device, WIFI, and ISP insights are crucial to supporting remote Microsoft...
Why device, WIFI, and ISP insights are crucial to supporting remote Microsoft...panagenda
 
Digital Identity is Under Attack: FIDO Paris Seminar.pptx
Digital Identity is Under Attack: FIDO Paris Seminar.pptxDigital Identity is Under Attack: FIDO Paris Seminar.pptx
Digital Identity is Under Attack: FIDO Paris Seminar.pptxLoriGlavin3
 
From Family Reminiscence to Scholarly Archive .
From Family Reminiscence to Scholarly Archive .From Family Reminiscence to Scholarly Archive .
From Family Reminiscence to Scholarly Archive .Alan Dix
 
Unleashing Real-time Insights with ClickHouse_ Navigating the Landscape in 20...
Unleashing Real-time Insights with ClickHouse_ Navigating the Landscape in 20...Unleashing Real-time Insights with ClickHouse_ Navigating the Landscape in 20...
Unleashing Real-time Insights with ClickHouse_ Navigating the Landscape in 20...Alkin Tezuysal
 
Passkey Providers and Enabling Portability: FIDO Paris Seminar.pptx
Passkey Providers and Enabling Portability: FIDO Paris Seminar.pptxPasskey Providers and Enabling Portability: FIDO Paris Seminar.pptx
Passkey Providers and Enabling Portability: FIDO Paris Seminar.pptxLoriGlavin3
 
The State of Passkeys with FIDO Alliance.pptx
The State of Passkeys with FIDO Alliance.pptxThe State of Passkeys with FIDO Alliance.pptx
The State of Passkeys with FIDO Alliance.pptxLoriGlavin3
 
Scale your database traffic with Read & Write split using MySQL Router
Scale your database traffic with Read & Write split using MySQL RouterScale your database traffic with Read & Write split using MySQL Router
Scale your database traffic with Read & Write split using MySQL RouterMydbops
 
The Future Roadmap for the Composable Data Stack - Wes McKinney - Data Counci...
The Future Roadmap for the Composable Data Stack - Wes McKinney - Data Counci...The Future Roadmap for the Composable Data Stack - Wes McKinney - Data Counci...
The Future Roadmap for the Composable Data Stack - Wes McKinney - Data Counci...Wes McKinney
 
(How to Program) Paul Deitel, Harvey Deitel-Java How to Program, Early Object...
(How to Program) Paul Deitel, Harvey Deitel-Java How to Program, Early Object...(How to Program) Paul Deitel, Harvey Deitel-Java How to Program, Early Object...
(How to Program) Paul Deitel, Harvey Deitel-Java How to Program, Early Object...AliaaTarek5
 
Rise of the Machines: Known As Drones...
Rise of the Machines: Known As Drones...Rise of the Machines: Known As Drones...
Rise of the Machines: Known As Drones...Rick Flair
 
UiPath Community: Communication Mining from Zero to Hero
UiPath Community: Communication Mining from Zero to HeroUiPath Community: Communication Mining from Zero to Hero
UiPath Community: Communication Mining from Zero to HeroUiPathCommunity
 
The Role of FIDO in a Cyber Secure Netherlands: FIDO Paris Seminar.pptx
The Role of FIDO in a Cyber Secure Netherlands: FIDO Paris Seminar.pptxThe Role of FIDO in a Cyber Secure Netherlands: FIDO Paris Seminar.pptx
The Role of FIDO in a Cyber Secure Netherlands: FIDO Paris Seminar.pptxLoriGlavin3
 
Data governance with Unity Catalog Presentation
Data governance with Unity Catalog PresentationData governance with Unity Catalog Presentation
Data governance with Unity Catalog PresentationKnoldus Inc.
 
DevEX - reference for building teams, processes, and platforms
DevEX - reference for building teams, processes, and platformsDevEX - reference for building teams, processes, and platforms
DevEX - reference for building teams, processes, and platformsSergiu Bodiu
 
Generative Artificial Intelligence: How generative AI works.pdf
Generative Artificial Intelligence: How generative AI works.pdfGenerative Artificial Intelligence: How generative AI works.pdf
Generative Artificial Intelligence: How generative AI works.pdfIngrid Airi González
 
Connecting the Dots for Information Discovery.pdf
Connecting the Dots for Information Discovery.pdfConnecting the Dots for Information Discovery.pdf
Connecting the Dots for Information Discovery.pdfNeo4j
 
Take control of your SAP testing with UiPath Test Suite
Take control of your SAP testing with UiPath Test SuiteTake control of your SAP testing with UiPath Test Suite
Take control of your SAP testing with UiPath Test SuiteDianaGray10
 
Manual 508 Accessibility Compliance Audit
Manual 508 Accessibility Compliance AuditManual 508 Accessibility Compliance Audit
Manual 508 Accessibility Compliance AuditSkynet Technologies
 
Use of FIDO in the Payments and Identity Landscape: FIDO Paris Seminar.pptx
Use of FIDO in the Payments and Identity Landscape: FIDO Paris Seminar.pptxUse of FIDO in the Payments and Identity Landscape: FIDO Paris Seminar.pptx
Use of FIDO in the Payments and Identity Landscape: FIDO Paris Seminar.pptxLoriGlavin3
 

Recently uploaded (20)

A Deep Dive on Passkeys: FIDO Paris Seminar.pptx
A Deep Dive on Passkeys: FIDO Paris Seminar.pptxA Deep Dive on Passkeys: FIDO Paris Seminar.pptx
A Deep Dive on Passkeys: FIDO Paris Seminar.pptx
 
Why device, WIFI, and ISP insights are crucial to supporting remote Microsoft...
Why device, WIFI, and ISP insights are crucial to supporting remote Microsoft...Why device, WIFI, and ISP insights are crucial to supporting remote Microsoft...
Why device, WIFI, and ISP insights are crucial to supporting remote Microsoft...
 
Digital Identity is Under Attack: FIDO Paris Seminar.pptx
Digital Identity is Under Attack: FIDO Paris Seminar.pptxDigital Identity is Under Attack: FIDO Paris Seminar.pptx
Digital Identity is Under Attack: FIDO Paris Seminar.pptx
 
From Family Reminiscence to Scholarly Archive .
From Family Reminiscence to Scholarly Archive .From Family Reminiscence to Scholarly Archive .
From Family Reminiscence to Scholarly Archive .
 
Unleashing Real-time Insights with ClickHouse_ Navigating the Landscape in 20...
Unleashing Real-time Insights with ClickHouse_ Navigating the Landscape in 20...Unleashing Real-time Insights with ClickHouse_ Navigating the Landscape in 20...
Unleashing Real-time Insights with ClickHouse_ Navigating the Landscape in 20...
 
Passkey Providers and Enabling Portability: FIDO Paris Seminar.pptx
Passkey Providers and Enabling Portability: FIDO Paris Seminar.pptxPasskey Providers and Enabling Portability: FIDO Paris Seminar.pptx
Passkey Providers and Enabling Portability: FIDO Paris Seminar.pptx
 
The State of Passkeys with FIDO Alliance.pptx
The State of Passkeys with FIDO Alliance.pptxThe State of Passkeys with FIDO Alliance.pptx
The State of Passkeys with FIDO Alliance.pptx
 
Scale your database traffic with Read & Write split using MySQL Router
Scale your database traffic with Read & Write split using MySQL RouterScale your database traffic with Read & Write split using MySQL Router
Scale your database traffic with Read & Write split using MySQL Router
 
The Future Roadmap for the Composable Data Stack - Wes McKinney - Data Counci...
The Future Roadmap for the Composable Data Stack - Wes McKinney - Data Counci...The Future Roadmap for the Composable Data Stack - Wes McKinney - Data Counci...
The Future Roadmap for the Composable Data Stack - Wes McKinney - Data Counci...
 
(How to Program) Paul Deitel, Harvey Deitel-Java How to Program, Early Object...
(How to Program) Paul Deitel, Harvey Deitel-Java How to Program, Early Object...(How to Program) Paul Deitel, Harvey Deitel-Java How to Program, Early Object...
(How to Program) Paul Deitel, Harvey Deitel-Java How to Program, Early Object...
 
Rise of the Machines: Known As Drones...
Rise of the Machines: Known As Drones...Rise of the Machines: Known As Drones...
Rise of the Machines: Known As Drones...
 
UiPath Community: Communication Mining from Zero to Hero
UiPath Community: Communication Mining from Zero to HeroUiPath Community: Communication Mining from Zero to Hero
UiPath Community: Communication Mining from Zero to Hero
 
The Role of FIDO in a Cyber Secure Netherlands: FIDO Paris Seminar.pptx
The Role of FIDO in a Cyber Secure Netherlands: FIDO Paris Seminar.pptxThe Role of FIDO in a Cyber Secure Netherlands: FIDO Paris Seminar.pptx
The Role of FIDO in a Cyber Secure Netherlands: FIDO Paris Seminar.pptx
 
Data governance with Unity Catalog Presentation
Data governance with Unity Catalog PresentationData governance with Unity Catalog Presentation
Data governance with Unity Catalog Presentation
 
DevEX - reference for building teams, processes, and platforms
DevEX - reference for building teams, processes, and platformsDevEX - reference for building teams, processes, and platforms
DevEX - reference for building teams, processes, and platforms
 
Generative Artificial Intelligence: How generative AI works.pdf
Generative Artificial Intelligence: How generative AI works.pdfGenerative Artificial Intelligence: How generative AI works.pdf
Generative Artificial Intelligence: How generative AI works.pdf
 
Connecting the Dots for Information Discovery.pdf
Connecting the Dots for Information Discovery.pdfConnecting the Dots for Information Discovery.pdf
Connecting the Dots for Information Discovery.pdf
 
Take control of your SAP testing with UiPath Test Suite
Take control of your SAP testing with UiPath Test SuiteTake control of your SAP testing with UiPath Test Suite
Take control of your SAP testing with UiPath Test Suite
 
Manual 508 Accessibility Compliance Audit
Manual 508 Accessibility Compliance AuditManual 508 Accessibility Compliance Audit
Manual 508 Accessibility Compliance Audit
 
Use of FIDO in the Payments and Identity Landscape: FIDO Paris Seminar.pptx
Use of FIDO in the Payments and Identity Landscape: FIDO Paris Seminar.pptxUse of FIDO in the Payments and Identity Landscape: FIDO Paris Seminar.pptx
Use of FIDO in the Payments and Identity Landscape: FIDO Paris Seminar.pptx
 

Reclaimed_Water_BC_Calculator_Irrigation

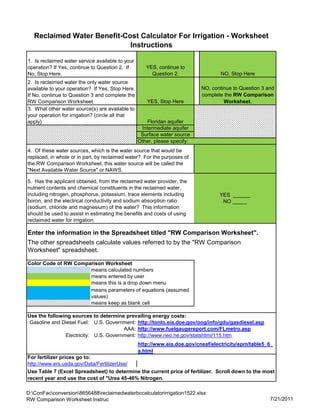
  • 1. Reclaimed Water Benefit-Cost Calculator For Irrigation - Worksheet Instructions 1. Is reclaimed water service available to your operation? If Yes, continue to Question 2. If YES, continue to No, Stop Here. Question 2. NO, Stop Here 2. Is reclaimed water the only water source available to your operation? If Yes, Stop Here. NO, continue to Question 3 and If No, continue to Question 3 and complete the complete the RW Comparison RW Comparison Worksheet. YES, Stop Here Worksheet. 3. What other water source(s) are available to your operation for irrigation? (circle all that apply) Floridan aquifer Intermediate aquifer Surface water source Other, please specify: 4. Of these water sources, which is the water source that would be replaced, in whole or in part, by reclaimed water? For the purposes of the RW Comparison Worksheet, this water source will be called the "Next Available Water Source" or NAWS. 5. Has the applicant obtained, from the reclaimed water provider, the nutrient contents and chemical constituents in the reclaimed water, including nitrogen, phosphorus, potassium, trace elements including YES ______ boron, and the electrical conductivity and sodium absorption ratio NO _____ (sodium, chloride and magnesium) of the water? This information should be used to assist in estimating the benefits and costs of using reclaimed water for irrigation. Enter the information in the Spreadsheet titled "RW Comparison Worksheet". The other spreadsheets calculate values referred to by the "RW Comparison Worksheet" spreadsheet. Color Code of RW Comparison Worksheet means calculated numbers means entered by user means this is a drop down menu means parameters of equations (assumed values) means keep as blank cell Use the following sources to determine prevailing energy costs: Gasoline and Diesel Fuel: U.S. Government: http://tonto.eia.doe.gov/oog/info/gdu/gasdiesel.asp AAA: http://www.fuelgaugereport.com/FLmetro.asp Electricity: U.S. Government: http://www.neo.ne.gov/statshtml/115.htm http://www.eia.doe.gov/cneaf/electricity/epm/table5_6_ a.html For fertilizer prices go to: http://www.ers.usda.gov/Data/FertilizerUse/ Use Table 7 (Excel Spreadsheet) to determine the current price of fertilizer. Scroll down to the most recent year and use the cost of "Urea 45-46% Nitrogen. D:ConFacconversion8656488reclaimedwaterbccalculatorirrigation1522.xlsx RW Comparison Worksheet Instruc 7/21/2011
  • 2. Prepared by: Hazen and Sawyer, July 8, 2010 D:ConFacconversion8656488reclaimedwaterbccalculatorirrigation1522.xlsx RW Comparison Worksheet Instruc 7/21/2011
  • 3. MODEL DISCLAIMER The Reclaimed Water Benefit-Cost Calculator for Irrigation is to be used to provide guidance as to the economic feasibility of using reclaimed water for a specific purpose. The values that the user will input into the model are estimates and the model results should not be the only factor in determining economic feasibility. Instead, the model results should be viewed in the proper context of all other information submitted and relevant to the water use permit application or renewal. The example values used in the models and referenced in the accompanying report are purely illustrative for the purposes of this study presentation only. Readers and users are advised to develop proper estimates of costs and benefits that would be appropriate for their individual site(s). Except where explicitly directed (e.g. , to obtain the proper values of nitrogen fertilizer and fuel costs from specific websites), the example values provided in the model and in this report are NOT “default” values. For information regarding how to use this Reclaimed Water Benefit-Cost Calculator for Irrigation, please read Chapter 3.0 Reclaimed Water Benefit-Cost Evaluation for Irrigation Uses found in the document titled "Economic Feasibility of Reclaimed Water Use by Non-Utility Water Use Permittees and Applicants", Final Report, June 2010, prepared by Hazen and Sawyer for the Southwest Florida Water Management District, Brooksville, Florida. D:ConFacconversion8656488reclaimedwaterbccalculatorirrigation1522.xlsx RW Comparison Worksheet Instruc 7/21/2011
  • 4. Reclaimed Water Benefit Cost Calculator for Irrigation Economic Comparison of Reclaimed Water Versus Next Available Water Source For Irrigation by Agricultural, Recreation and Aesthetic Water Users Reclaimed Water NAWS Minus Used Instead & RW/Other Next Available Other Sources if (Except A. which Row Water Source Applicable is RW/Other No. Benefit or Cost Item (NAWS) (RW/Other) minus NAWS) (1) (2) (3) (4) (5) Name of Next Available Water Source / Name 1 of Reclaimed Water Provider Floridan Aquifer Utility Name A. Amount of Water Needed and Available in million gallons (mg) - 2 Annual 74.00 84.00 10.00 3 B. Installation Costs (if not already installed or replaced) (a) (a) The replacement cost of existing items within five years of the end of their useful lives should be included in this list as if purchased new. The remaining or "salvage" value of these existing items may be entered as indicated below. Do not forget to consider the cost of the backup water supply in Column (4) should reclaimed water be temporarily unavailable. The user may enter all appropriate names of cost items in Column (2), Rows 4 5 to 12. 5 Pipes and Pumps $1,000 $2,000 6 Storage $2,000 $3,000 Filtration system (if needed for drip/microjet irrigation 7 system) $3,000 $4,000 8 Land Development not included in items above $4,000 $5,000 9 Item 1: $0 $0 10 Item 2: $6,000 $7,000 11 Item 3: $7,000 $8,000 12 Item 4: $8,000 $9,000 Salvage Value of Existing Items that are replaced and included above (enter value as a negative number). It is included as 1/5th of this value in 13 Total Annualized Installation Cost below. -$2,000 $0 14 Total Installation Cost $29,000 $38,000 15 Annual Interest Rate (i.e. 6%) 6.00% 6.00% 16 Useful Life of Items in Years 17 Pipes and Pumps 10 10 18 Storage 20 20 Filtration system (if needed for drip/microjet irrigation 19 system) 7 7 20 Land Development not included in items above 20 20 21 Item 1: 10 10 22 Item 2: 10 10 23 Item 3: 10 10 24 Item 4: 10 10 25 Total Annualized Installation Cost $3,650 $4,947 -$1,297 D:ConFacconversion8656488reclaimedwaterbccalculatorirrigation1522.xlsx RW Comparison Worksheet 7/21/2011
  • 5. Reclaimed Water Benefit Cost Calculator for Irrigation Economic Comparison of Reclaimed Water Versus Next Available Water Source For Irrigation by Agricultural, Recreation and Aesthetic Water Users Reclaimed Water NAWS Minus Used Instead & RW/Other Next Available Other Sources if (Except A. which Row Water Source Applicable is RW/Other No. Benefit or Cost Item (NAWS) (RW/Other) minus NAWS) (1) (2) (3) (4) (5) Total Annualized Installation Cost per 26 1,000 Gallons of Water $0.05 $0.06 -$0.02 D:ConFacconversion8656488reclaimedwaterbccalculatorirrigation1522.xlsx RW Comparison Worksheet 7/21/2011
  • 6. Reclaimed Water Benefit Cost Calculator for Irrigation Economic Comparison of Reclaimed Water Versus Next Available Water Source For Irrigation by Agricultural, Recreation and Aesthetic Water Users Reclaimed Water NAWS Minus Used Instead & RW/Other Next Available Other Sources if (Except A. which Row Water Source Applicable is RW/Other No. Benefit or Cost Item (NAWS) (RW/Other) minus NAWS) (1) (2) (3) (4) (5) 27 C. Annual O&M Costs 28 1.0 Payments to Reclaimed Water Utility and, if applicable, to NAWS Water Utility 29 Annual Fixed Payment $0.00 $144.00 30 Price per 1,000 gallons $0.00 $0.05 31 Total Utility Payment - Annual $0 $4,344 -$4,344.00 32 2.0 Irrigation Pumping Energy Cost - Annual 33 Energy Source: Electricity Electricity 34 Total Dynamic Head in Feet: 300 30 35 Cost of energy source, Dollars per KWH or gallon (obtain 36 from appropriate web site): $0.11 $0.11 37 Energy cost to pump 1 Kgal: $0.16 $0.02 $0.15 38 Total irrigation pumping energy cost - Annual $12,069 $1,370 $10,699 39 3.0 Irrigation Maintenance Labor Cost - Annual 40 Labor Cost per Hour: $10.00 $10.00 41 Pumping System Labor Hours: 52 26 Irrigation System Labor Hours (include relevant issues such as fungus and algae management that involve repairing tubes and cleaning jets, maintaining 42 storage pond): 156 208 43 Salinity or pH management Labor Hours: 20 52 44 Total Maintenance Labor Cost - Annual $2,280 $2,860 -$580 4.0 Annual Cost of Chemicals To Manage Irrigation Water or Soil, other than Nitrogen, specify chemical 45 name 46 Gypsum $2,000 $5,000 -$3,000 47 Chemical Name: $0 $0 $0 48 Chemical Name: $0 $0 $0 49 5.0 Reporting or Record Keeping Costs - Annual $500 $1,500 -$1,000 50 6.0 Other Annual Costs, specify below 51 Item A: $0 $0 $0 52 Item B: $0 $0 $0 53 Item C $0 $0 $0 54 Total Annual O&M Cost $16,849 $15,074 $1,775 Total Annual O&M Cost per 1,000 Gallons 55 of Irrigation Water $0.23 $0.18 $0.02 D:ConFacconversion8656488reclaimedwaterbccalculatorirrigation1522.xlsx RW Comparison Worksheet 7/21/2011
  • 7. Reclaimed Water Benefit Cost Calculator for Irrigation Economic Comparison of Reclaimed Water Versus Next Available Water Source For Irrigation by Agricultural, Recreation and Aesthetic Water Users Reclaimed Water NAWS Minus Used Instead & RW/Other Next Available Other Sources if (Except A. which Row Water Source Applicable is RW/Other No. Benefit or Cost Item (NAWS) (RW/Other) minus NAWS) (1) (2) (3) (4) (5) 56 D. Recurring O&M Costs, Other than Annual 57 Filter Media Replacement $11,000 $11,000 58 Item a replaced: $0 $0 59 Item b replaced: $500 $3,000 60 Item c replaced: $400 $2,000 61 Item d replaced: $300 $1,000 62 Replacement Frequency - No. of Years 63 Filter Media Replacement 5 3 64 Item a replaced: 65 Item b replaced: 3 5 66 Item c replaced: 3 5 67 Item d replaced: 3 5 Total Annualized Recurring O&M 68 Cost $3,060 $5,540 -$2,479 Total Annualized Recurring O&M Cost per 69 1,000 Gallons of Irrigation Water $0.04 $0.07 -$0.03 D:ConFacconversion8656488reclaimedwaterbccalculatorirrigation1522.xlsx RW Comparison Worksheet 7/21/2011
  • 8. Reclaimed Water Benefit Cost Calculator for Irrigation Economic Comparison of Reclaimed Water Versus Next Available Water Source For Irrigation by Agricultural, Recreation and Aesthetic Water Users Reclaimed Water NAWS Minus Used Instead & RW/Other Next Available Other Sources if (Except A. which Row Water Source Applicable is RW/Other No. Benefit or Cost Item (NAWS) (RW/Other) minus NAWS) (1) (2) (3) (4) (5) 70 E. Nitrogen Fertilizer Cost Savings - Annual: 71 N Fertilizer Cost per Ton: $552 $552 Nitrogen concentration in ppm or mg/l of Irrigation Water (for reclaimed water, obtain from utility. For 72 NAWS, use available info or assume 0): 0 6 Percent of Nitrogen in water that is taken up by the 73 plant: 50% 50% Nitrogen Fertilizer Cost Savings Per 1,000 74 gallons of irrigation water: $0.00 -$0.015 $0.015 Nitrogen Fertilizer Cost Savings due 75 to N in applied water - Annual $0 -$1,258 $1,258 Total Annualized Cost, including the Cost Savings (Negative cost means cost 76 increase associated with reclaimed water) $23,559 $24,302 -$743 Total Annualized Cost, including the Cost Savings Per 1,000 Gallons of Irrigation Water (Negative cost means cost 77 increase associated with reclaimed water) $0.3184 $0.2893 -$0.01 D:ConFacconversion8656488reclaimedwaterbccalculatorirrigation1522.xlsx RW Comparison Worksheet 7/21/2011
  • 9. Reclaimed Water Benefit Cost Calculator for Irrigation Economic Comparison of Reclaimed Water Versus Next Available Water Source For Irrigation by Agricultural, Recreation and Aesthetic Water Users Reclaimed Water NAWS Minus Used Instead & RW/Other Next Available Other Sources if (Except A. which Row Water Source Applicable is RW/Other No. Benefit or Cost Item (NAWS) (RW/Other) minus NAWS) (1) (2) (3) (4) (5) 78 F. Change in Value of Crop Production - Annual 79 Average crop production in number of units per acre when irrigating with reclaimed water (b): 525.00 Average crop production in number of units per acre when irrigating with the next available 80 water source: 500.00 81 Name of Unit: Boxes of Oranges 82 Change in Crop Production in Units per Acre Due to Reclaimed Water (b) 25.00 83 Market Value of Crop Less Cost of Harvesting and Selling Per Unit $2.56 84 Number of Acres 100 85 Net Value of Change in Crop Production - Annual $6,400 (b) This average crop production is an estimate and could be due to increased reliability of reclaimed water, differences in water quality, increased availability of water for frost/freeze protection and/or more water available 86 to meet crop water requirements when compared to next available water source (NAWS). 87 G. Change in Quality of Nursery Plant, Lawn and/or Landscape - Annual Change in Net Revenue (Market Value minus Variable Cost) - 88 Annual (c) $5,000 (c) This change in net revenue is an estimate and can be positive or negative. This value would be positive if more water is available to meet the plant's water requirements when compared to the next available water source (NAWS) which results in improved plant quality and, thus, increases landscape plant prices or revenue. For golf courses, improved quality of lawn and landscape during drought could increase golf course use and, thus, sales. The net revenue during a drought year would be the change in revenue minus the change in cost due to having reclaimed water during a drought year. This net revenue during a drought year would be multiplied by the proportion of years that a drought occurs. For example, a proportion of 0.10 means that drought restrictions occur once every ten years. Variable cost includes the costs that increase with increasing production or sales, and decrease with decreasing production or sales. The change in net revenue would be negative if the use of reclaimed water reduces plant quality which reduces revenue through lower plant sales or 89 number of golfers. 90 H. Value of Additional Water Available from Reclaimed Water Source Additional Water Available from Reclaimed Water Source in million gallons per year 91 compared to amount needed and available from NAWS- Annual: 10.00 D:ConFacconversion8656488reclaimedwaterbccalculatorirrigation1522.xlsx RW Comparison Worksheet 7/21/2011
  • 10. Reclaimed Water Benefit Cost Calculator for Irrigation Economic Comparison of Reclaimed Water Versus Next Available Water Source For Irrigation by Agricultural, Recreation and Aesthetic Water Users Reclaimed Water NAWS Minus Used Instead & RW/Other Next Available Other Sources if (Except A. which Row Water Source Applicable is RW/Other No. Benefit or Cost Item (NAWS) (RW/Other) minus NAWS) (1) (2) (3) (4) (5) What is the cost per 1,000 gallons to obtain this fresh water, including any pumping costs? This is a lower bound estimate of the value of water to the operation. The actual value is likely much higher than this value. (This can be calculated by the irrigation water user using 92 another spreadsheet.) $0.30 Value of Additional Water Available from Reclaimed Water 93 Source - Annual $3,000 D:ConFacconversion8656488reclaimedwaterbccalculatorirrigation1522.xlsx RW Comparison Worksheet 7/21/2011
  • 11. Reclaimed Water Benefit Cost Calculator for Irrigation Economic Comparison of Reclaimed Water Versus Next Available Water Source For Irrigation by Agricultural, Recreation and Aesthetic Water Users Reclaimed Water NAWS Minus Used Instead & RW/Other Next Available Other Sources if (Except A. which Row Water Source Applicable is RW/Other No. Benefit or Cost Item (NAWS) (RW/Other) minus NAWS) (1) (2) (3) (4) (5) 94 I. Value of the Additional Water "Freed Up" by the Reclaimed Water Use Percent of water needed and available from NAWS that will be "freed up" and used for other 95 purposes when reclaimed water used (% of water amount entered in Row 2, Column (3)): 20.00% Amount of fresh water that would be "freed up" due to the reclaimed water use and would be used for other reasonable / beneficial uses, including other irrigation needs, by the applicant 96 during a year in million gallons (on average)? 15 Cost per 1,000 gallons of fresh water, including any pumping costs. This is a lower bound estimate of the value of water to the operation. The actual value is likely much higher than 97 this value. (From H. above) $0.30 98 Value of "freed up" NAWS water - Annual $4,440 99 J. Value of Water Available During NAWS Water Shortage Restrictions 100 Number of years every ten years when NAWS Water Shortage Restriction in Place 1.0 Percent of total annual water use that is used during the months when NAWS Water 101 Shortage Restriction in Place 30.00% Cutback percent or percent of NAWS water use that is cut back during water restriction 102 period: 20.00% Annualized amount of water available during NAWS Water Shortage Restriction Due to 103 Reclaimed Water Use in million gallons per year 0.44 Cost per 1,000 gallons of fresh water, including any pumping costs. This is a lower bound estimate of the value of water to the operation. The actual value is likely much higher than 104 this value. (From H. above) $0.30 Value of Water Available During NAWS Water Shortage 105 Restrictions $133 D:ConFacconversion8656488reclaimedwaterbccalculatorirrigation1522.xlsx RW Comparison Worksheet 7/21/2011
  • 12. Reclaimed Water Benefit Cost Calculator for Irrigation Economic Comparison of Reclaimed Water Versus Next Available Water Source For Irrigation by Agricultural, Recreation and Aesthetic Water Users Reclaimed Water NAWS Minus Used Instead & RW/Other Next Available Other Sources if (Except A. which Row Water Source Applicable is RW/Other No. Benefit or Cost Item (NAWS) (RW/Other) minus NAWS) (1) (2) (3) (4) (5) Total Benefit Value of Reclaimed Water (Other Than Cost 106 Savings) - Annual $18,973 Total Benefit Value of Reclaimed Water per 1,000 Gallons 107 (Other Than Cost Savings) $0.23 Net Benefit of Reclaimed Water Use Relative to Next 108 Available Water Source - Annual (d) $18,230 Net Benefit of Reclaimed Water Use Relative to Next Available Water Source Per 1,000 Gallons of Irrigation 109 Water (d) $0.22 (d) Net Benefit is the sum of the benefits minus the sum of the costs of RW/Other. These are benefits and costs when compared to the Next Available Water Source (NAWS). A positive number means the estimated value of the total benefit of RW/Other is greater than the estimated value of the total cost of RW/Other. A negative number means the estimated value of the total benefit of RW/Other is less than the estimated value of 110 the total cost of RW/Other. D:ConFacconversion8656488reclaimedwaterbccalculatorirrigation1522.xlsx RW Comparison Worksheet 7/21/2011
  • 13. MODEL CALCULATIONS Annualized Installation Cost Next Available Water Source Other Than Reclaimed If Reclaimed Water is Used Water Instead $136 $272 $174 $262 $537 $717 $349 $436 $0 $0 $815 $951 $951 $1,087 $1,087 $1,223 Color Code means calculated numbers means entered by respondent means this is a drop down menu means parameters of equations (assumed values) means keep as blank cell Use the following sources to determine prevailing energy costs: Gasoline and Diesel Fuel: U.S. Government: http://tonto.eia.doe. AAA: http://www.fuelgaug Electricity: U.S. Government: http://www.neo.ne.go D:ConFacconversion8656488reclaimedwaterbccalculatorirrigation1522.xlsx RW Comparison Worksheet 7/21/2011
  • 15. UF Study (1991) - Energy Use in Irrigation: http://www.p2pays.org/ref/12/11366.pdf Next Available Water Source Other Than Reclaimed Water Calculate energy cost to pump 1,000 gallons of water, depending upon fuel source per 1,000 gallons. Electricity $0.16 1.428 Diesel N/A 0.114 Gasoline N/A 0.149 Unit Cost: $0.16 Reclaimed Water Calculate energy cost to pump 1,000 gallons of water, depending upon fuel source per 1,000 gallons. Electricity $0.02 0.1428 Diesel N/A 0.011 Gasoline N/A 0.015 Unit Cost: $0.0163 Annualized Recurring O&M Costs D:ConFacconversion8656488reclaimedwaterbccalculatorirrigation1522.xlsx RW Comparison Worksheet 7/21/2011
  • 16. Next Available Water Source Other Than Reclaimed Water If Reclaimed Water is Used Instead $2,611 $4,115 $0 $0 $187 $712 $150 $475 $112 $237 For fertilizer prices go to: D:ConFacconversion8656488reclaimedwaterbccalculatorirrigation1522.xlsx RW Comparison Worksheet 7/21/2011
  • 17. http://www.ers.usda.gov/Data/FertilizerUse/ Use Table 7 (Excel Spreadsheet) to determine the current price of fertilizer. Scroll down to the most recent year a Next Available Water Source Other Than Reclaimed Water If Reclaimed Water is Used Instead 0.00 0.05 Pounds of N per 1,0 50% Used by Manatee County Cooperative Extension in their presentation. Cost per pound of n $0.60 $0.60 46% nitrogen fertiliz 1.36 Pounds of N per acre 27154 D:ConFacconversion8656488reclaimedwaterbccalculatorirrigation1522.xlsx RW Comparison Worksheet 7/21/2011
  • 22. p://tonto.eia.doe.gov/oog/info/gdu/gasdiesel.asp p://www.fuelgaugereport.com/FLmetro.asp p://www.neo.ne.gov/statshtml/115.htm D:ConFacconversion8656488reclaimedwaterbccalculatorirrigation1522.xlsx RW Comparison Worksheet 7/21/2011
  • 23. p://www.eia.doe.gov/cneaf/electricity/epm/table5_6_a.html D:ConFacconversion8656488reclaimedwaterbccalculatorirrigation1522.xlsx RW Comparison Worksheet 7/21/2011
  • 24. lons. KWH required to pump 1,000 gallons gallons diesel fuel required to pump 1,000 gallons gallons gasoline required to pump 1,000 gallons lons. KWH required to pump 1,000 gallons gallons diesel fuel required to pump 1,000 gallons gallons gasoline required to pump 1,000 gallons D:ConFacconversion8656488reclaimedwaterbccalculatorirrigation1522.xlsx RW Comparison Worksheet 7/21/2011
  • 26. most recent year and use the cost of "Urea 45-46% Nitrogen. unds of N per 1,000 gallons of irrigation water st per pound of nitrogen (using cost of 1 ton of Urea 45- % nitrogen fertilizer) unds of N per acre with 1 inch of irrigation water Gallons per 1 acre inch of water D:ConFacconversion8656488reclaimedwaterbccalculatorirrigation1522.xlsx RW Comparison Worksheet 7/21/2011
  • 31. Calculate Fertlizer Cost Calculation to determine cost per pound of nitrogen in 1 ton of fertilizer $0.60 =SUM(Cost of Fertilizer per Ton/0.46)/2000 $0.60 0.6 where 0.46 is the proportion of N in the fertilizer. Calculation to determine weight of nitrogen per Kgal of Reclaimed Water 0.0500 =SUM(J60*1000*8.33)/1000000 0.0500 OK = 8.33 pounds per gallon times parts per million times 1,000 gallons Use the following source (Table 7) to determine the current price of fertilizer. http://www.ers.usda.gov/Data/FertilizerUse/ Table 7 is an Excel Spreadsheet. Scroll down to the most recent year and use the cost of "Urea 45-46% Nitrogen. http://www.ers.usda.gov/Data/FertilizerUse/ The nitrogen added to the crop due to nitrate in the irrigation source water can be determined as follows: N concentration in RW, mg/l or ppm 6 Inches of irrigation water applied 1 1 acre inch of water equals 27,154 gallons How much of this would be used by the plant? IFAS uses 50% for tomatoes. "Effect of Nitrogen Rate on Yield of Tomato Grown with N in pounds per acre 1.356 Seepage Irrigation and Reclaimed Water" (Phyllis Gilreath presentation) Pounds of N per 1,000 gallons of water applied 0.049937 Source: "Water and Florida Citrus: Use, Regulation, Systems and Management", Edited by Brian Boman, University of Florida, IFAS, SP 281, July 2002, page 415 to 416. in groundwater can contribute significant amounts of nitrogen torwards a grapevine's nutritional 3 Nitrate Nitrogen is NO --N requirement and should be considered when planning a fertilizer program. Labs report NO3--N concentrations in ppm (mg/l). This is converted to pounds of nitrogen per acre-foot by mulitplying by 2.7. From "The Use of Soil and Water Analysis, Bill Peacock, Tulare County Farm Advisor, University of California Cooperative Extension, Publ. # IG3-96. 0.22661114 2.712 0.050 0.1 0.01 0.2 0.02 0.3 0.03 0.4 0.04 0.5 0.05 0.6 0.06 0.7 0.07 0.8 0.08 0.9 0.09 1 0.1 0.55 D:ConFacconversion8656488reclaimedwaterbccalculatorirrigation1522.xlsx N Fertilizer Cost 7/21/2011
  • 32. Pumping Energy Equations - Next Available Water Source Matches Matches EEE SWFWMD Electicity paper calcs Matches Jorge paper Total Dynamic Head (TDH) in feet 300 300 245 Gallons per Minute of flow (GPM) 1000 1000 25 Gal of diesel fuel used per hour of pumping, 1000 gpm, Gallons per hour of Pump efficiency 0.75 0.75 0.64 300 tdh kWh of electricity gasoline Motor power in hp (brake horsepower) 101.11 101.11 2.42 6.86 84.97 8.95 From EEE Paper hp-hours per gallon 1.18 1.18 1.127 0.96 One hour or Hours it takes to pump 1,000 gallons 1.00 0.02 6.00 1.13 1.34 11.0011 kWh of electicity needed 85.69 1.43 12.88 12.88 0.88 1.18 0.889996 Cost per kWh 0.119 0.1142 0.119 1.13 1.187085 14.66276 Cost of electricity per 1,000 gallons $10.20 $0.16 $1.53 Motor efficiency assumed to be 0.88. From IFAS "Loading Effects on Irrigation Power Unit Performance, A.G. Smajstrla nad F.S. Zazueta, AE 242, June 2003. 1.43 From Energy Efficiency & Environmental News: Energy Use in Irrigation, Nov. 1991, Florida Energy Extension Service and Helen H. Whiffen. 1.00 Matches EEE Diesel fuel paper Total Dynamic Head (TDH) in feet 300 300 Gallons per Minute of flow (GPM) 1000 1000 Pump efficiency 0.75 0.75 Motor power in hp 101.11 101.11 From Hydraulic Machines and Equipment, page 18-7, Professional Publications Inc. (Jorge Atoche) and Energy Efficiency and Environmental News: Energy Use in Irrigation, IFAS. hp-hours per gallon 14.75 14.75 From IFAS Energy Requirement for Drip Irrigation of Tomatoes in North Florida and Loading Effects on Irrigation Power Unit Performance, BUL 289, July 2002. One hour or Hours it takes to pump 1,000 gallons 1.00 0.02 Gallons of diesel fuel needed 6.86 0.11 0.11 0.0678 Cost per Gallon of diesel fuel 2.772 $0.114 See sources in Pumping Costs SS Cost of diesel fuel per 1,000 gallons $19.00 $0.01 Motor efficiency assumed to be 0.88. Matches EEE Gasoline paper Answer Total Dynamic Head (TDH) in feet 300 300 Gallons per Minute of flow (GPM) 1000 1000 Pump efficiency 0.75 0.75 Motor power in hp 101.11 101.11 hp-hours per gallon 11.30 11.30 One hour or Hours it takes to pump 1,000 gallons 1.00 0.02 Gallons of gasoline fuel needed 8.95 0.15 Cost per Gallon of gasoline fuel 2.626 0.1142 Cost of gasoline fuel per 1,000 gallons $23.50 $0.02 Motor efficiency assumed to be 0.88. D:ConFacconversion8656488reclaimedwaterbccalculatorirrigation1522.xlsx Next Available Source Pump Ener 7/21/2011
  • 33. elen H. Whiffen. gy Use in Irrigation, IFAS. D:ConFacconversion8656488reclaimedwaterbccalculatorirrigation1522.xlsx Next Available Source Pump Ener 7/21/2011
  • 34. Pumping Energy Equations - Reclaimed Water Matches Matches EEE SWFWMD Electicity paper calcs Matches Jorge paper Total Dynamic Head (TDH) in feet 300 30 245 Gallons per Minute of flow (GPM) 1000 200 25 Gal of diesel fuel used per hour of pumping, 1000 gpm, Gallons per hour of Pump efficiency 0.75 0.75 0.64 300 tdh kWh of electricity gasoline Motor power in hp (brake horsepower) 101.11 2.02 2.42 6.86 84.97 8.95 From EEE Paper hp-hours per gallon 1.18 1.18 1.127 0.96 One hour or Hours it takes to pump 1,000 gallons 1.00 0.08 6.00 1.13 1.34 kWh of electicity needed 85.69 0.142814 12.88 12.88 0.88 1.18 16.66667 Cost per kWh 0.119 0.1142 0.119 1.13 0.000253 Cost of electricity per 1,000 gallons $10.20 $0.02 $1.53 0.00357 Motor efficiency assumed to be 0.88. 0.142814 Matches EEE Diesel fuel paper Total Dynamic Head (TDH) in feet 300 30 6000 Gallons per Minute of flow (GPM) 1000 200 Pump efficiency 0.75 0.75 Motor power in hp 101.11 2.02 From Hydraulic Machines and Equipment, page 18-7, Professional Publications Inc. (Jorge Atoche) and Energy Efficiency and Environmental News: Energy Use in Irrigation, IFAS. hp-hours per gallon 14.75 14.75 From IFAS Energy Requirement for Drip Irrigation of Tomatoes in North Florida and Loading Effects on Irrigation Power Unit Performance. One hour or Hours it takes to pump 1,000 gallons 1.00 0.08 Gallons of diesel fuel needed 6.86 0.011 0.57 0.0678 Cost per Gallon of diesel fuel 2.772 0.1142 See sources in Pumping Costs SS Cost of diesel fuel per 1,000 gallons $19.00 $0.00 Motor efficiency assumed to be 0.88. Matches EEE Gasoline paper Answer Total Dynamic Head (TDH) in feet 300 30 Gallons per Minute of flow (GPM) 1000 200 Pump efficiency 0.75 0.75 Motor power in hp 101.11 2.02 hp-hours per gallon 11.30 11.30 One hour or Hours it takes to pump 1,000 gallons 1.00 0.08 Gallons of gasoline fuel needed 8.95 0.015 Cost per Gallon of gasoline fuel 2.626 0.1142 Cost of gasoline fuel per 1,000 gallons $23.50 $0.00 Motor efficiency assumed to be 0.88. D:ConFacconversion8656488reclaimedwaterbccalculatorirrigation1522.xlsx Reclaimed Water Pump Energy 7/21/2011
  • 35. gy Use in Irrigation, IFAS. D:ConFacconversion8656488reclaimedwaterbccalculatorirrigation1522.xlsx Reclaimed Water Pump Energy 7/21/2011
  • 36. Table 10.1—GROSS DOMESTIC PRODUCT AND DEFLATORS USED IN THE HISTORIC (Fiscal Year 2000 = 1.000) % Change in GDP (in GDP GDP (Chained) Year billions of (Chained) Price Index Total Total dollars) Price Index Total (GMJ) Defense Nondefense 1940 96.8 0.0978 0.0870 0.0836 0.0878 1941 114.1 0.1014 0.0928 0.0994 0.0876 1942 144.3 0.1089 0.1028 0.1186 0.0757 1943 180.3 0.1163 0.1122 0.1268 0.0682 1944 209.2 0.1209 0.1061 0.1157 0.0689 1945 221.4 0.1239 0.1041 0.1071 0.0843 1946 222.7 0.1328 0.1071 0.1052 0.1140 1947 233.2 0.1466 0.1162 0.1137 0.1177 1948 256.7 0.1606 0.1273 0.1052 0.1402 1949 271.3 0.1660 0.1246 0.1062 0.1367 1950 273.2 0.1635 0.1287 0.1059 0.1434 1951 320.3 0.1723 0.1279 0.1113 0.1523 1952 348.7 0.1792 0.1280 0.1162 0.1633 1953 372.6 0.1825 0.1368 0.1269 0.1661 1954 377.1 0.1846 0.1409 0.1290 0.1784 1955 395.9 0.1862 0.1455 0.1335 0.1709 1956 427.0 0.1911 0.1526 0.1425 0.1710 1957 450.9 0.1983 0.1601 0.1497 0.1780 1958 460.0 0.2043 0.1687 0.1562 0.1885 1959 490.2 0.2075 0.1746 0.1647 0.1875 1960 518.9 0.2100 0.1750 0.1603 0.1945 1961 529.9 0.2130 0.1795 0.1645 0.1981 1962 567.8 0.2154 0.1803 0.1657 0.1971 1963 599.2 0.2181 0.1873 0.1726 0.2034 1964 641.4 0.2207 0.0119 0.1900 0.1739 0.2064 1965 687.5 0.2245 0.0172 0.1928 0.1735 0.2102 1966 755.8 0.2293 0.0214 0.1974 0.1800 0.2131 1967 810.2 0.2367 0.0323 0.2026 0.1863 0.2185 1968 868.5 0.2451 0.0355 0.2103 0.1950 0.2254 1969 948.3 0.2563 0.0457 0.2230 0.2062 0.2390 1970 1,012.9 0.2703 0.0546 0.2363 0.2178 0.2515 1971 1,080.3 0.2838 0.0499 0.2519 0.2314 0.2661 1972 1,176.9 0.2972 0.0472 0.2690 0.2551 0.2769 1973 1,311.0 0.3103 0.0441 0.2833 0.2752 0.2872 1974 1,438.9 0.3327 0.0722 0.3070 0.2967 0.3116 1975 1,560.8 0.3673 0.1040 0.3384 0.3293 0.3418 1976 1,738.8 0.3938 0.0721 0.3640 0.3547 0.3670 TQ 459.6 0.4063 0.3752 0.3648 0.3785 1977 1,974.4 0.4233 0.0749 0.3934 0.3881 0.3951 1978 2,218.3 0.4518 0.0673 0.4194 0.4161 0.4204 1979 2,502.4 0.4882 0.0806 0.4552 0.4520 0.4561 1980 2,725.4 0.5310 0.0877 0.5029 0.5017 0.5033 1981 3,058.6 0.5830 0.0979 0.5562 0.5582 0.5556 1982 3,225.5 0.6229 0.0684 0.5958 0.6037 0.5932 1983 3,442.7 0.6504 0.0441 0.6245 0.6348 0.6210 1984 3,846.7 0.6744 0.0369 0.6555 0.6809 0.6467 1985 4,148.9 0.6963 0.0325 0.6781 0.7089 0.6676 1986 4,406.7 0.7125 0.0233 0.6947 0.7180 0.6861 1987 4,654.4 0.7311 0.0261 0.7143 0.7284 0.7090 1988 5,011.9 0.7541 0.0315 0.7359 0.7386 0.7349 1989 5,401.7 0.7834 0.0389 0.7631 0.7609 0.7639
  • 37. 1990 5,737.0 0.8125 0.0371 0.7882 0.7822 0.7902 1991 5,934.2 0.8430 0.0375 0.8226 0.8189 0.8236 1992 6,240.6 0.8642 0.0251 0.8508 0.8422 0.8531 1993 6,578.4 0.8838 0.0227 0.8725 0.8555 0.8770 1994 6,964.2 0.9028 0.0215 0.8902 0.8724 0.8946 1995 7,325.1 0.9218 0.0210 0.9120 0.8895 0.9171 1996 7,697.4 0.9395 0.0192 0.9328 0.9190 0.9356 1997 8,186.6 0.9559 0.0175 0.9508 0.9381 0.9534 1998 8,626.3 0.9675 0.0121 0.9603 0.9499 0.9623 1999 9,127.0 0.9802 0.0131 0.9748 0.9690 0.9759 2000 9,708.4 1.0000 0.0202 1.0000 1.0000 1.0000 2001 10,059.8 1.0236 0.0236 1.0234 1.0256 1.0229 2002 10,378.4 1.0432 0.0191 1.0425 1.0582 1.0393 2003 10,803.7 1.0643 0.0202 1.0703 1.1109 1.0613 2004 11,503.7 1.0920 0.0260 1.1014 1.1561 1.0886 2005 12,234.9 1.1270 0.0321 1.1417 1.2158 1.1245 2006 13,009.9 1.1652 0.0339 1.1809 1.2669 1.1616 2007 13,642.3 1.1971 0.0274 1.2081 1.3061 1.1856 2008 14,222.3 1.2256 0.0238 1.2584 1.3355 1.2398 2009 estimate 14,240.2 1.2435 0.0146 1.2785 1.3484 1.2648 2010 estimate 14,728.8 1.2560 1.2807 1.3650 1.2614 2011 estimate 15,499.8 1.2733 1.2975 1.3838 1.2797 2012 estimate 16,470.4 1.2945 1.3195 1.4068 1.3024 2013 estimate 17,497.8 1.3178 1.3443 1.4322 1.3280 2014 estimate 18,386.4 1.3415 1.3705 1.4579 1.3550 Note: Constant dollar research and development outlays are based on the GDP (chained) price index. Source: http://www.whitehouse.gov/omb/budget/Historicals/ Average 18 years 0.0218 Average 20 years 0.0234 2007 to 2009 1.039 2008 to 2009 1.015 2005 to 2009 1.103 2006 to 2009 1.067
  • 38. ORS USED IN THE HISTORICAL TABLES: 1940–2014 0) Composite Outlay Deflators Undistributed Payments for Individuals Other Grants Net Interest Offsetting All Other Total Direct Grants Receipts 0.0931 0.0931 0.0931 0.0703 0.0978 0.0608 0.0847 0.0963 0.0963 0.0963 0.0640 0.1014 0.0583 0.0809 0.1053 0.1053 0.1053 0.0631 0.1089 0.0565 0.0661 0.1165 0.1165 0.1165 0.0675 0.1163 0.0554 0.0583 0.1251 0.1251 0.1251 0.0689 0.1209 0.0552 0.0562 0.1315 0.1316 0.1311 0.0691 0.1239 0.0569 0.0586 0.1387 0.1388 0.1385 0.0747 0.1328 0.0632 0.0684 0.1493 0.1493 0.1492 0.1022 0.1466 0.0834 0.0868 0.1631 0.1631 0.1630 0.1036 0.1606 0.1059 0.1117 0.1676 0.1676 0.1674 0.1110 0.1660 0.1033 0.1092 0.1656 0.1656 0.1650 0.1042 0.1635 0.1088 0.1162 0.1749 0.1750 0.1742 0.1198 0.1723 0.1045 0.1154 0.1816 0.1817 0.1810 0.1218 0.1792 0.1094 0.1222 0.1844 0.1845 0.1839 0.1291 0.1825 0.1156 0.1288 0.1868 0.1869 0.1866 0.1260 0.1846 0.1170 0.1360 0.1870 0.1870 0.1869 0.1292 0.1862 0.1204 0.1310 0.1894 0.1894 0.1893 0.1321 0.1911 0.1231 0.1317 0.1948 0.1949 0.1947 0.1434 0.1983 0.1277 0.1379 0.2006 0.2006 0.2005 0.1571 0.2043 0.1361 0.1491 0.2036 0.2037 0.2035 0.1667 0.2075 0.1423 0.1536 0.2073 0.2073 0.2071 0.1680 0.2100 0.1400 0.1570 0.2103 0.2104 0.2102 0.1656 0.2130 0.1464 0.1647 0.2123 0.2124 0.2122 0.1671 0.2154 0.1489 0.1665 0.2149 0.2149 0.2147 0.1727 0.2181 0.1533 0.1756 0.2178 0.2178 0.2176 0.1760 0.2207 0.1575 0.1832 0.2208 0.2208 0.2206 0.1807 0.2245 0.1656 0.1905 0.2248 0.2248 0.2246 0.1779 0.2293 0.1714 0.1956 0.2308 0.2308 0.2307 0.1820 0.2367 0.1773 0.2002 0.2380 0.2380 0.2379 0.1889 0.2451 0.1848 0.2061 0.2482 0.2482 0.2481 0.1999 0.2563 0.1974 0.2210 0.2602 0.2602 0.2601 0.2138 0.2703 0.2123 0.2343 0.2719 0.2719 0.2718 0.2293 0.2838 0.2284 0.2526 0.2823 0.2824 0.2822 0.2398 0.2972 0.2455 0.2692 0.2931 0.2931 0.2930 0.2473 0.3103 0.2587 0.2838 0.3167 0.3168 0.3166 0.2714 0.3327 0.2765 0.3014 0.3491 0.3492 0.3490 0.3011 0.3673 0.3034 0.3277 0.3722 0.3722 0.3720 0.3267 0.3938 0.3325 0.3597 0.3840 0.3840 0.3838 0.3404 0.4063 0.3454 0.3704 0.4002 0.4003 0.4000 0.3525 0.4233 0.3679 0.3945 0.4272 0.4273 0.4270 0.3758 0.4518 0.3898 0.4156 0.4625 0.4626 0.4623 0.4096 0.4882 0.4159 0.4476 0.5110 0.5110 0.5108 0.4563 0.5310 0.4584 0.4873 0.5604 0.5604 0.5602 0.5081 0.5830 0.5076 0.5371 0.5950 0.5950 0.5948 0.5514 0.6229 0.5364 0.5677 0.6223 0.6223 0.6221 0.5794 0.6504 0.5622 0.5910 0.6464 0.6464 0.6461 0.6088 0.6744 0.5753 0.6127 0.6681 0.6682 0.6677 0.6329 0.6963 0.5968 0.6312 0.6861 0.6861 0.6857 0.6557 0.7125 0.6107 0.6465 0.7071 0.7071 0.7068 0.6866 0.7311 0.6245 0.6667 0.7345 0.7345 0.7344 0.7107 0.7541 0.6429 0.6885 0.7670 0.7670 0.7670 0.7365 0.7834 0.6599 0.7031
  • 39. 0.7996 0.7996 0.7999 0.7693 0.8125 0.6845 0.7194 0.8333 0.8333 0.8333 0.7994 0.8430 0.7285 0.7599 0.8574 0.8575 0.8572 0.8181 0.8642 0.7459 0.7972 0.8787 0.8788 0.8783 0.8418 0.8838 0.7863 0.8407 0.8967 0.8968 0.8962 0.8644 0.9028 0.8199 0.8604 0.9168 0.9169 0.9165 0.8922 0.9218 0.8458 0.8950 0.9355 0.9355 0.9352 0.9151 0.9395 0.8851 0.9244 0.9537 0.9537 0.9533 0.9318 0.9559 0.9095 0.9402 0.9629 0.9630 0.9628 0.9449 0.9675 0.9329 0.9481 0.9763 0.9763 0.9762 0.9649 0.9802 0.9591 0.9683 1.0000 1.0000 1.0000 1.0000 1.0000 1.0000 1.0000 1.0223 1.0223 1.0223 1.0305 1.0236 1.0265 1.0223 1.0366 1.0366 1.0368 1.0539 1.0432 1.0721 1.0533 1.0568 1.0568 1.0570 1.0917 1.0643 1.1158 1.0847 1.0817 1.0817 1.0819 1.1352 1.0920 1.1790 1.1296 1.1133 1.1131 1.1141 1.2063 1.1270 1.2374 1.1806 1.1479 1.1477 1.1491 1.2736 1.1652 1.2872 1.2214 1.1734 1.1730 1.1751 1.3360 1.1971 1.3359 1.2350 1.2298 1.2294 1.2316 1.4197 1.2256 1.3677 1.2746 1.2187 1.2183 1.2204 1.4439 1.2435 1.3877 1.3568 1.2358 1.2353 1.2379 1.4898 1.2560 1.4016 1.3241 1.2569 1.2564 1.2594 1.5410 1.2733 1.4209 1.3424 1.2820 1.2815 1.2844 1.5980 1.2945 1.4445 1.3647 1.3088 1.3084 1.3105 1.6597 1.3178 1.4705 1.3892 1.3362 1.3359 1.3378 1.7245 1.3415 1.4970 1.4143 .
  • 40. Addendum: Direct Capital Total Defense Nondefense 0.1897 0.1623 0.2044 0.1830 0.1725 0.2149 0.1799 0.1772 0.2303 0.1736 0.1731 0.2278 0.1677 0.1675 0.2285 0.1559 0.1557 0.2286 0.1604 0.1595 0.2190 0.1839 0.1796 0.2128 0.2083 0.2009 0.2390 0.2222 0.2117 0.2501 0.2183 0.2107 0.2311 0.2306 0.2278 0.2429 0.2397 0.2380 0.2574 0.2426 0.2407 0.2698 0.2400 0.2383 0.2660 0.2473 0.2465 0.2603 0.2614 0.2611 0.2674 0.2783 0.2780 0.2822 0.2881 0.2878 0.2924 0.2928 0.2926 0.2956 0.2951 0.2945 0.3006 0.2968 0.2960 0.3038 0.2999 0.2988 0.3086 0.3068 0.3056 0.3158 0.3081 0.3050 0.3282 0.3096 0.3056 0.3299 0.3112 0.3082 0.3278 0.3165 0.3134 0.3402 0.3244 0.3212 0.3553 0.3368 0.3339 0.3699 0.3560 0.3522 0.3962 0.3818 0.3759 0.4284 0.4216 0.4166 0.4503 0.4565 0.4541 0.4681 0.4789 0.4747 0.4985 0.5207 0.5099 0.5669 0.5586 0.5464 0.6087 0.5873 0.5773 0.6222 0.6093 0.6013 0.6412 0.6492 0.6449 0.6646 0.6902 0.6867 0.7034 0.7391 0.7326 0.7663 0.7981 0.7911 0.8308 0.8614 0.8569 0.8874 0.9033 0.9038 0.8999 0.9344 0.9396 0.9007 0.9380 0.9427 0.9089 0.9199 0.9204 0.9164 0.9027 0.8992 0.9276 0.8895 0.8806 0.9447 0.8977 0.8875 0.9677
  • 41. 0.9121 0.9004 0.9867 0.9371 0.9249 1.0067 0.9484 0.9362 1.0013 0.9669 0.9574 1.0066 0.9880 0.9809 1.0168 1.0078 1.0003 1.0314 1.0186 1.0141 1.0309 1.0022 0.9982 1.0131 0.9913 0.9893 0.9983 0.9950 0.9961 0.9922 1.0000 1.0000 1.0000 0.9982 0.9952 1.0050 0.9879 0.9844 0.9960 0.9892 0.9884 0.9911 0.9972 0.9979 0.9949 1.0186 1.0196 1.0153 1.0354 1.0375 1.0283 1.0494 1.0534 1.0355 1.0745 1.0785 1.0604 1.0894 1.0942 1.0757 1.1005 1.1052 1.0864 1.1163 1.1204 1.1014 1.1355 1.1391 1.1197 1.1560 1.1596 1.1399 1.1768 1.1804 1.1604
  • 42. Cost per 1,000 Gallons to pump groundwater 2009 2008 0.45 $0.46 2005 0.23 $0.25 2006 0.31 $0.33 Average 2009 $0.35 $0.20 $0.10 $0.36 $0.36