1. What is a Data Warehouse
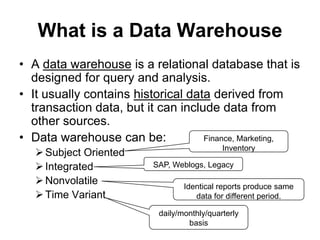
• A data warehouse is a relational database that is
designed for query and analysis.
• It usually contains historical data derived from
transaction data, but it can include data from
other sources.
• Data warehouse can be: Finance, Marketing,
Inventory
Subject Oriented
Integrated SAP, Weblogs, Legacy
Nonvolatile Identical reports produce same
Time Variant data for different period.
daily/monthly/quarterly
basis
2. Why Data Warehouse
• Provide a consistent information of
various cross functional activity.
• Historical Data.
• Access, Analyze and Report
Information.
• Augment the Business Processes
7. BI Framework
Business Layer
Business goals are met and business value is realized
Administration & Operation Layer
Business Intelligence and Data Warehousing programs are sustainable
Implementation Layer
Useful, reliable, and relevant data is used
to deliver meaningful, actionable information
8. BI Framework
Business Requirements
BI Architecture
Data Warehousing
Data Resource Administration
Data Resource Administration
Data Sources
Data Sources
Program Management
BI & DW Operations
Development
Data Acquisition, Cleansing,& Integration
Data Acquisition, Cleansing, & Integration
Data Stores
Data Stores
Information Services
Information Delivery
Information Delivery Business Analytics
Business Analytics
Business Applications
Business Applications
Business Value
Business Value
9. ERP/BI Evolution
Standard Reports Data Warehouse
ROI
Custom Reports
ERP Data Marts
Views
Effort Rollout
Excel
BI Focus Customer
Satisfaction
Key
Sites Smaller
Sites
Time
10. BI Foundation
Key Concepts:
• Single source of the truth
• Don’t report on transaction
system
• DW/ODS: Optimized reporting
• Foundation for analytic apps
• Multiple data sources
• Lowest level of detail
11. Data Warehouse Environment
Reporting
Data Sources Staging Data Warehouse Datamart
Apache
Web Server Sales
ETL PROCESS Portal /Web
ERP
HR
Desktop
Legacy Applications
Finance
Data
DATA Reports (PDF)
WAREHOUSE
Inventory
Email
CRM ODS Summary/
Aggregate Metadata
Repository
(ETL, Clickstream
Flat File Reporting
Engine) Mobile
Near
Web XML Feed Real Time
Reporting Data Mining
Service
Clickstream Operational
(Web log) Reporting
13. What is a KPI?
• KPIs are directly linked to the overall goals of the company.
• Business Objectives are defined at corporate, regional and site level. These goals
determine critical activities (Key Success Factors) that must be done well for a
particular operation to succeed.
• KPIs are utilized to track or measure actual performance against key success
factors.
– Key Success Factors (KSFs) only change if there is a fundamental shift in business objectives.
– Key Performance Indicators (KPIs) change as objectives are met, or management focus shifts.
Business Key Success Key Performance
Objectives Factors (KSFs) Indicators (KPIs)
Determine. Tracked by.
14. Reporting analysis areas
• Financials
– Account Margins
• Costs, margins by COGS, revenue, and receivables accounts
– AP Invoices Summary
– AR Aging Detail with configurable buckets
– AR Sales (Summary with YTD, QTD, MTD growth vs. Goal, Plan)
– GL, Drill to AP, AR sub ledgers
• Purchasing
– Variance Analysis (PPV. IPV) at PO receipt time
• To sub-element cost level by vendor, inventory org, account segment, etc.
– PO Vendor On-Time Performance Summary
• By request date and promise date
– PO Vendor Outstanding Balances Summary
– PO Vendor Payment History Summary
15. Reporting analysis areas….
• Sales, Shipments, Customers
– Net Bookings
– Customer, Sales Rep, Product Analysis
– List Price, Selling Price, COGS, Gross Margin, Discount Analysis
– Open Orders including costing, margins
– OM Customer Service Summary (on-time % by customer, item)
– OM Lead Times Summary
– Outstanding Work Orders (ability to deliver on time)
• Supports ATO, PTO, kits, standard items; Flow and Discrete
• Production and Efficiency
– INV On-hand Snapshot (units w/ sub element costs)
– INV Item Turns Snapshot with configurable Turns calculation
– INV Obsolete Inventory Analysis Summary
– MFG Usage (WIP, Sales Demand)
– MFG Forecast vs. Actual Summary
– WIP Analysis, Operational Variance Analysis, std vs. actual
• BOM with Cost
– Detailed BOM Analysis with Cost
– Unit, Elemental, Sub-Element Cost
16. BI User Profiles
Strategic Enterprise data Data Warehouse
Planning Executives Consistent GUI
Industry drivers
Enterprise KPIs
Analysts
Functional Enterprise and LOB data
Scenario and simulation
Tactical Managers History and forecasts
Analysis LOB* data
Domain-specific KPIs
Drill down option LOB
Business Trends Managers
LOB KPIs
Operational Data Store Process data
Real time Operational
Feedback loops Managers
Operational metrics
Operational
Decisions Summarized Detailed
Data Granularity
*An LOB (line-of-business) that are vital to running an enterprise, such as accounting, supply chain management,
and resource planning applications.
17. OLTP vs. Data Warehouse
OLTP DATA WAREHOUSE
Supports only predefined operations. Designed to accommodate ad hoc queries
End users routinely issue individual data Updated on a regular basis by the ETL process
modification statements to the database. (run nightly or weekly) using bulk data
modification techniques
Use fully normalized schemas to optimize Use denormalized or partially denormalized
update/insert/delete performance, and to schemas (such as a star schema) to optimize
guarantee data consistency. query performance.
Retrieve the current order for this customer. Find the total sales for all customers last month.
Usually store data from only a few weeks or Usually store many months or years of data
months
Complex Data Structures Multi Dimensional data Structures
Few Indexes Many Indexes
Many Joins Fewer Joins
Normalized Data, less duplication Denormalized Structure, more duplication
Rarely aggregated Aggregation is very common.
18. Typical Reporting Environments
Function OLTP Data Warehouse OLAP
Operation Update Report Analyze
Analytical Low Medium High
Requirements
Data Level Detail Medium and Summary and
Summary Derived
Age of Data Current Historical and Historical, current
Current and projected
Business Events React Anticipate Predict
Business Objective Efficiency and Efficiency and Effectiveness and
Structure Adaptation Design
19. Definition of OLAP
OLAP stands for On Line Analytical Processing.
That has two immediate consequences: the
on line part requires the answers of queries
to be fast, the analytical part is a hint that
the queries itself are complex.
i.e. Complex Questions with FAST ANSWERS!
20. Why an OLAP Tool?
• Empowers end-users to do own analysis
• Frees up IS backlog of report requests
• Ease of use
• Drill-down
• No knowledge of SQL or tables required
• Exception Analysis
• Variance Analysis
21. ROLAP vs. MOLAP
What is ROLAP? (Relational)
What is MOLAP? (Multidimensional)
It's all in how the data is stored
23. Inmon vs. Kimball
Inmon - The top down approach
Inmon First Data warehouse Then Datamart
Kimball – The bottom up approach
Kimball First Datamarts Combine Data warehouse
24. Extraction, Transformation &
Load (ETL)
• Attribute Standardization and Cleansing.
• Business Rules and Calculations.
• Consolidate data using Matching and
Merge / Purge Logic.
• Proper Linking and History Tracking.
25. Typical Scenario
Executive wants to know revenue and backlog (relative to
forecast) and margin by reporting product line, by
customer, month to date, quarter to date, year to date
Sources of Data:
• Revenue 3 AR Tables
• Backlog 8 OE Table
• Customer 8 Cust Tables
• Item 4 INV Tables
• Reporting Product Line 1 Table (Excel)
• Accounting Rules 5 FND Tables
• Forecast 1 Table (Excel)
• Costing 11 CST Tables
Totals 41 Tables
26. A PL/SQL Based ETL
PL/SQL Staging
AR
Staging
OE
Reports
FND
INV
CST
Most significant portion of the
effort is in writing PL/SQL
Forecast
Product
Reporting
Line
28. The basic structure of a fact table
• A set of foreign keys
(FK)
– context for the fact
– Join to Dimension Tables
• Degenerate Dimensions
– Part of the key
– Not a foreign key to a
Dimension table
• Primary Key
– a subset of the FKs
– must be defined in the table
• Fact Attributes
– measurements
29. Kinds of Fact Tables
• Each fact table should have one and only
one fundamental grain
• There are three types of fact tables
– Transaction grain
– Periodic snapshot grain
– Accumulating snapshot grain
30. Transaction Grain Fact Tables
• The grain represents an instantaneous
measurement at a specific point in space
and time.
– retail sales transaction
• The largest and the most detailed type.
• Unpredictable sparseness, i.e., given a set
of dimensional values, no fact may be
found.
• Usually partitioned by time.
31. Factless Fact Tables
• When there are no measurements of the
event, just that the event happened
• Example: automobile accident with date,
location and claimant
• All the columns in the fact table are foreign
keys to dimension tables
32. Late Arriving Facts
• Suppose we receive today a purchase order that is one
month old and our dimensions are type-2 dimensions
• We are willing to insert this late arriving fact into the
correct historical position, even though our sales
summary for last month will change
• We must be careful how we will choose the old historical
record for which this purchase applies
– For each dimension, find the corresponding dimension record in
effect at the time of the purchase
– Using the surrogate keys found above, replace the incoming
natural keys with the surrogate keys
– Insert the late arriving record in the correct partition of the table
33. The basic structure of a dimension
• Primary key (PK)
– Meaningless, unique integer
– Aka as surrogate key
– Joins to Fact Tables
– Is a Foreign Key to Fact Tables
• Natural key (NK)
– Meaningful key extracted from
source systems
– 1-to-1 relationship to the PK for
static dimensions
– 1-to-many relationship to the
PK for slowly changing
dimensions, tracks history of
changes to the dimension
• Descriptive Attributes
– Primary textual but numbers
legitimate but not numbers that
are measured quantities
– 100 such attributes normal
– Static or slow changing only
– Product price -- either fact or
dimension attribute
34. Generating surrogate keys for
Dimensions
• Via triggers in the DBMS
– Read the latest surrogate key, generate the next value, create the
record
– Disadvantages: severe performance bottlenecks
• Via the ETL process, an ETL tool or a 3-rd party
application generate the unique numbers
– A surrogate key counter per dimension
– Maintain consistency of surrogate keys between dev, test and
production
• Using Smart Keys
– Concatenate the natural key of the dimension in the source(s) with
the timestamp of the record in the source or the Data Warehouse.
– Tempting but wrong
35. Why smart keys are wrong
• By definition
– Surrogate keys are supposed to be meaningless
– Do you update the concatenate smart key if the natural key changes?
• Performance
– Natural keys may be chars and varchars, not integers
– Adding a timestamp to it makes the key very big
• The dimension is bigger
• The fact tables containing the foreign key are bigger
• Joining facts with dimensions based on chars/varchars become inefficient
• Heterogeneous sources
– Smart keys “work” for homogeneous environments, but most likely than not the
sources are heterogeneous, each having the own definition of the dimension
– How does the definition of the smart key changes when there is another source
added? It doesn’t scale very well.
• One advantage: simplicity in the ETL process
36. The basic load plan for a
dimension
• Simple Case: the dimension is loaded as a lookup table
• Typical Case
– Data cleaning
• Validate the data, apply business rules to make the data consistent, column
validity enforcement, cross-column value checking, row de-duplication
– Data conforming
• Align the content of some or all of the fields in the dimension with fields in
similar or identical dimensions in other parts of the data warehouse
– Fact tables: billing transactions, customer support calls
– IF they use the same dimensions, then the dimensions are conformed
– Data Delivery
• All the steps required to deal with slow-changing dimensions
• Write the dimension to the physical table
• Creating and assigning the surrogate key, making sure the natural key is
correct, etc.
37. Date and Time Dimensions
• Virtually everywhere:
measurements are defined at
specific times, repeated over
time, etc.
• Most common: calendar-day
dimension with the grain of a
single day, many attributes
• Doesn’t have a conventional
source:
– Built by hand, speadsheet
– Holidays, workdays, fiscal
periods, week numbers, last
day of month flags, must be
entered manually
– 10 years are about 4K rows
38. Date Dimension
• Note the Natural key: a day type and a full date
– Day type: date and non-date types such as inapplicable
date, corrupted date, hasn’t happened yet date
– fact tables must point to a valid date from the dimension, so
we need special date types, at least one, the “N/A” date
• How to generate the primary key?
– Meaningless integer?
– Or “10102005” meaning “Oct 10, 2005”? (reserving 9999999
to mean N/A?)
– This is a close call, but even if meaningless integers are
used, the numbers should appear in numerical order (why?
Because of data partitioning requirements in a DW, data in a
fact table can be partitioned by time)
39. Other Time Dimensions
• Also typically needed are time dimensions
whose grain is a month, a week, a quarter or
a year, if there are fact tables in each of these
grains
• These are physically different tables
• Are generated by “eliminating” selected
columns and rows from the Date dimension,
keep either the first of the last day of the
month
• Do NOT use database views
– A view would drag a much larger table (the date)
into a month-based fact table
40. Time Dimensions
• How about a time dimension based on
seconds?
• There are over 31 million seconds in a
year!
• Avoid them as dimensions
• But keep the SQL date-timestamp
data as basic attributes in facts (not as
dimensions), if needed to compute
precise queries based on specific
times
• Older approach: keep a dimension of
minutes or seconds and make it based
on an offset from midnight of each
day, but it’s messy when timestamps
cross days
• Might need something fancy though if
the enterprise has well defined time
slices within a day such as shift
names, advertising slots -- then build a
dimension
41. Big and Small Dimensions
BIG SMALL
• Examples: Customer, Product, • Examples: Transaction Type, Claim
Status
Location
• Tiny lookup tables with only a few
• Millions or records with hundreds of records and one ore more columns
fields (insurance customers)
• Build by typing into a spreadsheet
• Or hundreds of millions of records and loading the data into the DW
with few fields (supermarket • These dimensions should NOT be
customers) conformed
• Always derived by multiple sources • JUNK dimension: a tactical
• These dimensions should be maneuver to reduce the number of
conformed FKs from a fact table by combining
the low-cardinality values of small
dimensions into a single junk
dimension, generate as you go,
don’t generate the Cartesian
product
42. Other dimensions
• Degenerate dimensions
– When a parent-child relationship exists and the grain
of the fact table is the child, the parent is kind of left
out in the design process
– Example:
• grain of the fact able is the line item in an order
• the order number is significant part of the key
• but we don’t create a dimension for the order number,
because it would be useless
• we insert the order number as part of the key, as if it was a
dimension, but we don’t create a dimension table for it
43. Slow-changing Dimensions
• When the DW receives notification that
some record in a dimension has changed,
there are three basic responses:
– Type 1 slow changing dimension (Overwrite)
– Type 2 slow changing dimension (Partitioning
History)
– Type 3 slow changing dimension (Alternate
Realities)
44. Type 1 Slowly Changing
Dimension (Overwrite)
• Overwrite one or more values of the dimension with the new value
• Use when
– the data are corrected
– there is no interest in keeping history
– there is no need to run previous reports or the changed value is immaterial to the
report
• Type 1 Overwrite results in an UPDATE SQL statement when the value
changes
• If a column is Type-1, the ETL subsystem must
– Add the dimension record, if it’s a new value or
– Update the dimension attribute in place
• Must also update any Staging tables, so that any subsequent DW load from
the staging tables will preserve the overwrite
• This update never affects the surrogate key
• But it affects materialized aggregates that were built on the value that
changed (will be discussed more next week when we talk about delivering
fact tables)
45. Type 1 Slowly Changing
Dimension (Overwrite) - Cont
• Beware of ETL tools “Update else Insert” statements, which are convenient but
inefficient
• Some developers use “UPDATE else INSERT” for fast changing dimensions and
“INSERT else UPDATE” for very slow changing dimensions
• Better Approach: Segregate INSERTS from UPDATES, and feed the DW
independently for the updates and for the inserts
• No need to invoke a bulk loader for small tables, simply execute the SQL updates,
the performance impact is immaterial, even with the DW logging the SQL statement
• For larger tables, a loader is preferable, because SQL updates will result into
unacceptable database logging activity
– Turn the logger off before you update with SQL Updates and separate SQL
Inserts
– Or use a bulk loader
• Prepare the new dimension in a staging file
• Drop the old dimension table
• Load the new dimension table using the bulk loader
46. Type-2 Slowly Changing
Dimension (Partitioning History)
• Standard
• When a record changes, instead of overwriting
– create a new dimension record
– with a new surrogate key
– add the new record into the dimension table
– use this record going forward in all fact tables
– no fact tables need to change
– no aggregates need to be re-computed
• Perfectly partitions history because at each detailed
version of the dimension is correctly connected to the
span of fact tables for which that version is correct
47. Type-2 Slowly Changing
Dimensions (history overwrite)
• The natural key does not
change
• The job attribute changes
• We can constraint our
query
– the Manager job
– Joe’s employee id
• Type-2 do not change the
natural key (the natural key
should never change)
48. Type-2 SCD Precise Time
Stamping
• With a Type-2 change, you might want to
include the following additional attributes
in the dimension
– Date of change
– Exact timestamp of change
– Reason for change
– Current Flag (current/expired)
49. Type-3 Slowly Changing
Dimensions (Alternate Realities)
• Applicable when a change happens to a dimension record but the old
record remains valid as a second choice
– Product category designations
– Sales-territory assignments
• Instead of creating a new row, a new column is inserted (if it does not
already exist)
– The old value is added to the secondary column
– Before the new value overrides the primary column
– Example: old category, new category
• Usually defined by the business after the main ETL process is implemented
– “Please move Brand X from Men’s Sportswear to Leather goods but allow me to
track Brand X optionally in the old category”
• The old category is described as an “Alternate reality”
50. Aggregates
• Effective way to augment the performance of the data
warehouse if you augment basic measurements with
aggregate information
• Aggregates speed queries by a factor of 100 or even
1000
• The whole theory of dimensional modeling was born out
of the need of storing multiple sets of aggregates at
various grouping levels within the key dimensions
• You can store aggregates right into fact tables in the
Data Warehouse or (more appropriately) the Data Mart
51. Loading a Table
• Separate inserts from updates (if updates are relatively few
compared to insertions and compared to table size)
– First process the updates (with SQL updates?)
– Then process the inserts
• Use a bulk loader
– To improve performance of the inserts & decrease database overhead
• Load in parallel
– Break data in logical segments, say one per year & load the data in parallel
• Minimize physical updates
– To decrease database overhead with writing the logs
– It might be better to delete the records to be updated and then use a bulk-
loader to load the new records
– Some trial and error is necessary
• Perform aggregates outside of the DBMS
– SQL has count, max, etc functions and group_by, order_by
contracts
– But they are slow compared to dedicated tools outside the DBMS
• Replace entire table (if updates are many compared to the table
size)
52. Guaranteeing Referential
Integrity1. Check Before Loading
• Check before you add fact
records
• Check before you delete
dimension records
• Best approach
2. Check While Loading
• DBMS enforces RI
• Elegant but typically SLOW
• Exception: Red Brick
database system is capable
of loading 100 million records
an hour into a fact table
where it is checking
referential integrity on all the
dimensions simultaneously!
3. Check After Loading
• No RI in the DBMS
• Periodic checks for invalid
foreign keys looking for
invalid data
• Ridiculously slow
53. Cleaning and Conforming
• While the Extracting and Loading part of
an ETL process simply moves data, the
cleaning and conforming part (the
transformation part truly adds value)
• How do we deal with dirty data?
– Data Profiling report
– The Error Event fact table
– Audit Dimension
54. Managing Indexes
Indexes are performance enhancers at query time but
kill performance at insert and update time
1. Segregate inserts from updates
2. Drop any indexes not required to support
updates
3. Perform the updates
4. Drop all remaining indexes
5. Perform the inserts (through a bulk loader)
6. Rebuild the indexes
55. Managing Partitions
• Partitions allow a table and its indexes to be partitioned in mini-tables for
administrative purposes and to improve performance
• Common practice: partition the fact table on the date key, or month, year,
etc
• Can you partition by a timestamp on the fact table?
• Partitions maintained by DBA or by ETL team
• When partitions exist, the load process might give you an error
• Notify the DBA or maintain the partitions in the ETL process
• ETL maintainable partitions
– select max(date_key) from StageFactTable
– Select high_value
from all_tab_partitions
where table_name=FactTable and
partition_position = (select max(partition_position)
from all_tab_partitions
where table_name=FactTable)
– Alter table FactTable add partition Y2005 values less than (key)
56. Managing the rollback log
• The rollback log supports mid-transaction
failures; the system recovers from uncommitted
transactions by reading the log
• Eliminate the rollback log in a DW, because
– All data are entered via a managed process, the ETL
process
– Data are typically loaded in bulk
– Data can easily be reloaded if the process fails
57. Defining Data Quality
• Basic definition of data quality is data accuracy
and that means
– Correct: the values of the data are valid, e.g., my
resident state is CA
– Unambiguous: The values of the data can mean only
one thing, e.g., there is only one CA
– Consistent: the values of the data use the same
format, e.g., CA and not Calif, or California
– Complete: data are not null, and aggregates do not
lose data somewhere in the information flow