March Market Update Mercer County Real Estate
•
0 likes•212 views

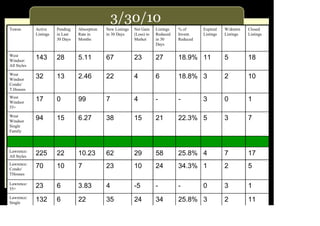
The facts are in the data. Know the market and get information that you can't find anywhere else on the web. Check out my market update and let me know how I can help you with your real estate needs. The following stats on West Windsor, Lawrence, East Windsor, Ewing, Hopewell, Cranbury, Plainsboro, South Brunswick, Montgomery, Hamilton, Franklin, Princeton Township, Princeton Boro, Robbinsville, Hightstown, Penningtion, and Monroe are provided:

Recommended
More Related Content
More from Weichert Real Estate Agent
More from Weichert Real Estate Agent (20)
March Market Update Mercer County Real Estate
- 1. 3/30/10 Towns Active Pending Absorption New Listings Net Gain Listings % of Expired W/drawn Closed Listings in Last Rate in in 30 Days (Loss) to Reduced Invent. Listings Listings Listings 30 Days Months Market in 30 Reduced Days West Windsor: 143 28 5.11 67 23 27 18.9% 11 5 18 All Styles West Windsor 32 13 2.46 22 4 6 18.8% 3 2 10 Condo/ T.Houses West Windsor 17 0 99 7 4 - - 3 0 1 55+ West Windsor 94 15 6.27 38 15 21 22.3% 5 3 7 Single Family Lawrence: All Styles 225 22 10.23 62 29 58 25.8% 4 7 17 Lawrence: Condo/ 70 10 7 23 10 24 34.3% 1 2 5 THouses Lawrence: 55+ 23 6 3.83 4 -5 - - 0 3 1 Lawrence: Single 132 6 22 35 24 34 25.8% 3 2 11
- 2. 3/30/10 Towns Active Pending Absorption New Net Listings % of Expired W/drawn Closed Listings in Last Rate in Listings in Gain Reduced Invent. Listings Listings Listings 30 Days Months 30 Days (Loss) in 30 Reduced to Days Market Plainsboro All Styles 79 18 4.39 36 14 19 24.1% 1 3 12 Plainsboro Condo/ 37 11 3.36 20 8 9 24.3% 0 1 3 THouses Plainsboro 55+ 16 1 16 0 -1 - - 0 - 3 Plainsboro Single 26 6 4.33 16 7 10 38.46 1 2 6 Family % Cranbury: All Styles 23 1 23 2 -1 7 30.4% 1 1 2 Cranbury: 55+ 1 0 99 0 -1 - - 0 1 0 Cranbury: Single 22 1 22 2 0 7 31.8% 1 0 2 Family
- 3. 3/30/10 Towns Active Pending Absorption New Net Gain Listings % of Expired W/drawn Closed Listings in Last Rate in Listings in (Loss) to Reduced Invent. Listings Listings Listings 30 Days Months 30 Days Market in 30 Reduced Days Ewing: All Styles 231 24 9.63 46 9 62 26.8% 8 5 13 Ewing : Condo/ 35 7 5 4 -4 7 20% 0 1 1 T.Houses Ewing 55+: 5 0 99 0 0 - - 0 0 0 Ewing: Single 191 17 11.23 42 13 55 28.8% 8 4 12 Family East Windsor: 180 19 9.47 40 5 27 15% 12 4 20 All Styles East Windsor: 95 4 23.75 23 6 12 12.6% 9 4 18 Condo/ THouses East Windsor: 21 0 99 1 1 - - 0 0 0 55+ East Windsor: 64 15 4.26 16 -2 15 23.4% 3 0 2 Single Family
- 4. 3/30/10 Towns Active Pending Absorption New Net Gain Listings % of Expired W/drawn Closed Listings in Last 30 Rate in Listings in (Loss) to Reduced Invent. Listings Listings Listings Days Months 30 Days Market in 30 Reduced Days Hopewell Twp. All Styles 161 14 11.5 42 28 20 12% 9 4 9 Hopewell Twp. Condo/ 19 1 19 12 11 1 5% 1 0 3 T.Houses Hopewell Twp.: 6 0 99 - - - - - -- - 55+ Hopewell Twp Single Family 136 13 10 30 17 19 14% 8 4 6 Hamilton: All Styles 568 87 6.5 191 104 137 24% 48 16 46 Hamilton: Condo/ THouses 118 22 5 59 37 33 28% 14 3 13 Hamilton: Single Family 414 64 6 132 68 104 25% 34 13 33 Hamilton: 55+ 35 1 35
- 5. 3/30/10 Towns Active Pending Absorption New Net Gain Listings % of Expired W/drawn Closed Listings in Last 30 Rate in Listings in (Loss) to Reduced Invent. Listings Listings Listings Days Months 30 Days Market in 30 Reduced Days Robbinsville All Styles 115 9 13 45 36 21 18% 8 6 18 Robbinsville Condo/ T.Houses 63 5 13 27 22 8 13% 5 4 11 Single Family 52 4 13 18 14 13 25% 3 2 7 Hightstown Boro: All Styles 70 5 14 15 10 16 23% 5 0 4 Pennington 19 8 2 6 (2) 5 26% 0 0 2 Hopewell Boro 18 2 9 4 2 6 33% 3 0 0
- 6. 3/30/10 Towns Active Pending Absorption New Net Gain Listings % of Expired W/drawn Closed Listings in Last 30 Rate in Listings in (Loss) to Reduced Invent. Listings Listings Listings Days Months 30 Days Market in 30 Reduced Days Princeton Boro: All Styles 37 0 99 11 9 9 24.3% 2 0 6 Pton -Boro Condo/ Thouses 12 0 99 4 2 4 33.3% 2 0 1 Pton-Boro Single Family 25 0 99 7 7 5 20% 0 0 5 Pton Twp: All Styles 113 3 37.67 34 27 17 15.04 1 3 6 % Pton Twp: Condo/ Thouses 16 0 99 28 27 1 6.3% 0 1 5 Pton Twp: Single Family 97 3 32.33 6 0 16 16.5% 1 2 1
- 7. 3/30/10 Towns Active Pending Absorption New Net Listings % of Expired W/drawn Closed Listings in Last Rate in Listings in Gain Reduced Invent. Listings Listings Listings 30 Days Months 30 Days (Loss) in 30 Reduced to Days Market South Brunswick 192 19 5 75 56 24 12 21 8 18 All Styles South BrunswickCon 58 4 24 35 -1 14 24 2 2 8 do/ T.Houses South Brunswick 27 6 5 1 -5 1 5 2 1 2 55+ South Brunswick 107 9 12 39 30 9 9 11 5 8 Single Family Monroe: All Styles 425 36 12 111 75 64 15 44 17 24 Monroe: 55+ 253 21 12 67 46 35 14 29 8 22 Monroe: Single Family 172 15 11 44 29 29 5 15 9 2
- 8. 3/30/10 Towns Active Pending Absorption New Net Listings % of Expired W/drawn Closed Listings in Last Rate in Listings in Gain Reduced Invent. Listings Listings Listings 30 Days Months 30 Days (Loss) in 30 Reduced to Days Market Franklin All Styles Franklin Condo/Twnhm s Franklin 55+ Franklin Single Family Rocky Hill Rocky Hill Single Family Franklin Condo/Twnhm s
- 9. 3/30/10 Towns Active Pending Absorption New Net Gain Listings % of Expired W/drawn Closed Listings in Last 30 Rate in Listings in (Loss) to Reduced Invent. Listings Listings Listings Days Months 30 Days Market in 30 Reduced Days Montgomery All Styles 125 19 6.6 41 9 26 21% 6 7 16 Montgomery Condo/Twnhms 17 5 3.4 6 -1 5 1 1 5 Single Family 108 14 7.7 35 13 21 5 6 11 Hillsborough All Styles 208 34 6.1 76 28 53 25% 12 18 18 Hillsborough Single Family 133 19 7.0 45 19 40 5 10 11 Hillsborough Condo/Twnhms 75 15 5.0 31 9 13 7 8 7