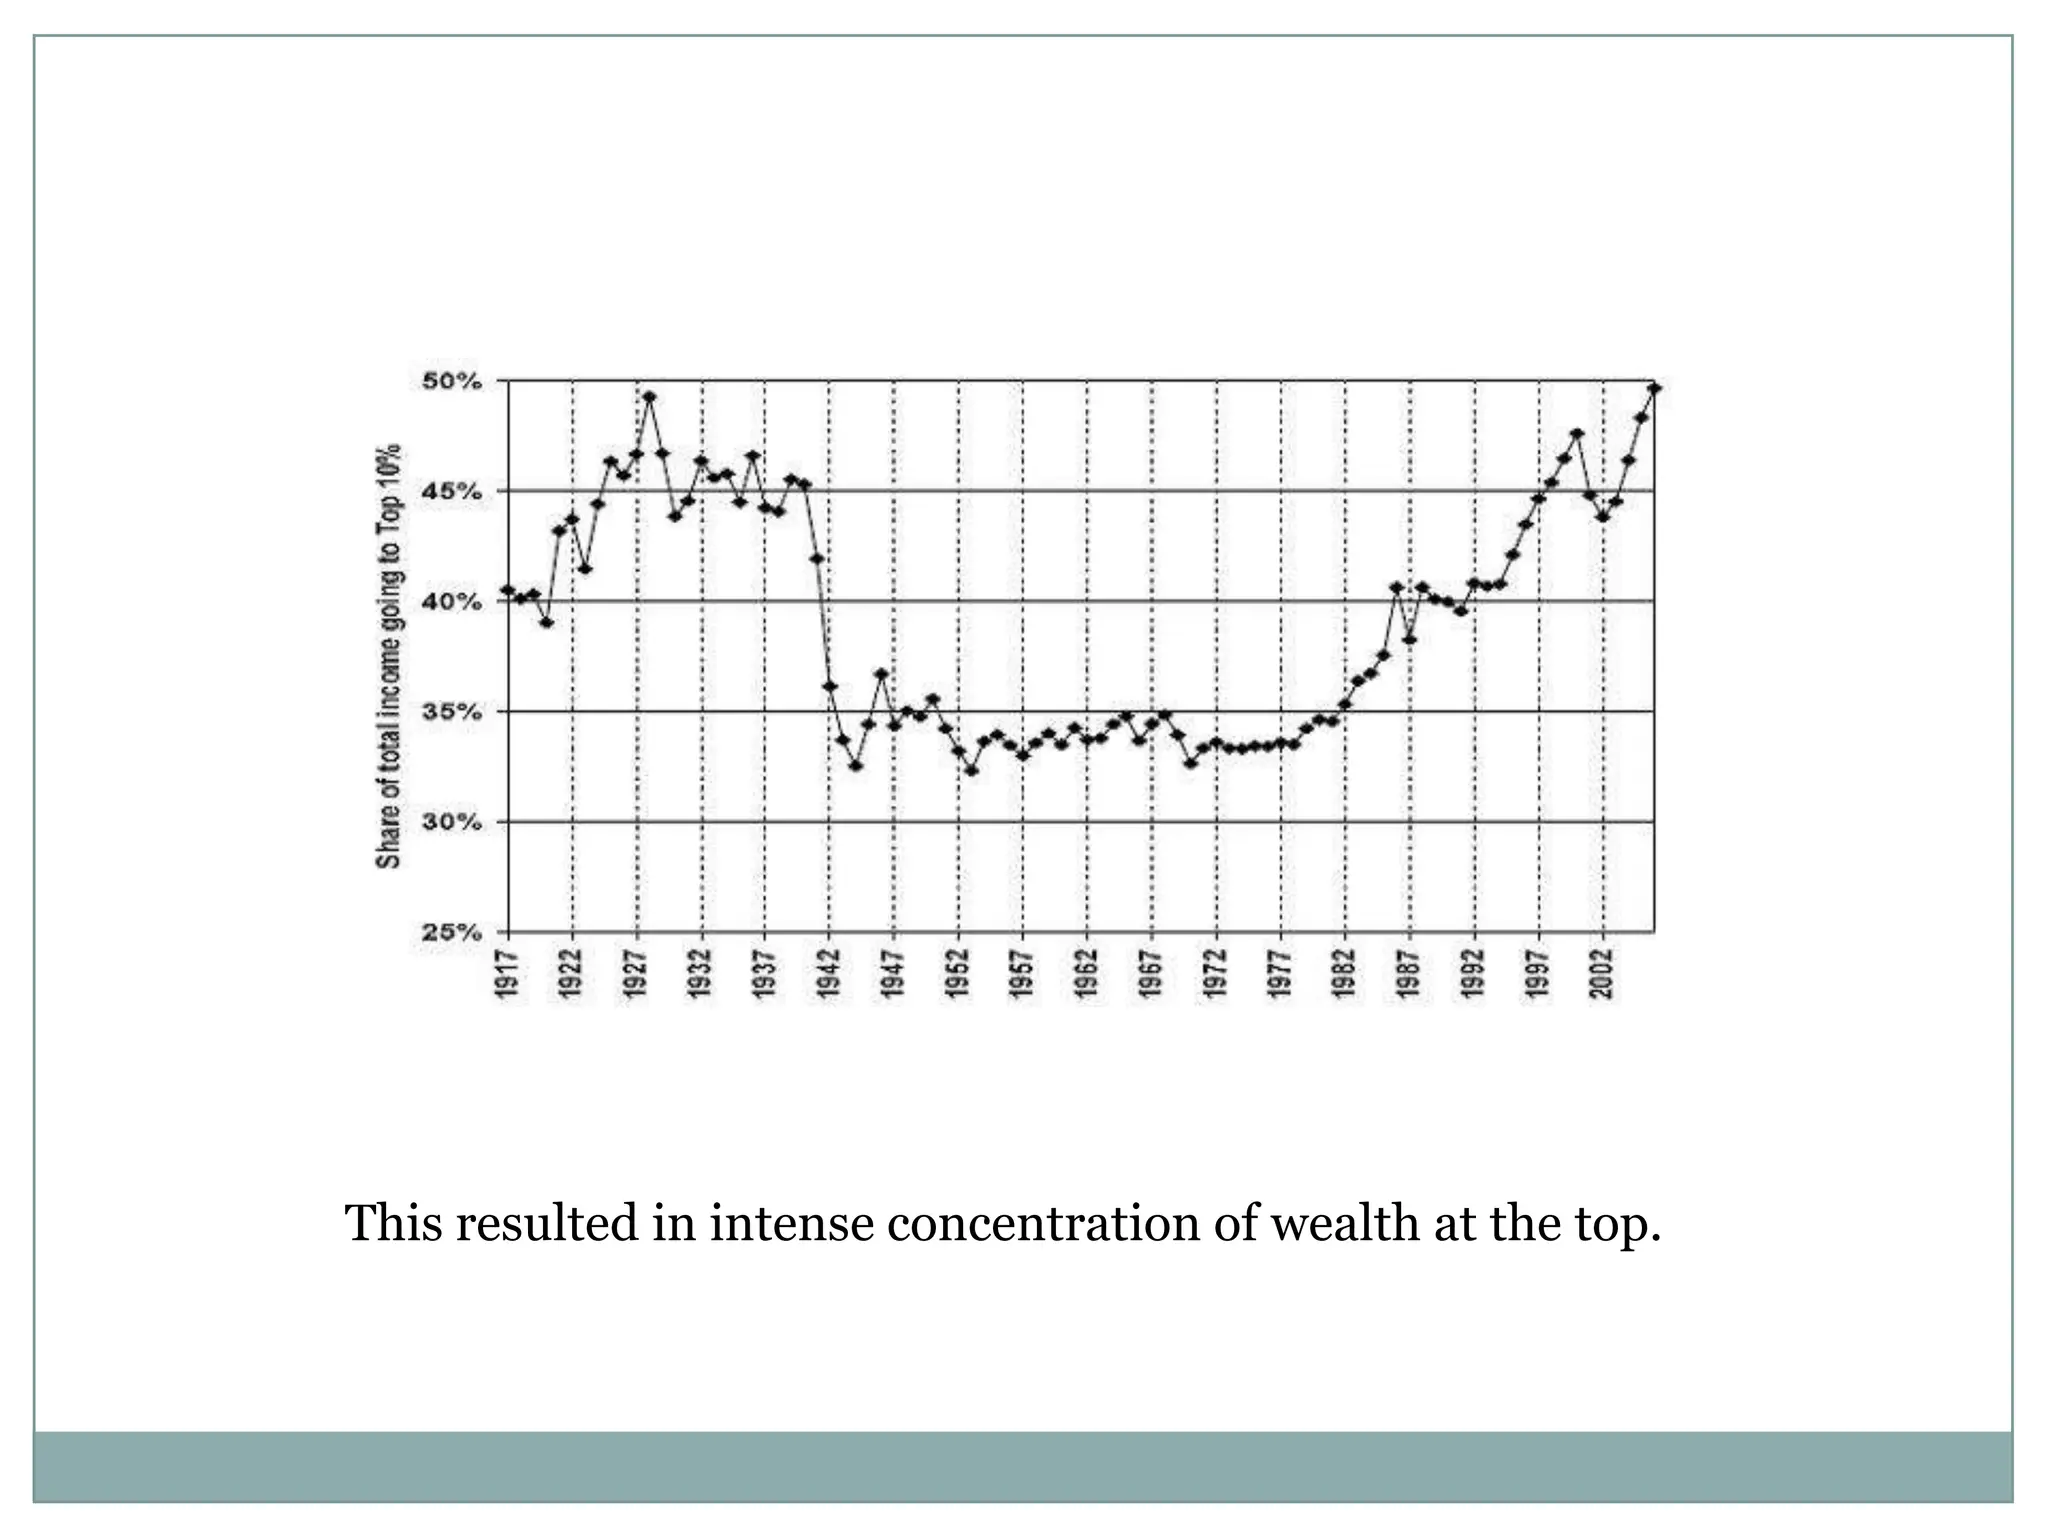
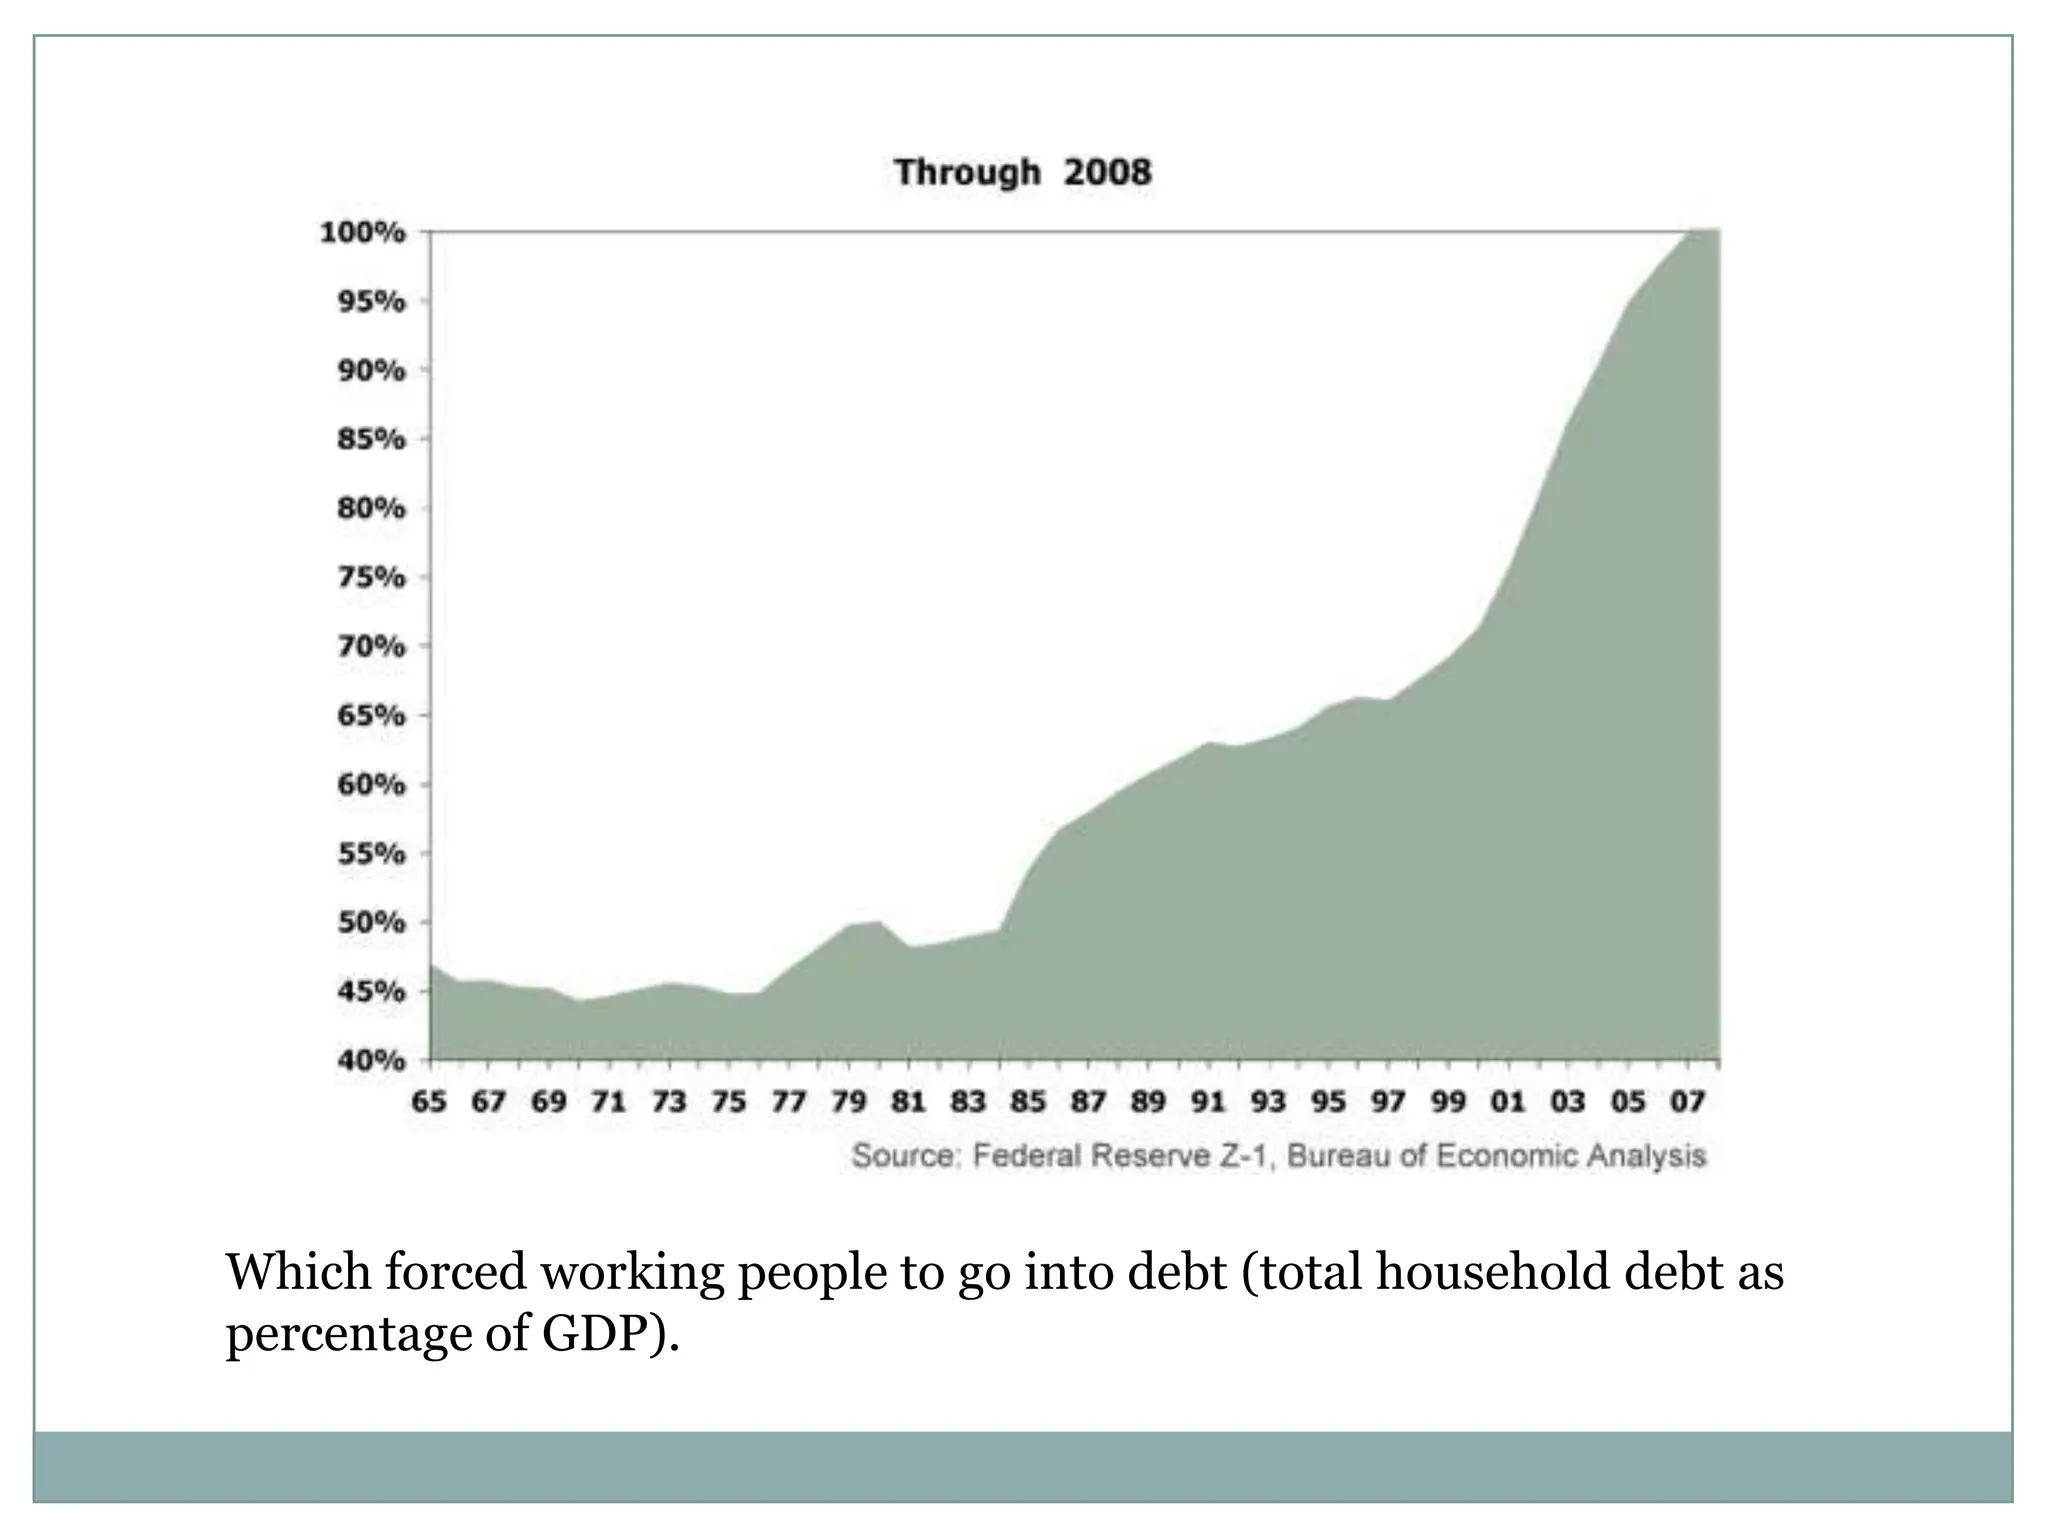
Look at a chart of almost anything and around 1981 or soon after you'll see the chart make a sharp change in direction, and not in a good way. And I really do mean almost anything, from economics to trade to infrastructure to ... well almost anything. I spent some time looking for charts of things, and here are just a few examples. In each of the charts below look for the year 1981, when Reagan took office.