1. II THE REAL ECONOMY
MACROECONOMIC SCENE 2.2 The services sector continues to 'lead' the
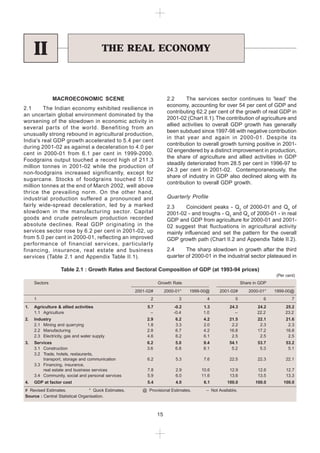
economy, accounting for over 54 per cent of GDP and
2.1 The Indian economy exhibited resilience in
contributing 62.2 per cent of the growth of real GDP in
an uncertain global environment dominated by the
2001-02 (Chart II.1). The contribution of agriculture and
worsening of the slowdown in economic activity in
allied activities to overall GDP growth has generally
several par ts of the world. Benefiting from an
been subdued since 1997-98 with negative contribution
unusually strong rebound in agricultural production,
in that year and again in 2000-01. Despite its
India's real GDP growth accelerated to 5.4 per cent
contribution to overall growth turning positive in 2001-
during 2001-02 as against a deceleration to 4.0 per
02 engendered by a distinct improvement in production,
cent in 2000-01 from 6.1 per cent in 1999-2000.
the share of agriculture and allied activities in GDP
Foodgrains output touched a record high of 211.3
steadily deteriorated from 28.5 per cent in 1996-97 to
million tonnes in 2001-02 while the production of
24.3 per cent in 2001-02. Contemporaneously, the
non-foodgrains increased significantly, except for
share of industry in GDP also declined along with its
sugarcane. Stocks of foodgrains touched 51.02
contribution to overall GDP growth.
million tonnes at the end of March 2002, well above
thrice the prevailing norm. On the other hand,
industrial production suffered a pronounced and Quarterly Profile
fairly wide-spread deceleration, led by a marked 2.3 Coincident peaks - Q2 of 2000-01 and Q4 of
slowdown in the manufacturing sector. Capital 2001-02 - and troughs - Q3 and Q4 of 2000-01 - in real
goods and crude petroleum production recorded GDP and GDP from agriculture for 2000-01 and 2001-
absolute declines. Real GDP originating in the 02 suggest that fluctuations in agricultural activity
services sector rose by 6.2 per cent in 2001-02, up mainly influenced and set the pattern for the overall
from 5.0 per cent in 2000-01, reflecting an improved GDP growth path (Chart II.2 and Appendix Table II.2).
perfor mance of financial ser vices, par ticularly
financing, insurance, real estate and business 2.4 The sharp slowdown in growth after the third
services (Table 2.1 and Appendix Table II.1). quarter of 2000-01 in the industrial sector plateaued in
Table 2.1 : Growth Rates and Sectoral Composition of GDP (at 1993-94 prices)
(Per cent)
Sectors Growth Rate Share in GDP
2001-02# 2000-01* 1999-00@ 2001-02# 2000-01* 1999-00@
1 2 3 4 5 6 7
1. Agriculture & allied activities 5.7 -0.2 1.3 24.3 24.2 25.2
1.1 Agriculture – -0.4 1.0 – 22.2 23.2
2. Industry 2.9 6.2 4.2 21.5 22.1 21.6
2.1 Mining and quarrying 1.8 3.3 2.0 2.2 2.3 2.3
2.2 Manufacturing 2.8 6.7 4.2 16.8 17.2 16.8
2.3 Electricity, gas and water supply 4.6 6.2 6.1 2.5 2.5 2.5
3. Services 6.2 5.0 9.4 54.1 53.7 53.2
3.1 Construction 3.6 6.8 8.1 5.2 5.3 5.1
3.2 Trade, hotels, restaurants,
transport, storage and communication 6.2 5.3 7.6 22.5 22.3 22.1
3.3 Financing, insurance,
real estate and business services 7.8 2.9 10.6 12.9 12.6 12.7
3.4 Community, social and personal services 5.9 6.0 11.6 13.6 13.5 13.3
4. GDP at factor cost 5.4 4.0 6.1 100.0 100.0 100.0
# Revised Estimates. * Quick Estimates. @ Provisional Estimates. – Not Available.
Source : Central Statistical Organisation.
15
2. ANNUAL REPORT
Chart II.1 : Sectoral Distribution of Economic Activity
2001-02. Industrial growth increased marginally from
2.5 per cent in Q1 of 2001-02 to 3.4 per cent in Q4 of
2001-02. The quarterly growth rate of the services
sector fluctuated between 2.9 per cent and 7.0 per cent
during Q4 of 2000-01 and Q4 of 2001-02 (Table 2.2).
AGGREGATE DEMAND
2.5 The distribution of aggregate demand in
nominal terms indicates a marginal compositional
shift from private final consumption expenditure
towards government final consumption expenditure
in 2000-01. On the other hand, the rate of
government fixed capital formation in relation to
GDP which had fallen by over a percentage point
during 1997-98 to 1999-2000 from the average of
7.8 per cent during the high growth period of 1994-
95 to 1996-97, registered a modest increase in
2000-01. The rate of private fixed capital formation
has remained sluggish since the 1990s at around
15 per cent of GDP. The rate of change in stocks
Table 2.2 : Quarterly Estimates of Gross Domestic Product (at 1993-94 prices)
Percentage change over the corresponding quarter of the previous year
Sector 2001-02 2000-01
Q1 Q2 Q3 Q4 Q1 Q2 Q3 Q4
1 2 3 4 5 6 7 8 9
1. Agriculture and allied activities 1.1 6.3 7.6 7.6 1.8 3.9 -0.8 -4.0
2. Industry 2.5 2.7 3.0 3.4 7.6 6.4 7.0 4.1
2.1 Mining & quarrying -0.3 0.7 3.1 3.5 4.8 3.6 4.3 0.9
2.2 Manufacturing 2.7 2.6 2.9 3.1 8.1 7.1 7.1 4.6
2.3 Electricity, gas and water supply 3.9 5.4 3.8 5.4 7.1 4.5 9.3 4.0
3. Services 5.1 6.0 6.6 7.0 6.3 6.9 4.4 2.9
3.1 Construction -0.2 2.7 4.4 7.5 12.4 10.0 7.2 -1.2
3.2 Trade, hotels, transport, storage and communication 4.5 6.3 6.6 7.2 8.1 6.3 4.8 2.4
3.3 Financing, insurance, real estate and
business services 7.0 7.6 8.1 8.3 3.7 3.9 2.1 2.0
3.4 Community, social and personal services 6.5 5.4 6.2 5.6 3.2 9.8 5.0 5.8
4. GDP at factor cost 3.5 5.3 6.2 6.4 5.4 6.2 3.4 1.5
Note : Data are provisional.
Source : Central Statistical Organisation.
16
3. THE REAL ECONOMY
decelerated substantially to 1.0 per cent in 2000-01 Table 2.4 : Growth in Select Sources of Real
from 1.7 per cent in 1999-2000, indicating improved Effective Demand #
(Per cent)
inventory management. Net exports (exports minus
imports) rose from (-)2.0 per cent of GDP in 1999- Item 2000- 1999- 1998- 1997- 1994-95
01* 00@ 99@ 98 to
2000 to (-)0.8 per cent in 2000-01 reflecting sluggish 1996-97
domestic demand for imports (Table 2.3). (Average)
Table 2.3 : Demand Distribution of Nominal Gross 1 2 3 4 5 6
Domestic Product 1. Total Final Consumption
(As percentage of GDP at current market prices) Expenditure 2.9 6.5 7.4 3.8 6.0
Of which :
Item 2000- 1999- 1998- 1997- 1994-95
Private Final
01* 00@ 99@ 98 to
1996-97 Consumption 2.2 5.5 6.4 2.6 6.2
(Average) Government Final
Consumption 6.5 12.0 12.9 11.1 4.6
1 2 3 4 5 6
2. Total Investment + 2.0 15.7 1.3 7.7 11.0
1. Private Final Consumption 64.2 65.4 65.1 64.1 64.9
Private Investment ++ 1.1 18.1 2.6 16.4 16.3
2. Government Final Public Investment ++ 3.0 16.2 7.3 -0.8 1.4
Consumption 13.2 12.9 12.3 11.3 10.7
3. Private Fixed Capital 3. Total Fixed Investment 4.7 8.6 8.7 2.1 10.9
Of which :
Formation 15.1 15.2 15.1 15.3 15.3
Private Fixed 2.4 10.0 8.4 4.1 16.3
4. Government Fixed Capital
Public Fixed 10.9 4.9 9.4 -2.8 1.9
Formation 6.8 6.4 6.5 6.4 7.8
5. Change in Stocks 1.0 1.7 -0.1 0.9 0.9 # Based on select disposition of real GDP at market prices.
6. Exports net of Imports -0.8 -2.0 -1.7 -1.3 -0.9 * Quick Estimates.
Of which: Exports 13.9 11.8 11.2 10.9 10.5 @ Provisional.
Imports 14.7 13.8 12.9 12.1 11.4 + Adjusted for errors and omissions.
++ Unadjusted for errors and omissions.
* Quick Estimates. @ Provisional.
Source : Central Statistical Organisation. Source : Central Statistical Organisation.
2.6 In real ter ms, the growth rate of final Table 2.5 : Sector-wise Rates of
consumption expenditure declined sharply to 2.9 per Gross Capital Formation
cent in 2000-01, well below the average of 6.0 per
(as percentage of GDP at
cent during the high growth period of 1994-95 to 1996- current market prices)
97. The slowdown in real final consumption demand
Item 2000-01* 1999-00@ 1998-99
affected both private and government sectors.
1 2 3 4
Significantly, the growth in real gross domestic capital
1. Household Sector 9.9 9.6 8.4
formation witnessed a pronounced deceleration from
2. Public Sector 7.1 7.1 6.6
15.7 per cent in 1999-2000 to 2.0 per cent in 2000-
3. Private Corporate Sector 5.9 6.5 6.4
01, mirroring the slackening of both public and private
4. Gross Domestic Capital
investment. The large fluctuations in real investment Formation (GDCF)# 24.0 24.3 22.7
reflect mainly the volatility in the behaviour of stocks.
* Quick Estimates. @ Provisional.
Variations in real gross fixed capital formation have
# As GDCF is adjusted for errors and omissions, the sector-wise capital
been relatively moderate (Table 2.4).
formation figures do not add up to the GDCF.
Source : Central Statistical Organisation.
Capital Formation
Saving
2.7 The rate of gross domestic capital formation
(GDCF) at current prices decelerated from 24.3 per 2.8 The rate of gross domestic saving (GDS as
cent in 1999-2000 to 24.0 per cent in 2000-01 percentage of GDP at current market prices) edged
primarily on account of the rate of private corporate up from 23.2 per cent in 1999-2000 to 23.4 per cent
investment which decelerated from 6.5 per cent in in 2000-01 (Table 2.6 and Appendix Table II.3). All
1999-2000 to 5.9 per cent in 2000-01. The public the constituent sectors registered improvement in
sector investment rate remained stable at 7.1 per cent saving rates except the public sector which increased
for the years 1999-2000 and 2000-01 (Table 2.5, its dissaving rate from 0.9 per cent in 1999-2000 to
Chart II.3 and Appendix Table II.3). 1.7 per cent in 2000-01 (Chart II.4).
17
4. ANNUAL REPORT
2.9 The saving rate of the dominant constituent - attracted lower accretions than in the preceding year
the household sector - increased by 0.6 percentage (Chart II.5 and Appendix Table II.4).
point in 2000-01. Saving in both physical assets and 2.11 Tentative estimates of the Reserve Bank,
financial assets contributed to this increase. While based on latest available data, place the rate of
the household sector continued to show preference household financial saving at 10.9 per cent in
for saving in the form of financial assets in keeping 2001-02 as against the revised estimate of 10.8
with the general trend in the 1990s, the divergence per cent in 2000-01 (Table 2.7). Instrument-wise,
between rates of saving in financial assets and this marginal improvement in household financial
physical assets has been narrowing in recent saving is primarily attributable to currency and
years. claims on gover nment held by the household
2.10 The improvement in the financial saving of the sector. In contrast, the rate of household financial
household sector in 2000-01 occurred in the forms of
bank deposits, claims on government and insurance
funds. Provident and pension funds, currency holdings
and shares and debentures, on the other hand,
Table 2.6 : Gross Domestic Saving and Sectoral
Saving Rates
(as percentage of GDP at
current market prices)
Item 2000-01* 1999-00@ 1998-99
1 2 3 4
1. Household Saving 20.9 20.3 18.9
1.1 Financial Assets 11.0 10.8 10.5
1.2 Physical Assets 9.9 9.6 8.4
2. Public Sector Saving -1.7 -0.9 -1.0
3. Private Corporate Saving 4.2 3.7 3.7
4. Gross Domestic Saving (1+2+3) 23.4 23.2 21.7
* Quick Estimates. @ Provisional.
Source : Central Statistical Organisation.
18
5. THE REAL ECONOMY
Table 2.7 : Household Saving In Financial Assets
(Amount in rupees crore)
Item 2001-02# 2000-01P 1999-00P 1998-99
1 2 3 4 5
A. Financial assets (gross) 2,91,405 2,56,734 2,39,058 2,07,390
a) As per cent of GDP at current market prices 12.7 12.3 12.4 11.9
1. Currency 28,192 17,686 20,845 21,822
a) As per cent of GDP at current market prices 1.2 0.8 1.1 1.3
b) As per cent of financial assets (gross) 9.7 6.9 8.7 10.5
2. Deposits@ 1,12,517 1,05,078 89,598 80,520
a) As per cent of GDP at current market prices 4.9 5.0 4.6 4.6
b) As per cent of financial assets (gross) 38.6 40.9 37.5 38.8
3. Claims on government 49,923 39,008 28,985 28,220
a) As per cent of GDP at current market prices 2.2 1.9 1.5 1.6
b) As per cent of financial assets (gross) 17.1 15.2 12.1 13.6
4. Investment in shares and debentures+ 6,946 6,135 17,045 6,992
a) As per cent of GDP at current market prices 0.3 0.3 0.9 0.4
b) As per cent of financial assets (gross) 2.4 2.4 7.1 3.4
5. Contractual saving** 93,827 88,828 82,585 69,836
a) As per cent of GDP at current market prices 4.1 4.3 4.3 4.0
b) As per cent of financial assets (gross) 32.2 34.6 34.5 33.7
B. Financial liabilities 40,451 32,229 35,275 26,773
a) As per cent of GDP at current market prices 1.8 1.5 1.8 1.5
C. Saving in financial assets (Net) (A-B) 2,50,954 2,24,505 2,03,783 1,80,617
a) As per cent of GDP at current market prices 10.9 10.8 10.6 10.4
# Preliminary. P Provisional.
@ Comprise bank deposits, non-bank deposits and trade debt (net).
+ Including units of Unit Trust of India and other Mutual Funds.
** Comprise Life Insurance, Provident and Pension Funds.
Notes : 1. Based on the latest available information, these data are revised in July 2002 and hence may not tally with the data published in the
Quick Estimates of the Central Statistical Organisation released in January 2002.
2. Components may not add up to the total due to rounding off.
3. Data on GDP at current market prices for 2001-02 are not yet available from the CSO. In this Table, GDP at current market prices for
2001-02 has been estimated on the basis of the revised estimates of GDP at factor cost at current prices for 2001-02 released b y the
Central Statistical Organisation in June 2002.
saving in deposits is estimated to have shown a
marginal decline from 5.0 per cent in 2000-01 to
4.9 per cent in 2001-02 on account of the non-
bank deposits; household saving in the form of
bank deposits increased from 4.5 per cent to 4.8
per cent. The household saving in the for m of
contractual instruments (life insurance fund and
provident and pension funds) declined from 4.3 per
cent in 2000-01 to 4.1 per cent in 2001-02 partly
reflecting the lowering of the rate of return on these
instruments.
2.12 The overall saving-investment gap narrowed
to 0.6 per cent of GDP in 2000-01 from 1.1 per cent
in the previous year, mainly on account of the
continuing upward movement in the gross domestic
saving rate. Underlying the behaviour of the macro-
balance is a deterioration in the public sector deficit
since 1997-98. On the other hand, the private sector
surplus has improved since 1998-99 (Chart II.6).
19
6. ANNUAL REPORT
AGGREGATE SUPPLY
2.13 Aggregate supply conditions received a
favourable impetus from the robust revival of
agriculture during 2001-02. This augurs well for a
more broad-based recovery in the current year. Inter-
sectoral analysis of agriculture, industry and services
indicates that an upturn in agricultural output in
2001-02 is likely to have favourable implications for
industry with a pick up in rural demand, especially
for consumer goods (Chart II.7). The higher growth
of the services sector in 2001-02 could also have a
positive impact on industry.
2.14 Global economic conditions are providing
incipient signs of recovery. Within the domestic
economy, credit flow is picking up in some
infrastructure sectors like ports, telecommunications,
roads and construction. The cement sector recorded
an improved performance during 2001-02, giving lead
indications of increased activity in the construction
and housing sectors. The Economic Times - National
production (base : triennium ending 1981-82=100)
Council for Applied Economic Research (ET-NCAER)
increased sharply by 7.5 per cent in 2001-02 in contrast
business confidence index has improved by 9.3 per
to a fall of 6.6 per cent in the previous year (Appendix
cent to 102.3 points in the June 2002 round from 93.6
Table II.5). In consonance, real GDP originating from
points in the April 2002 round.
agriculture and allied activities surged up by 5.7 per
Agriculture cent in contrast to a decline of 0.2 per cent in 2000-01.
2.15 Foodgrains production increased by 15.4 Rainfall Conditions
million tonnes during 2001-02, scaling a new peak at
211.3 million tonnes. The production of non-foodgrain 2.16 The rejuvenation of agricultural production
crops such as oilseeds and cotton also showed in 2001-02 is attributable to better spatio-temporal
improvement (Chart II.8). The index of agricultural distribution of rainfall. The South-West monsoon was
normal for thirteen years in a row with precipitation
at 90 per cent of the Long Period Average (LPA) in
the 2001 season and 30 (highest in the last seven
years) out of 35 meteorological sub-divisions
reporting excess/normal rainfall (Chart II.9). There
was adequate rainfall in 71 districts of 11 states,
viz. , Chhattisgarh, Gujarat, Haryana, Himachal
Pradesh, Kerala, Madhya Pradesh, Orissa, Punjab,
Rajasthan, Tamil Nadu and Uttar Pradesh, which had
experienced drought conditions in 2000. Following
better precipitation, the maximum storage attained
in 70 major reservoirs in the country in 2001 at 87.5
billion cubic metres was significantly higher than the
previous year's level of 82.7 billion cubic metres,
despite the lower starting storage level. Consequent
to the good monsoon, kharif foodgrains production
posted a new peak at 111.5 million tonnes. Kharif
non-foodgrains production also recorded
considerable improvement.
2.17 The North-East monsoon season also turned
out to be satisfactory in 2001-02 with excess/normal
20
7. THE REAL ECONOMY
rainfall in 23 out of 35 sub-divisions as compared monsoon dur ing ear ly Febr uar y 2002 and a
with only 4 sub-divisions in 2000-01 (Chart II.10). prolonged cold spell facilitated an increase in wheat
2.18 Despite significant advances in technology, output to 71.5 million tonnes during 2001-02. The
Indian agriculture continues to be rain-dependent production of pulses increased to 13.5 million tonnes
and fluctuations in agricultural production continue in 2001-02 from 10.7 million tonnes in the previous
to be driven by variations in spread and intensity of year. The output of coarse cereals also increased,
monsoon. Consequently, even transient aberrations albeit moderately.
in spatio-temporal distribution of rainfall exacerbate 2.20 The index of non-foodgrains (base: triennium
moisture stress leading to drought-like conditions. ending 1981-82=100) rose by 5.7 per cent in 2001-
In this regard, an appropriate assessment of drought 02 in contrast to a fall of 5.7 per cent in the previous
conditions is critical (Box II.1). year. The improvement in non-foodgrains output
was mainly due to the increased output of oilseeds,
Production cotton and jute and mesta, even as sugarcane
2.19 The production of rice at 91.6 million tonnes suffered a moderate decline mainly on account of
was a new record. The late rains in the North-East moisture stress in the States of Maharashtra,
Box II.1
Assessment of Drought: Some Analytical Issues
Drought generally refers to deficiency of precipitation over is deficient by 25 per cent or more of the LPA; a deficiency
an extended period of time leading to moisture stress. The of 50 per cent is characterised as a severe meteorological
consequent adverse effect on agricultural production, drought. IMD does not take into account the temporal
livestock and human beings is reflected in loss of output distribution of rainfall in its definition; however, this assumes
and fall in farm incomes. Further, prolonged periods of importance in assessing the impact of deficient rainfall.
droughts may result in desertification of land. There is no The National Commission of Agriculture identifies two kinds
unanimity on the measurement of the severity of drought. of droughts – agricultural and hydrological. Agricultural
Var ious measurements ranging from deviance of drought is a situation of
precipitation from Long Period Average (LPA) to complex
l four consecutive weeks of severe meteorological
indices incorporating factors like rainfall, surface and ground
drought or weekly rainfall of 5 cm. or less during the
water availability, prevailing temperatures, etc., are being
kharif season; or
used in estimating the severity of drought in various
countries. The India Meteorological Department (IMD) l six weeks of severe meteorological drought during the
defines a meteorological drought as one in which the rainfall rest of the year. (Contd....)
21
8. ANNUAL REPORT
(Concld....) varied climatic conditions and is currently in use in
Hydrological drought refers to prolonged meteorological Colorado, USA, which has var ied topography. It is
drought resulting in depletion of surface water and a fall in noteworthy that a comprehensive Drought Severity Index
ground water level, causing severe shortage of water for is developed by scientists at Anna University, Chennai,
livestock and human needs. though it is not yet used for identifying drought-hit areas
in the country.
In India, State Gover nments declare drought on
judgements based on information on rainfall, water Currently, the policy response to natural disasters can be
shor tage and the consequent percentage crop loss. reactive (i.e., recovery from disasters), or anticipatory (i.e.,
Generally, if 50 per cent or more of standing crop in a prevention and mitigation of disasters by reducing the risk
particular district is estimated to be destroyed or damaged of occurrence of disasters) and planned adaptiveness. The
due to insufficient rainfall or irrigation water, that district Food and Agriculture Organisation suggests some
is declared drought-hit. Arguably, the major factor in agriculture-specific prevention and mitigation measures
declar ing any area as drought-hit in India is the which include: crop and livestock diversification; plant
percentage deviation from the LPA. It is necessary to breeding for shor t cycle crops resistant to drought,
recognise, however, that this approach suffers from the diseases and pest attacks; pest and disease control
lacuna that the mean precipitation (as reflected in LPA) measures; improved rangeland and water management;
is not a true representative of normal, as rainfall does floodplain zoning and control; land terracing; soil
not follow a normal distribution. conservation; planting of shelterbelts or windbreaks;
improved coastal fishing practices; afforestation; forest
In some countries, severity of drought is identified by management; sand dune stabilisation; improved food
more scientific drought indices that assimilate data on storage and preservation; etc.
rainfall, stream flows, water supply, reservoir levels .
These indices take into account the temporal distribution The World Health Organisation opines that the strategies
of rainfall and also incorporate the impact of the rainfall to deal with the impacts of climate change need inter-
deficiency on soil moisture, duration of drought . Drought sectoral and cross-sectoral adaptive measures such as
indices such as Palmer Drought Severity Index (PDSI), (i) increasing the robustness of infrastructural designs and
Crop Moisture Index (CMI), Surface Water Supply Index long-term investments, (ii) increasing the flexibility and
(SWSI), or the Standardised Precipitation Index (SPI) adaptability of vulnerable natural systems, (iii) reversing the
are in use to determine grant of emergency drought trends that increase vulnerability, and (iv) improving social
assistance. In the USA, PDSI, which measures the awareness and preparedness. Scientists at the
departure of moisture supply and the duration of drought International Food Policy Research Institute opine that
while incorporating the temporal distribution of rainfall developing capacity to acquire, generate, manage and
and is not unduly impacted by brief spells of rainfall or interpret special information is of crucial importance. They
its deficiency, is commonly used for identifying drought. recommend investment in programmes and methods that
The PDSI is more suitable for regions of homogenous foster the build-up of human and technical capacity to
topological conditions. The SPI is the most recently generate problem-specific schema.
developed index and is considered superior to the PDSI.
The SPI reflects the impact of drought on the availability
References:
of different water sources and soil moisture conditions
that respond to anomalies of rainfall over multiple time- 1. Food and Agriculture Organisation (1998), “The
scales. One of the major advantages of SPI is that it Emergency Sequence : What FAO Does – How FAO
helps to predict the occurrence of drought months before Does it”, Rome
it actually occurs and hence provides adequate time to 2. World Health Organisation (2000), “Climate Change and
plan for public intervention. SPI is suited to regions with Human Health : Impact and Adaptation”, Geneva.
Karnataka and Tamil Nadu and par ts of Andhra 2.22 There has been a shift in the cropping pattern
Pradesh (Table 2.8). from pulses and coarse cereals towards the cultivation
of superior cereals. The share of acreage under rice
2.21 Eastern States continued to improve their
and wheat in total area covered under foodgrains
performance as Assam, Bihar, Jharkhand, Orissa and increased steadily. On the other hand, the shares of
West Bengal together contributed an additional 5.5 acreage under pulses and coarse cereals have
million tonnes of foodgrains to the national kitty. declined since 1990-91 (Table 2.9). There has also
Haryana, Himachal Pradesh and Jammu and Kashmir been a steady improvement in yields of rice and
also achieved appreciable increases in output. wheat. On the other hand, yields of coarse cereals
Haryana's wheat output is estimated to have crossed and pulses fluctuated widely, leading to unstable
the ten million tonne mark for the first time. output of these crops.
22
9. THE REAL ECONOMY
Table 2.8 : Agricultural Production Table 2.9 : Share of Acreage Under
(Million tonnes) Different Foodgrains
(Per cent)
Crop 2001-02 2000-01 1999-00 Rice Wheat Coarse Pulses Total Food-
1 2 3 4 Cereals grains
All crops: Annual 1 2 3 4 5 6
Growth Rate+ (per cent) 7.5 -6.6 -1.4 1990-91 33.39 18.90 28.41 19.29 100.00
Foodgrains 211.3 195.9 209.8 1991-92 34.99 19.09 27.42 18.50 100.00
1992-93 33.92 19.97 27.95 18.16 100.00
Rice 91.6 84.9 89.7
1993-94 34.65 20.49 26.73 18.13 100.00
Wheat 71.5 68.8 76.4
1994-95 34.56 20.75 25.97 18.59 100.00
Coarse Cereals 34.7 31.6 30.3 1995-96 35.40 20.67 25.52 18.41 100.00
Pulses 13.5 10.7 13.4 1996-97 35.15 20.95 25.74 18.16 100.00
Non-Foodgrains 1997-98 35.08 21.56 24.90 18.47 100.00
Oilseeds++ 20.7 18.4 20.7 1998-99 35.79 21.99 23.44 18.78 100.00
1999-00 36.69 22.33 23.83 17.16 100.00
Of which : Groundnut 7.1 6.2 5.3
2000-01 37.03 20.93 25.32 16.72 100.00
: Soyabean 5.8 5.3 7.1 2001-02 35.84 20.95 24.34 18.87 100.00
Sugarcane 292.2 299.2 299.3
Cotton @ 11.7 9.7 11.5 increased from 38.8 million tonnes in 1983-84 to 81.0
Jute and Mesta# 10.8 10.5 10.6 million tonnes in 2000-01 (averaging 1.9 per cent per
Tea* 823.4 823.4 805.6 annum). Similarly, India is the world's fifth largest
Coffee* 317.0 301.2 292.0 producer of eggs with the production of eggs
+ Based on the Index of Agricultural Production with base: trien- increasing from 12.8 billions to 32.4 billions (2.2 per
nium ending 1981-82=100.
cent per annum) during the same period. India ranked
++ For nine oilseeds out of eleven in all.
seventh in meat production. Fish production increased
@ Million bales of 170 kg. each.
# Million bales of 180 kg. each.
from 2.51 million tonnes in 1983-84 to 5.7 million tonnes
* Million kg. and data for tea on a calendar year basis. in 2000-01 (2.2 per cent per annum). India is also the
world's second largest producer of fruits and
2.23 The development of allied activities of vegetables.
agriculture such as dairying, poultry, fisheries and
Procurement, Off-take and Food Stocks
food processing industries is acquiring importance in
view of employment potential in these activities and 2.24 Total procurement of foodgrains reached a
the World Trade Orgnisation (WTO) binding on tariffs. new peak of 41.3 million tonnes in 2001-02 mainly
Moreover, the per capita availability of these products on account of increases in Minimum Support Prices
is still much lower than the world averages. India has (MSP) of rice and wheat, even as the stage is being
the world's largest cattle population and leads in milk set for vacation of interventions in the determination
production. The production of milk in the country of the prices of foodgrains (Box II.2).
Box II.2
Withdrawing Price Interventions : The Supply Side Response
Price intervention in agriculture in the form of Minimum wheat at a high level making the cultivation of these two
Support Prices (MSP) and Central Issue Prices (CIP) under crops more remunerative than pulses and coarse cereals.
the Public Distribution System (PDS) has been made with MSPs announced for rice and wheat are always higher than
the objective of providing remunerative prices to producers, the market prices and the cost of cultivation. In case of crops
on one hand, and food security to the poor, on the other. In such as oilseeds and pulses, however, the MSPs barely cover
the absence of these interventions, farmers have to resort the cost of cultivation and are always lower than the market
to distress sales due to weak bargaining power and prices, and hence fail to provide incentives for cultivation of
monopsony practices by market functionaries. Restrictions these crops.
on movement of various agricultural commodities under the
On the input front, the administered pricing of fertilisers
Essential Commodities Act (ECA), 1955, have indirectly
involving heavy subsidies accorded to urea manufacturing
controlled the prices of these commodities, forcing the
by way of the retention price scheme has contributed to
farmers to depend on the procurement mechanism for market
the skewed consumption in favour of nitrogenous fertiliser
clearance. These controls on agriculture seem to have biased
(urea) and increased soil salinity. Subsidised availability
the cropping patterns in favour of certain crops like rice and
of water has led to cultivation of irrigation intensive crops
wheat. Even in years of bumper production, the MSP
mechanism has helped to maintain the prices of rice and (Contd....)
23
10. ANNUAL REPORT
(Concld....) in the Union Budget 2002-03 to rationalise the prices of
various fer tilisers and to reduce the skewness in the
such as rice and wheat. Subsidised availability of electricity consumption pattern of fertilisers.
has led to proliferation of water extraction structures like
borewells, with adverse implications for the water table. The impetus to agricultural growth will have to come from
demand-driven production and crop diversification. Such a
Withdrawal of public intervention in agricultural commodities market-driven growth can happen only in the presence of
began with the removal of various commodities, including adequate infrastructure like storage, transportation and the
rice and wheat, from the pur view of the Essential development of food processing industry and withdrawal of
Commodities Act. Overlap with State legislation including price interventions. Creation of adequate storage and
in respect of Public Distribution System has stood in the processing facilities for the perishable horticultural products
way of decentralising procurement operations. would encourage diversification. An integrated agricultural
Higher subsidies accorded to urea on the basis of the mar keting strategy is required in order to ensure
retention price scheme is proposed to be replaced by a group remunarative prices to farmers an avoid distress sales.
concession scheme, in line with the recommendations of Introduction of futures markets would lead to price discovery
the High Powered Committee on fertiliser pricing (Chairman: and provide price signals to farmers for basing their
Prof. C.H. Hanumantha Rao). Some measures were taken production decisions.
2.25 The total off-take of rice and wheat during
2001-02 at 31.3 million tonnes was higher than 2000-
01, reversing the decline in the previous year. This
rise in off-take was distributed across all categories,
although it was relatively high under the Open Market
Sales Scheme (OMSS). Off-take under the Targeted
Public Distribution System (TPDS) rose to 13.8 million
tonnes in 2001-02, a turnaround from the declining
trend of the previous two years. The increase in TPDS
off-take was attributable to the downward revision of
Central Issue Prices (CIP) of rice and wheat by around
30 per cent for the Above Pover ty Line (APL)
consumers in July 2001, as also to the Antyodaya
Anna Yojana scheme. Off-take under Other Welfare
Schemes (OWS) witnessed substantial improvement
during the year. Despite the higher off-take and large
open market sales, the increased procurement
resulted in stocks of foodgrains attaining a new peak
of 51.0 million tonnes at end-March 2002 (Chart II.11).
The Central issue concerning PDs is that of supply
chain management and ensuring prompt delivery of
foodgrains in scarcity areas. economy, as brought out by the study by the
Administrative Staff College of India (ASCI), Hyderabad
2.26 Procurement of rice and wheat at 22.1 million
commissioned by the Reserve Bank (Box II.3).
tonnes during the first quarter of 2002-03 was lower
by 4.4 per cent than in the corresponding period of 2.27 Although the average share of agriculture
the previous year. Procurement of wheat at 18.9 and allied activities in GDP has declined from 36.4
million tonnes was lower than that of 20.5 million per cent in the 1980s to 32.2 per cent in 1990-91
tonnes. Rice procurement was higher at 3.2 million and further to 24.3 per cent in 2001-02, more than
tonnes than 2.7 million tonnes during the corresponding two-thirds of the population continues to depend
period of 2001-02. The total off-take of rice and wheat upon agriculture. In India, agriculture provides
in the first quarter of 2002-03 (up to end-June 2002) employment to about 60 per cent of the total
was higher at 10.1 million tonnes than 5.2 million productive workforce. Agricultural development has,
tonnes during the corresponding period in 2001-02. therefore, rightly come to be regarded as an indicator
The total stock of foodgrains was higher at 63.1 of the quality of life at the grass root level, especially
million tonnes as at end-June 2002 than 62.0 million in generating private consumption demand. All the
tonnes, a year ago. The high stocks of foodgrains three basic objectives of economic development, i.e.,
have serious fiscal and monetary implications for the output and employment growth, price stability and
24
11. THE REAL ECONOMY
Box II.3
Fiscal and Monetary Implications of Excess Foodgrains Stocks
The rising level of food stocks in India is engaging policy or the banks or both. The ultimate obligation could well be
attention, not only from the point of view of social cost of perceived as sovereign by virtue of the fact that the existing
sub-optimal level of food consumption by a large arrangements, under which food credit was extended by
populace, but also on account of costs of maintaining the banks with the implicit comfort of the Government of
excess food stocks which impact on the fisc and on the India.
banking system. Within long-term measures to reduce The study suggested a menu of options that could be
such costs, the medium and short-term strategies entail considered in order to reduce the overhang of stocks. The
a gradual reduction of excess food stocks over a five- study also emphasised a need to work out a multi-pronged
year period. approach wherein a combination of measures may have
The study undertaken by the Administrative Staff College to be undertaken. These are: orderly disposal of stocks
of India (ASCI) looks at monetary and fiscal implications avoiding major price implications to farmers at harvest time;
of excess stocks- inflationary effect of cash injections into MSP adjustments in relation to market prices; and a long
the economy, fiscal burden on account of the growing food term strategy of diversification in the main surplus foodgrain
subsidy, with a large section of consumers not gaining the growing areas. While measures are necessary to avoid
benefit of the subsidy. Furthermore, the marketability of additional costs to the fisc, it is important to aim the whole
the stock will depend on the quality of foodgrains at the policy prescription at achieving a “soft landing” which will
time of procurement and the age of the stock. If, of the 60 require that both stock and flow aspects to be dealt with
million tonnes of current stock, 20 per cent is more than simultaneously.
four years old and if it were to be written off, the credit risk
to the banking system would be substantial. Since the Reference
build-up of food stocks and credit arrangements for such 1. Administrative Staff College of India (2002), A Study
operations was a result of public policy, the burden of this of the Fiscal and Monetary Implications of Excess
credit risk could devolve either on the Government of India Stocks of Food Grains, Hyderabad.
poverty alleviation are best served by growth of the the production of capital goods sector and a listless
agriculture sector (Box II.4). performance of the infrastructure industries. Business
sentiment was dampened by the uncer tainties
Industry characterising the domestic and global environment
including specific incidents purveying extreme instability
2.28 The slowdown in industrial activity deepened such as the September 11, 2001 terrorist attacks in the
during 2001-02, affecting all industry groups and US and the recent disturbances in an industrially
symptomatically manifested itself in disinflation of advanced State like Gujarat. Infrastructural bottlenecks
manufacturing prices, low investment activity, - power, communication, transport and labour laws -
persistence of excess capacity, an absolute decline in continued to be a binding constraint on industrial revival.
Box II.4
Agriculture, Employment and Poverty
According to the 55th Round of the NSSO’s sample survey continue to exist. The rural poverty ratio is still relatively
(July 1999 to June 2000), the poverty ratio (on a 30-day high in Orissa, Bihar and North-Eastern States.
recall basis) fell to 26.1 per cent in 1999-2000 from 36.0
Growth in the primar y and ter tiar y sectors has the
per cent in 1993-94. It declined from 37.3 per cent to 27.1
maximum impact on reducing poverty, while the impact of
per cent in rural areas and from 32.4 per cent to 23.6 per
growth in the secondar y sector is relatively less.
cent in urban areas. A significant feature is that the number
Accordingly, an effective strategy for alleviation of poverty
of poor which remained fairly constant at about 320 million
has to be based on rapid and sustained growth of the
for two decades has come down to 260 million in 1999-
agricultural and allied sector and rural industrialisation
2000. State-wise poverty ratios have also declined during
centered around agro-industries. Increasing investment in
this period. A significant reductions in poverty was noticed
irrigation and developing marketing infrastructure, diversifying
during the period in the States of Kerala, Jammu & Kashmir,
into non-foodgrains, allied activities, development of drought
Goa, Lakshdweep, Delhi, Andhra Pradesh, Gujarat, Tamil
resistant seeds and developing avenues for self employment
Nadu, Karnataka, West Bengal and Andaman and Nicobar
Islands. However, rural-urban and inter-state disparities (Contd....)
25
12. ANNUAL REPORT
(Concld....) A Special Group (Chairman Dr. S.P. Gupta) constituted by
are key elements of employment-oriented growth. This involves the Planning Commission for targeting 10 million jobs
suitable labour intensive technologies consistent with different annually during the Tenth Plan period estimated the
agro-climatic regions and technologies for sustainable unemployment rate in 1999-2000 at 7.3 per cent of the
utilisation of natural resources. total labour force. In this context, the Group recommended
that suitable measures should be taken to accelerate the
A Task Force on Employment Opportunities was set up growth of the unorganised sector (which provides about
by the Planning Commission (Chairman: Shri M. S. 92.0 per cent of employment) to solve the unemployment
Ahluwalia) to examine the employment scenario in India problem in the country. The Group further observed that
and to suggest strategies for employment generation. The deregulated and properly restructured agricultural sector
Task Force recommended, inter alia , action in five major will have high job potential. The Group suggested that
areas: (i) accelerating the rate of growth of GDP, with a dereservation of small scale industrial sector should be
particular emphasis on sectors likely to ensure the spread done on case-to-case basis rather than complete
of income to the low income segments of the labour force; dereservation at one go. The Group also suggested
(ii) pursuing appropriate sectoral policies in individual amendment in the Contract Labour Act with appropriate
sectors which are particularly important for employment social security net in place.
generation; these sector level policies must be broadly
consistent with the overall objective of accelerating GDP References
growth; (iii) implementing focused special programmes 1. Government of India (2001), Report of the Task Force
for creating additional employment and enhancing income on Employment Opportunities (Chairman Shri Montek
generation from existing activities aimed at helping Singh Ahluwalia), Planning Commission, New Delhi.
vulnerable groups that may not be sufficiently benefited
2. Gover nment of India (2002), Special Group on
by the more general growth promoting policies; (iv)
Targetting Ten Million Employment Opportunities per
pursuing suitable policies for education and skill
year over the Tenth Plan Period (Chairman: Dr. S.P.
development, which would upgrade the quality of the
Gupta), Planning Commission, New Delhi.
labour force and make it capable of supporting a growth
process which generates high quality jobs and (v) 3. Tendulkar, S.D and L. R. Jain (1996), “Growth, Distributional
ensuring that the policy and legal environment governing Change and Poverty Reduction in India - A Decomposible
the labour mar ket encourages labour absor ption, Exercise for Seventeen States of India”, Indian Journal of
especially in the organised sector. Agricultural Economics, Vol. 51, No.1& 2.
2.29 Real GDP originating from the industrial
sector grew only by 2.9 per cent in 2001-02 as against
6.2 per cent in 2000-01 and 4.2 per cent in 1999-
2000. The growth of real GDP in the manufacturing
sector decelerated to 2.8 per cent in 2001-02 from
6.7 per cent in 2000-01 and 4.2 per cent in 1999-
2000. The deceleration in industrial GDP growth was
contributed by all constituent groups during 2001-02
(Chart II.12).
2.30 The Index of Industrial Production (IIP)
showed lower growth in each month of 2001-02,
except March 2002. During 2001-02, the IIP rose by
only 2.8 per cent as compared with 4.9 per cent
recorded during 2000-01 and 6.7 per cent during
1999-2000. The slowdown was visible across all
constituent sub-sectors (Chart II.13).
Manufacturing Sector
2.31 Dominating the sluggish industrial activity was
the poor performance in the manufacturing sector. In
the second half of the 1990s, the pace of expansion 1999-2000, this could not be sustained in the following
of manufacturing output fell away from the high growth year. In 2001-02, the slowdown in manufacturing
phase of 1994-96. Although the deceleration levelled became wide spread, affecting a broad spectrum of
off in 1998-99 and a modest recovery set in during constituent industries.
26
13. THE REAL ECONOMY
2.32 The relative contribution of the manufacturing
sector (with a weight of 79.36 per cent in the IIP) to
the growth of IIP declined to 85.3 per cent during 2001-
02 from 87.3 per cent during 2000-01 (Appendix Table
II.7). At a disaggregated level, 12 out of 17 two-digit
industry groups registered positive growth during
2001-02. Out of the 12 industry groups, five groups
(20.86 per cent weight in IIP) witnessed an
acceleration while the remaining seven groups (37.80
per cent weight in IIP) decelerated, broadly
comparable to the group-wise distribution of industrial
performance in 2000-01. The other five groups (20.7
per cent weight in IIP) suffered declines as against
three such groups during the previous year. Industry
groups such as 'beverages, tobacco and related
products' and 'rubber, plastic, petroleum and coal
products' weathered the slowdown, posting growth
rates above 10 per cent. On the other hand, 'food
products', 'cotton textiles', 'jute and other vegetable
fibre textiles (except cotton)', 'metal products and parts
(except machinery and equipment)' and 'wood and Use-based Classification
wood products, furniture & fixtures', recorded declines
(Chart II.14 and Appendix Table II.8). Four industry 2.34 The performance of the capital goods sector
groups of the manufacturing sector recorded growth deteriorated further during 2001-02 with the growth
rates of above 5 per cent in four out of the five years rate of 1.8 per cent during 2000-01 weakening into
during 1997-98 to 2001-02 (Appendix Table II.9). an absolute decline of 3.4 per cent during 2001-02.
2.33 During 2002-03 (up to June 2002), the IIP All other sectors, viz., basic goods, intermediate goods
recorded a growth of 4.0 per cent as against 2.2 per and consumer goods recorded lower growth in
cent in the corresponding period of the previous year. comparison with the preceding year (Chart II.15 and
Manufacturing recorded a growth of 3.7 per cent as Appendix Table II.10). In terms of monthly growth
compared with 2.6 per cent in the corresponding rates, the capital goods sector recorded absolute
period of the previous year. Electricity and mining also declines in all the months of 2001-02 except November
registered higher growth. 2001, February 2002 and March 2002 (Chart II.16).
27
14. ANNUAL REPORT
1.6 per cent during April-June 2002-03 as against a
decline of 6.0 per cent during April-June 2001-02.
The intermediate goods sector, however, recorded
a lower growth of 1.1 per cent during April-June
2002-03 as compared with 3.3 per cent during April-
June 2001-02.
2.37 There has been a decline in the share of the
industrial sector in gross fixed capital formation
(GFCF) in the recent years (Chart II.18). This, in turn,
has been one of the major factors contributing to the
recent industrial slowdown.
2.35 Since the late 1990s, the trends in domestic
production have generally exhibited contrasting
movements to those of imports of capital goods
reflecting enhanced substitutability in an increasingly
competitive environment (Chart II.17).
2.36 Basic and consumer goods sectors
registered an accelerated growth of 5.1 per cent and
6.5 per cent, respectively, during April-June 2002-
03 as against 1.4 per cent and 4.8 per cent in the
corresponding period of the previous year. The
capital goods sector too registered an increase by
Infrastructure Industries
2.38 The performance of infrastructure industries
deteriorated during 2001-02. The composite index
of six key infrastructure industries, with a weight of
26.68 per cent in the IIP, rose by 2.9 per cent as
compared with 5.1 per cent during 2000-01 (Appendix
Table II.11); on a year-on-year basis, however, the
growth rate remained higher since December 2001
(Chart II.19).
2.39 Cement production recorded a growth of 7.4
per cent after undergoing a decline of 0.9 per cent in
the previous year. Coal also posted a higher growth
of 4.2 per cent during 2001-02 than 3.5 per cent during
2000-01. On the other hand, petroleum refinery
products, electricity and steel sectors recorded lower
growth while the crude petroleum output declined
(Chart II.20).
2.40 Out of 10 infrastructure industries including
those covered in the composite index of infrastructure
28
15. THE REAL ECONOMY
industries, only cement and railways exceeded their outlay (as a ratio of GDP at current market prices)
targets during 2001-02 (Table 2.10). registered a significant decline in some of the key
infrastructure sectors during the period 1990-91 to
2.41 The composite index of six infrastructure 1999-2000. For example, public sector plan outlay
industries recorded a higher growth of 5.7 per cent in respect of energy declined steadily from 3 per cent
during April-June 2002-03 as against 1.2 per cent in of GDP in 1990-91 to 2.2 per cent in 1999-2000 while
the corresponding period of the previous year reflecting the outlay for transport remained almost constant,
improved growth performance in all infrastructure ranging between 1.2 and 1.4 per cent of GDP during
industries. 1990-91 through 1999-2000. Investment in the key
2.42 In India, infrastructure has received the infrastructure sectors comprising electricity, gas and
highest policy attention since the early 1990s (Box II.5). water supply, and transpor t, storage and
Considerable success has been achieved over these communication has declined from 5.2 per cent of
years in some sectors; however, public sector plan GDP in 1990-91 to 4.5 per cent in 2000-01. The
Table 2.10 : Targets and Achievements of Infrastructure Industries
Sector Unit 2001-02 2000-01
Target Achieve- Gap Target Achieve- Gap
ment (Per cent) ment (Per cent)
1 2 3 4 5 6 7 8
1. Power Billion Unit 540 515 -4.5 501 500 -0.2
2. Coal Million Tonnes 323 323 0 308 310 0.5
3. Finished Steel Thousand Tonnes 13,569 13,137 -3.2 13,250 12,685 -4.3
4. Railways Million Tonnes 489 492 0.7 475 474 -0.3
5. Shipping Million Tonnes 289 288 -0.5 284 281 -1.0
6. Telecommunications Thousand Lines 7,916 6,957 -12.1 7,235 7,146 -1.2
7. Fertilisers Thousand Tonnes 16,589 14,628 -11.8 15,208 14,705 -3.3
8. Cement Million Tonnes 105 107 1.8 107 98 -8.8
9. Crude Petroleum Million Tonnes 33 32 -1.5 33 32 -0.3
10. Petroleum Refinery Products Million Tonnes 114 107 -5.4 113 103 7.6
Source: Ministry of Statistics and Programme Implementation, Government of India.
29
16. ANNUAL REPORT
Box II.5
Reforms in the Infrastructure Sector: Beating a Binding Constraint
A certain minimum investment in infrastructure is required States. A comprehensive Electricity Bill, 2001 has been
to achieve a sustainable level of growth. In recent years, introduced in the Parliament.
however, infrastructural bottlenecks, particularly in the
There have been some distinct signs of improvement in select
areas of highways, ports, telecommunications and power
sectors of infrastructure. The Compressed Natural Gas norms
have emerged as binding constraint on the realisation of
for motor vehicles have been updated. Out of the total length
the growth potential of the Indian economy.
of 5,861 kms under the Golden Quadrilateral Project, 1,063
In order to alleviate the constraint, numerous sector- kms have already been completed. The average pre-berthing
specific measures have been initiated since the 1990s. waiting time, an indicator of port efficiency, has come down
The Government has already announced a package of from 0.9 days in 1999-2000 to 0.5 days in 2000-01 while the
financial incentives to encourage pr ivate sector average turn around time has declined from 5.1 days to 4.3
participation in the road sector including modification of days over the same period. A beginning in phased
National Highways Act, 1956 allowing imposition of tolls. corporatisation has also been made by registering Ennore
In October 1998 the Government launched the National Port Company Ltd., for managing Ennore Port.
Highway Development Project (NHDP), which envisages
In the area of telecommunications, fixed telephone lines
a six-lane Golden Quadrilateral linking the Delhi-Kolkata-
have more than doubled over the last five years, apart
Chennai-Mumbai-Delhi circuit, a North-South Corridor
from fast expansion of cellular services covering about
connecting Kashmir to Kanyakumari and a similar East-
5.5 million subscribers during the period. There has been
West Corridor connecting Silchar to Saurashtra. The
dramatic reduction in the tariff rate for long distance
Central Road Fund was revamped by crediting a cess of
Subscriber Trunk Dialling and International Subscriber
Re.1 per litre of petrol and diesel and by enacting the
Dialling. The demand-supply gap has narrowed down from
Central Road Fund Act, 2000 in December 2000.
27.9 per cent in 1991-92 to 12.2 per cent in 2000-01. The
In the area of ports, the Ministry of Surface Transport issued number of telephones per 100 population in the rural area
guidelines for private sector participation in 1996. The Major however, remains only about one as against more than
Port Trusts Act was amended in 2000 for the purpose of joint 10 in the urban area.
venture formation. The major initiatives in the area of
The demand-supply gap in power, which reached a peak of
telecommunications include setting up of the Telecom
11.5 per cent during 1996-97, down to 7.5 per cent during
Regulatory Authority of India (TRAI), increased bandwidth
2001-02. Further improvement on this front is predicated
availability, unrestricted entry to the national long distance
upon, inter alia, one-time settlement of outstanding dues of
service, opening up of basic and cellular telephony and
the SEBs and their medium-term capital restructuring in line
introduction of the Communication Convergence Bill, 2001 in
with the recommendations by the Expert Group (Chairman:
the Parliament. Progressive corporatisation of public sector
Dr. M. S. Ahluwalia) set up by the Union Power Ministry in
service providers in the area of telecommunications including
2001. Besides, as par t of the demand management,
disinvestment of VSNL and transfer of management to the
conser vation of energy as envisaged in the Energy
Tata Group, dilution of VSNL monopoly for international long
Conservation Act, 2001 needs to be pursued.
distance service, permission to internet telephony are among
the recent initiatives.
References
The power sector has witnessed a series of reforms in 1. Government of India (2001), Report of the Expert
the recent period. In terms of institutional improvements Group on Power Sector (Chair man: Dr. M. S.
and transparency practices, the establishment of Central Ahluwalia), Ministry of Power, New Delhi.
Electricity Regulatory Authority and State Electricity
2. _____ (2002), Annual Reports, 2001-02, Ministries
Regulatory Commissions in 18 States so far is expected
of power, telecom, road and shipping , New Delhi.
to ensure rationalisation of tariffs, fair competition and
protection of the consumer interest. The State Electricity 3. 3i Network (2002), India Infrastructure Report 2002 ,
Boards (SEBs) have been unbundled/corporatised in six Oxford University Press, New Delhi.
30
17. THE REAL ECONOMY
investment in these infrastr ucture sectors as
proportion to gross capital formation also declined
from 23.6 per cent in 1990-91 to 22.8 per cent in
2000-01.
Mergers and Acquisitions (M & As)
2.43 During 2001-02, there were 1,050 acquisitions
involving an amount of Rs.35,360 crore as compared
to 1,183 acquisitions involving an amount of Rs.33,649
crore during the previous year. There were 98 open
offers involving an amount of Rs.4,788 crore during
2001-02 as compared to 76 open offers involving
an amount of Rs.2,626 crore during the previous
year. The number of mergers dur ing the year
remained unchanged at 294 as in the previous year.
S o m e o f t h e m a j o r d e a l s w e r e s t r uck i n
telecommunications and cement sectors, which
included BPL Communications and Birla-AT&T-Tata
mega merger to form the largest cellular company
in India and the Aditya Birla acquisition of stake in
Larsen & Toubro. with the annual average growth of 7.7 per cent
2.44 In order to facilitate and rationalise the attained during the period 1997-2002. As per the
process of industrial restructuring through M&As, revised estimates, the growth of real GDP from the
a number of initiatives were undertaken during the services sector rose to 6.2 per cent in 2001-02, up
year including relaxation of buy-back nor ms, from 5.0 per cent during 2000-01 but well below that
enhancement of the limit for creeping acquisition, of 9.4 per cent during 1999-2000. The share of
and withdrawal of tax exemption on ‘non-compete’ services was estimated to be 54.1 per cent of GDP in
payments in an acquisition deal. 2001-02 as against 53.7 per cent in 2000-01. Sectors
like 'financing, insurance, real estate and business
Small Scale Industries services' and 'trade, hotels, restaurants, transport,
storage and communication’ were the major contributors
2.45 Small Scale Industries (SSIs) perform a to growth in 2001-02 (Chart II.21).
significant role in terms of production, employment
and exports. During 2001-02, the number of SSI units 2.47 On an annual basis, the services sector has
was estimated to have increased to 34.4 lakh from exhibited a strong trend component which has
33.1 lakh in the previous year. During the period, provided an element of stability to the growth
the value of production by the SSI units also process. Quarterly data suggest the presence of
increased by 8.1 per cent to Rs.6,90,522 crore at seasonal elements particularly in the fourth quarter.
current prices, and by 6.0 per cent to Rs.4,77,870 A sub-sectoral analysis of quarterly estimates for
crore at constant prices, while the real GDP from 1996-97 through 2001-02 shows that the major
the industrial sector as a whole posted a growth of source of seasonality is the category of 'community,
2.9 per cent during the year. Employment in the SSI social and personal services' perhaps reflecting the
sector went up to 192.2 lakh from 185.6 lakh during increase in government spending on such services
the period. On the other hand, exports from the in the last quarter of the financial year (Chart II.22).
sector increased by 5.0 per cent from US $ 12.51
2.48 In the recent period, the behaviour of services
billion in 1999-2000 to US $ 13.13 billion in 2000-01,
sector has been considerably influenced by
which constituted about 35 per cent of direct exports
'financing, insurance, real estate & business services'.
from the country.
The improvement in the growth rate of the services
Services sector GDP in 2001-02 was bolstered by an
expansion of 7.8 per cent in this category. In the
2.46 The ser vices sector has been facing a preceding year, the deceleration of the sectoral
deceleration of growth in recent years in comparison growth was mainly due to a sharp deceleration in
31
18. ANNUAL REPORT
Chart II.22 : Services GDP and its Components (Actual and Deseasonalised)
recorded higher growth during the third and fourth
quarters of 2001-02. 'Community, social & personal
services' registered lower growth during the second
and fourth quarters of 2001-02 (Table 2.2).
Information Technology Services
2.50 Information technology (IT) services have
emerged as one of the fastest growing sectors of the
economy. As per the NASSCOM estimates, the share
of the sector has gone up to 2.9 per cent of GDP in
2001-02 from 2.8 per cent in 2000-01. The export
'financing, insurance, real estate & business services'. revenue from IT software and services at Rs.36,855
The non-banking financial institutions were primarily crore during 2001-02 is estimated to have grown by
responsible for the poor performance, with GDP from 30.0 per cent over the export revenue of Rs.28,350
'banking & insurance' registering an absolute decline crore during 2000-01.
of 2.2 per cent in 2000-01 from as high as 13.4 per
2.51 A notable feature of the str uctural
cent in 1999-2000.
transformation of the Indian economy in recent years
2.49 During 2001-02, the growth of services was has been the rising contribution of skill intensive
higher in the third and fourth quarters than that in the services with high value addition such as information
corresponding quarters of 2000-01. 'Construction' technology, to the overall output in the economy.
recorded higher growth during the fourth quarter of The services sector has emerged as the fastest
2001-02. 'Financing, insurance, real estate and expanding sector with implications for other sectors
business services' witnessed an acceleration in all the especially manufacturing in terms of productivity,
quarters. 'Trade, hotels, transport and communication' employment and trade (Box II.6).
32
19. THE REAL ECONOMY
Box II.6
Direct and Indirect Contribution of Services to Manufacturing
The sectoral inter-linkages and the extent of synergies and services indirectly measured (FISIM) used up in the
feedback effects between industrial and services sectors manufacturing. The FISIM as per cent of manufacturing
underpin the dynamics of growth. Increasing global gross value added increased from 5.7 per cent in 1990-91
integration and competitive pressures have expanded the to 7.6 per cent in 1999-2000.
demand for technology intensive and knowledge-based Empirical evidence suggests that the contribution of
ser vices. This has led to application of improved services to the production process of all the sectors has
management techniques in the production process, continuously increased over time. The expansionary impact
speeding up production and marketing and reaping of the services sector on non-services industries is also
economies of scale. The ‘externalisation’ of a large number measured with the help of the index of vertical integration
of services which are important inputs in production and in an input-output framework. Trade provides the strongest
distribution of goods is reflected in a rise in ‘outsourcing’ stimulus to the rest of the economy and the value added
of services and evolution of subsidiaries of production indirectly is over fourteen times higher than the direct value
enterprises selling services both to the parent enterprise added. Other services have the next strongest effect on
and other enterprises. Intermediate services, similar to the rest of the economy as the value added indirectly
intermediate material goods, are indispensable to the induced is over nine times higher than the direct
production process and are often a major source of contribution.
comparative advantage in manufacture for exports.
The contribution of information technology related services
Apart from providing inputs, services contribute to the to the manufacturing sector in India is also growing. A
outward shift of the industrial sector's production frontier segment-wise break up of the software industry's focus on
by enhancing productivity growth. The rapid diffusion of vertical segments shows that 72 per cent of manufacturing
information and communication technologies, which are companies use software applications, accounting for 40
an important segment of producer services, has been per cent of the product and packages sales of the IT
widely credited as the driving force behind the acceleration software and services. Infrastructure services such as
in U.S. labour productivity growth achieved during the transport and communication, are also critical inputs in
1990s. Social infrastructure services such as education, manufacturing and inadequate supply of such services is
health and other social services are also considered as operating as a constraint on output growth. Besides,
critical for improving labour productivity in manufacturing. concentration of these services has emerged as an
In the Indian context, producer services such as trade, important determinant of the pattern of industrial location.
transport and communication, financing, insurance, real Transport and communication services play a dominant role
estate and business services account for 70 per cent of in explaining the growth variations in India. The existence
the total services, reflecting the strong inter-linkages of significant demand-supply gaps in basic infrastructure
between services and goods producing sectors of the services in India continues to pose challenges for realising
economy. The empirical estimate of income elasticity of higher output growth in the goods producing sectors,
producer services at 1.2 reveals that a major part of particularly in manufacturing.
demand for services emanates from the income generated
in other sectors of the economy. The demand for producer References :
and government services, which constitutes mainly
intermediate consumption, has strong multiplier effects 1. Bhowmik, R. (2000), "Role of Services Sector in Indian
on real GDP. With regard to the producer services and Economy: An Input-Output Approach", Artha Vijnana,
manufacturing output, the causality is bi-directional. Vol.XLII, No.2.
Service intensity is found to be high for Indian industries. 2. Pradhan, B.K., A. Sahoo and M.R. Saluja (1999), "A
One of the indicators of direct contribution of services to Social Accounting Matrix for India, 1994-95", Economic
the manufacturing in India is financial intermediation and Political Weekly, Vol.XXXIV, No.48.
33