SlideShare a Scribd company logo
1 of 23
FICCI               CE


        Six Sigma
Six Sigma in simple terms
              Accurate and Precision
Six Sigma can be best explained
by using the analogy of a rifle firing
at a target.
Accuracy and precision
With the center of the target taken to be the true
value of the characteristic being measured and
by the rifle shots representing the measured
values, there are four combinations of accuracy
and precision as depicted in the following slides.
Inaccurate and imprecise
Accurate and imprecise
Precise but inaccurate
Accurate and precise
Objectives of Six Sigma


As observed from the Picturization in the preceding slides, the objective of
moving towards world class manufacturing a is to continuously achieve
greater consistency of the processes by aiming for higher levels of accuracy
& precision
FICCI                                                                         CE


                 Sigma in statistical terms


        Standard deviation is also referred to as the Greek letter sigma in
        quality management literature. Consequently process variation
        can be described by how many sigmas ( i.e how many multiples of
        standard deviation or SD ) fit within the specification limits.The
        higher this number, the better is the quality and vice versa.
        Sigma is a statistical measure of the quality consistency
        for a particular process / product.
FICCI                                                                      CE


        Sigma process


        From a sigma process we come to know that at what distance,
        in terms of the standard deviation, the specification limits are
        placed from the target value.
FICCI                                                                         CE


        Move beyond 3 sigma


          Until a few years back all statistical process controls were
          designed on the basis of 3 sigma limits. It is only in the recent
          years that this concept has been challenged and the
          organizations have started looking for quality levels beyond 3
          Sigma.
FICCI                                                                                            CE


                                3 Sigma process

                                                                 Mean=8
    LSL                                                          SD = 2               USL


        1    2     3      4     5      6   7    8     9    10     11 12 13       14    15   16

                              - 3 SD                             + 3 SD


            Note : LSL is Lower specification limit and USL is Upper specification limit.
FICCI                                                                              CE


                           4 Sigma process

        LSL                                          Mean=8             USL
                                                    SD = 1.33


        1 2   3   4    5       6   7   8   9   10   11 12       13 14   15    16

                      - 4 SD                        + 4 SD
FICCI                                                                          CE


                         5 Sigma process

                                                   Mean=8
   LSL                                            SD = 1.07         USL


        1   2   3   4   5    6   7   8   9   10     11 12 13   14    15   16

                        - 5 SD                     + 5 SD
FICCI                                                                             CE


                         6 Sigma process

                                                      Mean=8
   LSL                                                SD = 1           USL


        1   2   3   4    5       6   7   8   9   10    11 12 13   14   15    16

                        - 6 SD                        + 6 SD
FICCI                                                                   CE


                             Precision


        Lesser the standard deviation of the process, more precise or
                          consistent is the process
FICCI                                                                            CE


         3 Sigma Vs 6 Sigma


        The goal of Six Sigma program is to reduce the variation in every
        process to such an extent that the spread of 12 sigmas i.e. 6 Sigmas
        on either side of the mean fits within the process specifications. The
        figure on next slide shows what this looks like.
FICCI                                                                                                 CE

                                3 Sigma Vs 6 Sigma
                                                               6 Sigma curve

   LSL                                                                                     USL

                       3 Sigma curve


        1   2      3      4    5       6    7    8     9     10    11 12 13        14      15    16

                In a 3 sigma process the values are widely spread along the center line,
                  showing the higher variation of the process. Whereas in a 6 Sigma
                         process, the values are closer to the center line showing
                                       less variation in the process.
FICCI                                                                                                 CE


        3 Sigma Vs 6 Sigma


         The comparison on the previous slide also shows a process in which the process
         spread of Six Sigmas (ie. 3 Sigmas on either side just fits within the specifications). In
         this case one must be extremely careful to ensure that the process average never
         slips off the target, otherwise the curve will shift and non-conforming items will
         increase. With Six Sigma requirement the process mean can shift by as much as 1.5
         sigma before the likelihood of non-conforming items is increased. Even if the process
         mean does shift off center by as much as 1.5 sigma, only 3.4 non-conforming items
         per million parts should result.
FICCI                                                                             CE


                    Amount of process shift allowed

                             1.5 SD               1.5 SD


   LSL                                                                 USL

                    SD = 1


        1   2   3     4      5   6    7   8   9   10   11 12 13   14    15   16
FICCI                                                          CE


             Sigma levels and defect rate


        Quality level   % Quality             Defective PPM*


          3 Sigma         99.73                   66807

          4 Sigma        99.9937                  6210

          5 Sigma       99.999943                  233

          6 Sigma       99.9999998                 3.4


                         *Parts Per Million
FICCI                                                              CE


             Sigma levels & Cost of quality

  Sigma     Defect rate(PPM)   Cost of quality   Competitive level

        6       3.4              <10%
                                                       World
        5       233              10-15%                Class

        4      6210               15-20%
                                                      Industry
        3      66807              20-30%              Average

        2     308537              30-40%
                                                        Non
                                  >40%               Competitive
        1     6,90000
FICCI   CE

More Related Content

What's hot (20)

yellow belt training
yellow belt trainingyellow belt training
yellow belt training
 
Six Sigma
Six SigmaSix Sigma
Six Sigma
 
Six sigma ppt
Six sigma pptSix sigma ppt
Six sigma ppt
 
PROCESS CAPABILITY
PROCESS CAPABILITYPROCESS CAPABILITY
PROCESS CAPABILITY
 
Kaizen Poster
Kaizen PosterKaizen Poster
Kaizen Poster
 
Presentation introduction to six sigma
Presentation   introduction to six sigmaPresentation   introduction to six sigma
Presentation introduction to six sigma
 
Plan, Do, Study, Act (PDSA) Cycle in Total Quality Management
Plan, Do, Study, Act (PDSA) Cycle in Total Quality ManagementPlan, Do, Study, Act (PDSA) Cycle in Total Quality Management
Plan, Do, Study, Act (PDSA) Cycle in Total Quality Management
 
7 new QC TOOLS
7 new QC TOOLS7 new QC TOOLS
7 new QC TOOLS
 
Introduction to six sigma
Introduction to six sigmaIntroduction to six sigma
Introduction to six sigma
 
Six sigma
Six sigmaSix sigma
Six sigma
 
New seven qc tools
New seven qc toolsNew seven qc tools
New seven qc tools
 
Spc training
Spc training Spc training
Spc training
 
Basic Six Sigma Presentation
Basic Six Sigma PresentationBasic Six Sigma Presentation
Basic Six Sigma Presentation
 
Presentation on six sigma roles
Presentation on six sigma rolesPresentation on six sigma roles
Presentation on six sigma roles
 
Six Sigma By :Rajeev
Six Sigma By :RajeevSix Sigma By :Rajeev
Six Sigma By :Rajeev
 
Process capability
Process capabilityProcess capability
Process capability
 
Lean six sigma - Waste elimination (Yellow Belt)
Lean six sigma - Waste elimination (Yellow Belt)Lean six sigma - Waste elimination (Yellow Belt)
Lean six sigma - Waste elimination (Yellow Belt)
 
LEAN SIX SIGMA PROJECT - FINAL
LEAN SIX SIGMA PROJECT - FINALLEAN SIX SIGMA PROJECT - FINAL
LEAN SIX SIGMA PROJECT - FINAL
 
New 7 Management Tools
New 7 Management ToolsNew 7 Management Tools
New 7 Management Tools
 
Six sigma at Motorola
Six sigma at MotorolaSix sigma at Motorola
Six sigma at Motorola
 

Viewers also liked

Six Sigma Final
Six Sigma FinalSix Sigma Final
Six Sigma Finalanubhuti10
 
Six Sigma the best ppt
Six Sigma the best pptSix Sigma the best ppt
Six Sigma the best pptRabia Sgh S
 
Lean six sigma ppt rpr
Lean six sigma ppt rprLean six sigma ppt rpr
Lean six sigma ppt rprMadan Joshi
 
An Introduction To Six Sigma
An Introduction To Six SigmaAn Introduction To Six Sigma
An Introduction To Six SigmaBrian Bulow
 
LEAN SPEED vs SIX SIGMA QUALITY by JULIAN KALAC
LEAN SPEED vs SIX SIGMA QUALITY by JULIAN KALAC LEAN SPEED vs SIX SIGMA QUALITY by JULIAN KALAC
LEAN SPEED vs SIX SIGMA QUALITY by JULIAN KALAC Julian Kalac P.Eng
 
(Ntu talk) lean six sigma &amp; scholarship info.
(Ntu talk) lean six sigma &amp; scholarship info.(Ntu talk) lean six sigma &amp; scholarship info.
(Ntu talk) lean six sigma &amp; scholarship info.Hakeem-Ur- Rehman
 
Database performance Improvement, a Six Sigma project (Define) by Nirav Shah
Database performance Improvement, a Six Sigma project (Define) by Nirav Shah Database performance Improvement, a Six Sigma project (Define) by Nirav Shah
Database performance Improvement, a Six Sigma project (Define) by Nirav Shah Nirav Shah
 
Six Sigma: Levels of Certification
Six Sigma:  Levels of CertificationSix Sigma:  Levels of Certification
Six Sigma: Levels of CertificationMonarch Metal
 
Kabir Kassam: 6 – sigma training - Midterm Review
Kabir Kassam: 6 – sigma training - Midterm Review Kabir Kassam: 6 – sigma training - Midterm Review
Kabir Kassam: 6 – sigma training - Midterm Review Kabir Kassam
 
The Basics of Rain Screen Systems
The Basics of Rain Screen SystemsThe Basics of Rain Screen Systems
The Basics of Rain Screen SystemsMonarch Metal
 
Lean Six Sigma Optimization
Lean Six Sigma OptimizationLean Six Sigma Optimization
Lean Six Sigma Optimizationelai1001
 
Cycle Time Optimization
Cycle Time OptimizationCycle Time Optimization
Cycle Time Optimizationelai1001
 
Action plan document
Action plan documentAction plan document
Action plan document08ATumbare
 
Six Sigma Green Belt for Beginners in a Nutshell
Six Sigma Green Belt for Beginners in a NutshellSix Sigma Green Belt for Beginners in a Nutshell
Six Sigma Green Belt for Beginners in a NutshellMentor Global Delhi
 
SIX SIGMA Green Belt Training
SIX SIGMA Green Belt TrainingSIX SIGMA Green Belt Training
SIX SIGMA Green Belt Trainingchaudhryshailja
 

Viewers also liked (20)

Six Sigma Final
Six Sigma FinalSix Sigma Final
Six Sigma Final
 
2. intro. to six sigma
2. intro. to six sigma2. intro. to six sigma
2. intro. to six sigma
 
six sigma ppt
six sigma pptsix sigma ppt
six sigma ppt
 
Six Sigma the best ppt
Six Sigma the best pptSix Sigma the best ppt
Six Sigma the best ppt
 
Lean six sigma ppt rpr
Lean six sigma ppt rprLean six sigma ppt rpr
Lean six sigma ppt rpr
 
An Introduction To Six Sigma
An Introduction To Six SigmaAn Introduction To Six Sigma
An Introduction To Six Sigma
 
LEAN SPEED vs SIX SIGMA QUALITY by JULIAN KALAC
LEAN SPEED vs SIX SIGMA QUALITY by JULIAN KALAC LEAN SPEED vs SIX SIGMA QUALITY by JULIAN KALAC
LEAN SPEED vs SIX SIGMA QUALITY by JULIAN KALAC
 
(Ntu talk) lean six sigma &amp; scholarship info.
(Ntu talk) lean six sigma &amp; scholarship info.(Ntu talk) lean six sigma &amp; scholarship info.
(Ntu talk) lean six sigma &amp; scholarship info.
 
Database performance Improvement, a Six Sigma project (Define) by Nirav Shah
Database performance Improvement, a Six Sigma project (Define) by Nirav Shah Database performance Improvement, a Six Sigma project (Define) by Nirav Shah
Database performance Improvement, a Six Sigma project (Define) by Nirav Shah
 
Six Sigma: Levels of Certification
Six Sigma:  Levels of CertificationSix Sigma:  Levels of Certification
Six Sigma: Levels of Certification
 
Kabir Kassam: 6 – sigma training - Midterm Review
Kabir Kassam: 6 – sigma training - Midterm Review Kabir Kassam: 6 – sigma training - Midterm Review
Kabir Kassam: 6 – sigma training - Midterm Review
 
The Basics of Rain Screen Systems
The Basics of Rain Screen SystemsThe Basics of Rain Screen Systems
The Basics of Rain Screen Systems
 
Seis Sigma
Seis SigmaSeis Sigma
Seis Sigma
 
5. spc control charts
5. spc   control charts5. spc   control charts
5. spc control charts
 
six sigma
six sigmasix sigma
six sigma
 
Lean Six Sigma Optimization
Lean Six Sigma OptimizationLean Six Sigma Optimization
Lean Six Sigma Optimization
 
Cycle Time Optimization
Cycle Time OptimizationCycle Time Optimization
Cycle Time Optimization
 
Action plan document
Action plan documentAction plan document
Action plan document
 
Six Sigma Green Belt for Beginners in a Nutshell
Six Sigma Green Belt for Beginners in a NutshellSix Sigma Green Belt for Beginners in a Nutshell
Six Sigma Green Belt for Beginners in a Nutshell
 
SIX SIGMA Green Belt Training
SIX SIGMA Green Belt TrainingSIX SIGMA Green Belt Training
SIX SIGMA Green Belt Training
 

Similar to Six sigma & levels of sigma processes

Similar to Six sigma & levels of sigma processes (12)

Yellow belt training program
Yellow belt training programYellow belt training program
Yellow belt training program
 
Green belt training
Green belt trainingGreen belt training
Green belt training
 
Six Sigma Executive Overview
Six Sigma Executive OverviewSix Sigma Executive Overview
Six Sigma Executive Overview
 
Six sigma
Six sigmaSix sigma
Six sigma
 
Six sigma introduzione
Six sigma introduzioneSix sigma introduzione
Six sigma introduzione
 
Six Sigma Yellow Belt
Six Sigma Yellow BeltSix Sigma Yellow Belt
Six Sigma Yellow Belt
 
Lean six sigma_webinar_presentation_slides
Lean six sigma_webinar_presentation_slidesLean six sigma_webinar_presentation_slides
Lean six sigma_webinar_presentation_slides
 
6 sigma
6 sigma6 sigma
6 sigma
 
Process Capability shift over time
Process Capability shift over timeProcess Capability shift over time
Process Capability shift over time
 
Six sigma technique
Six sigma techniqueSix sigma technique
Six sigma technique
 
Six Sigma
Six SigmaSix Sigma
Six Sigma
 
Manish tripathi-sqa&amp;m-six-sigma-12 feb2017
Manish tripathi-sqa&amp;m-six-sigma-12 feb2017Manish tripathi-sqa&amp;m-six-sigma-12 feb2017
Manish tripathi-sqa&amp;m-six-sigma-12 feb2017
 

More from Mohit Singla

Total productivity maintenance technique
Total productivity maintenance techniqueTotal productivity maintenance technique
Total productivity maintenance techniqueMohit Singla
 
The toyota way 14 mgmt principles
The toyota way 14 mgmt principlesThe toyota way 14 mgmt principles
The toyota way 14 mgmt principlesMohit Singla
 
The salary theorem
The salary theoremThe salary theorem
The salary theoremMohit Singla
 
The partition of india
The partition of indiaThe partition of india
The partition of indiaMohit Singla
 
The one minute manager
The one minute managerThe one minute manager
The one minute managerMohit Singla
 
The goal is zero defects
The goal is zero defectsThe goal is zero defects
The goal is zero defectsMohit Singla
 
The glass evaluation
The glass evaluationThe glass evaluation
The glass evaluationMohit Singla
 
The future of marketing & advertising
The future of marketing & advertisingThe future of marketing & advertising
The future of marketing & advertisingMohit Singla
 
The digestive system
The digestive systemThe digestive system
The digestive systemMohit Singla
 

More from Mohit Singla (20)

Work vs. prison
Work vs. prisonWork vs. prison
Work vs. prison
 
Word of mouth
Word of mouthWord of mouth
Word of mouth
 
Why the moon
Why the moonWhy the moon
Why the moon
 
What if
What ifWhat if
What if
 
Vision mission
Vision missionVision mission
Vision mission
 
Value of food
Value of foodValue of food
Value of food
 
Universe
UniverseUniverse
Universe
 
Trust
TrustTrust
Trust
 
Total productivity maintenance technique
Total productivity maintenance techniqueTotal productivity maintenance technique
Total productivity maintenance technique
 
Time management
Time managementTime management
Time management
 
Three shakti’s
Three shakti’sThree shakti’s
Three shakti’s
 
The toyota way 14 mgmt principles
The toyota way 14 mgmt principlesThe toyota way 14 mgmt principles
The toyota way 14 mgmt principles
 
The salary theorem
The salary theoremThe salary theorem
The salary theorem
 
The partition of india
The partition of indiaThe partition of india
The partition of india
 
The one minute manager
The one minute managerThe one minute manager
The one minute manager
 
The lost mumbai
The lost mumbaiThe lost mumbai
The lost mumbai
 
The goal is zero defects
The goal is zero defectsThe goal is zero defects
The goal is zero defects
 
The glass evaluation
The glass evaluationThe glass evaluation
The glass evaluation
 
The future of marketing & advertising
The future of marketing & advertisingThe future of marketing & advertising
The future of marketing & advertising
 
The digestive system
The digestive systemThe digestive system
The digestive system
 

Six sigma & levels of sigma processes

  • 1. FICCI CE Six Sigma
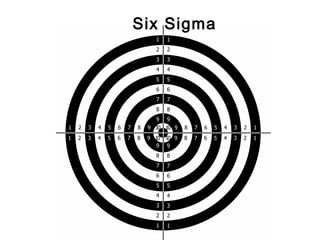
  • 2. Six Sigma in simple terms Accurate and Precision Six Sigma can be best explained by using the analogy of a rifle firing at a target.
  • 3. Accuracy and precision With the center of the target taken to be the true value of the characteristic being measured and by the rifle shots representing the measured values, there are four combinations of accuracy and precision as depicted in the following slides.
  • 8. Objectives of Six Sigma As observed from the Picturization in the preceding slides, the objective of moving towards world class manufacturing a is to continuously achieve greater consistency of the processes by aiming for higher levels of accuracy & precision
  • 9. FICCI CE Sigma in statistical terms Standard deviation is also referred to as the Greek letter sigma in quality management literature. Consequently process variation can be described by how many sigmas ( i.e how many multiples of standard deviation or SD ) fit within the specification limits.The higher this number, the better is the quality and vice versa. Sigma is a statistical measure of the quality consistency for a particular process / product.
  • 10. FICCI CE Sigma process From a sigma process we come to know that at what distance, in terms of the standard deviation, the specification limits are placed from the target value.
  • 11. FICCI CE Move beyond 3 sigma Until a few years back all statistical process controls were designed on the basis of 3 sigma limits. It is only in the recent years that this concept has been challenged and the organizations have started looking for quality levels beyond 3 Sigma.
  • 12. FICCI CE 3 Sigma process Mean=8 LSL SD = 2 USL 1 2 3 4 5 6 7 8 9 10 11 12 13 14 15 16 - 3 SD + 3 SD Note : LSL is Lower specification limit and USL is Upper specification limit.
  • 13. FICCI CE 4 Sigma process LSL Mean=8 USL SD = 1.33 1 2 3 4 5 6 7 8 9 10 11 12 13 14 15 16 - 4 SD + 4 SD
  • 14. FICCI CE 5 Sigma process Mean=8 LSL SD = 1.07 USL 1 2 3 4 5 6 7 8 9 10 11 12 13 14 15 16 - 5 SD + 5 SD
  • 15. FICCI CE 6 Sigma process Mean=8 LSL SD = 1 USL 1 2 3 4 5 6 7 8 9 10 11 12 13 14 15 16 - 6 SD + 6 SD
  • 16. FICCI CE Precision Lesser the standard deviation of the process, more precise or consistent is the process
  • 17. FICCI CE 3 Sigma Vs 6 Sigma The goal of Six Sigma program is to reduce the variation in every process to such an extent that the spread of 12 sigmas i.e. 6 Sigmas on either side of the mean fits within the process specifications. The figure on next slide shows what this looks like.
  • 18. FICCI CE 3 Sigma Vs 6 Sigma 6 Sigma curve LSL USL 3 Sigma curve 1 2 3 4 5 6 7 8 9 10 11 12 13 14 15 16 In a 3 sigma process the values are widely spread along the center line, showing the higher variation of the process. Whereas in a 6 Sigma process, the values are closer to the center line showing less variation in the process.
  • 19. FICCI CE 3 Sigma Vs 6 Sigma The comparison on the previous slide also shows a process in which the process spread of Six Sigmas (ie. 3 Sigmas on either side just fits within the specifications). In this case one must be extremely careful to ensure that the process average never slips off the target, otherwise the curve will shift and non-conforming items will increase. With Six Sigma requirement the process mean can shift by as much as 1.5 sigma before the likelihood of non-conforming items is increased. Even if the process mean does shift off center by as much as 1.5 sigma, only 3.4 non-conforming items per million parts should result.
  • 20. FICCI CE Amount of process shift allowed 1.5 SD 1.5 SD LSL USL SD = 1 1 2 3 4 5 6 7 8 9 10 11 12 13 14 15 16
  • 21. FICCI CE Sigma levels and defect rate Quality level % Quality Defective PPM* 3 Sigma 99.73 66807 4 Sigma 99.9937 6210 5 Sigma 99.999943 233 6 Sigma 99.9999998 3.4 *Parts Per Million
  • 22. FICCI CE Sigma levels & Cost of quality Sigma Defect rate(PPM) Cost of quality Competitive level 6 3.4 <10% World 5 233 10-15% Class 4 6210 15-20% Industry 3 66807 20-30% Average 2 308537 30-40% Non >40% Competitive 1 6,90000
  • 23. FICCI CE