A very basic business plan that includes my version of a profit and loss statement. The California High Speed Rail Authority Dec. 9 Business Plan failed to include a P&L statement.
*Navigating Electoral Terrain: TDP's Performance under N Chandrababu Naidu's ...
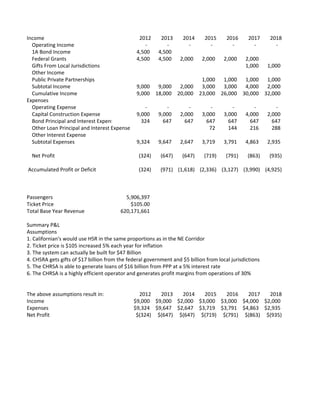
CHRSA P&L
1. Income 2012 2013 2014 2015 2016 2017 2018
Operating Income - - - - - - -
1A Bond Income 4,500 4,500
Federal Grants 4,500 4,500 2,000 2,000 2,000 2,000
Gifts From Local Jurisdictions 1,000 1,000
Other Income
Public Private Partnerships 1,000 1,000 1,000 1,000
Subtotal Income 9,000 9,000 2,000 3,000 3,000 4,000 2,000
Cumulative Income 9,000 18,000 20,000 23,000 26,000 30,000 32,000
Expenses
Operating Expense - - - - - - -
Capital Construction Expense 9,000 9,000 2,000 3,000 3,000 4,000 2,000
Bond Principal and Interest Expense 324 647 647 647 647 647 647
Other Loan Principal and Interest Expense 72 144 216 288
Other Interest Expense
Subtotal Expenses 9,324 9,647 2,647 3,719 3,791 4,863 2,935
Net Profit (324) (647) (647) (719) (791) (863) (935)
Accumulated Profit or Deficit (324) (971) (1,618) (2,336) (3,127) (3,990) (4,925)
Passengers 5,906,397
Ticket Price $105.00
Total Base Year Revenue 620,171,661
Summary P&L
Assumptions
1. Californian's would use HSR in the same proportions as in the NE Corridor
2. Ticket price is $105 increased 5% each year for inflation
3. The system can actually be built for $47 Billion
4. CHSRA gets gifts of $17 billion from the federal government and $5 billion from local jurisdictions
5. The CHRSA is able to generate loans of $16 billion from PPP at a 5% interest rate
6. The CHRSA is a highly efficient operator and generates profit margins from operations of 30%
The above assumptions result in: 2012 2013 2014 2015 2016 2017 2018
Income $9,000 $9,000 $2,000 $3,000 $3,000 $4,000 $2,000
Expenses $9,324 $9,647 $2,647 $3,719 $3,791 $4,863 $2,935
Net Profit $(324) $(647) $(647) $(719) $(791) $(863) $(935)
7. Interest & Princ. Reduction Payment expense based on 1A legislative analyst
2008 Core Market Travel Data
Total Visitors to LA (Source: LA Visitors and Convention Bureau)
% above from SF/Oakland (Source: LA Visitors and Convention Bureau)
Visitors to LA from SF/Oakland (Source: LA Visitors and Convention Bureau)
Total Visitors to SF, other than Bay Area (Source: SF Visitors and Convention Bureau)
% above from LA Basin (Source: SF Visitors and Convention Bureau)
Visitors to SF from LA
Total SF Visitors to LA & LA Visitors to SF
Round trip multiplier
Trips between Bay Area and LA Basin (Source: SF & LA Convention Bureaus)