
Recommended
Recommended
More Related Content
What's hot
What's hot (20)
Viewers also liked
Viewers also liked (12)
Similar to 452f03 3 bconsumer analysis
Similar to 452f03 3 bconsumer analysis (20)
Recently uploaded
Recently uploaded (20)
452f03 3 bconsumer analysis
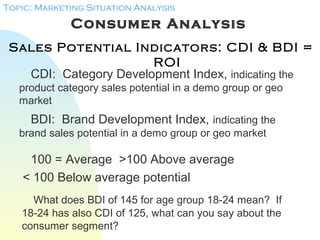
- 1. Consumer Analysis Sales Potential Indicators: CDI & BDI = ROI CDI: Category Development Index, indicating the product category sales potential in a demo group or geo market Topic: Marketing Situation Analysis BDI: Brand Development Index, indicating the brand sales potential in a demo group or geo market 100 = Average >100 Above average < 100 Below average potential What does BDI of 145 for age group 18-24 mean? If 18-24 has also CDI of 125, what can you say about the consumer segment?
- 2. Consumer Analysis Sales Potential Indicators: CDI & BDI = ROI CD I % of Category Sales= / % of Persons Topic: Marketing Situation Analysis BDI = % of Brand Sales / % of Persons If you have sales data available by consumer segment: The following definitions apply
- 3. Sales Potential Indicators –CDI, BDI When sales data are NOT available Use the product or brand usage index in ‘D’ column of MRI or SMRB data, defined as: CD I % of Category Users= / % of Persons Topic: Marketing Situation Analysis Consumer Analysis BDI = % of Brand Users / % of Persons
- 4. Sales Potential Indicators –CDI & BDI MRI Index (in Product Category User report): for a demo group % of All Brand Users In US = = # of Persons in 18-24 / % of All Persons in US B column (i.e., Down or Vertical %) / # of Persons in All ages Topic: Marketing Situation Analysis Consumer Analysis X 100
- 5. Sales Potential Indicators –CDI & BDI MRI Index (in Brand User report): for a demo group % of All Brand Users In US = = # of Persons in 18-24 / % of All Persons in US B column (i.e., Down or Vertical %) / # of Persons in All ages Topic: Marketing Situation Analysis Consumer Analysis X 100
- 6. How Is MRI/Simmons Index used? - Index is an important consideration, but… Does the segment with the highest index have the greatest sales volume potential? Age 18-24 25-34 35-44 % Pop 13 20 36 % Users 17 18 33 Calculation (17/13)X100 (18/20)X100 (33/36)X100 Index 131 90 92 Topic: Marketing Situation Analysis Consumer Analysis Why or why not? Example:
- 7. • If consumer segments should be analyzed for sales volume potential: Volume Potential 18-24 = Volume Potential 35-44 = .17 X 131 = 22.3 .33 X 92 = 30.4 Topic: Marketing Situation Analysis Consumer Analysis ---Use Both User Population Size and Index Weigh User Size by Index Note: the volume potential above is not actual sales volume but estimated composite weight that takes on meaning only when compared to other composite weights
- 8. Consumer Analysis Discussion #2: Use MRI data (new import car buyers/leasers) to identify: a) the potential targets for Corolla (described demographically and geographically), and b) what media they tend to use heavily and could thus be included into your media mix: Topic: Marketing Situation Analysis Note: You need to turn in the outcome by the week following this discussion
- 9. Consumer Analysis a) Identifying potential targets Topic: Marketing Situation Analysis Identify up to four demographic characteristics that clearly distinguish between good and poor prospects How? Look at the index column and see which variable shows the largest amount of difference between the highest index group and the lowest group; pick the top variables (only if the difference is significant, 15 points or more)
- 10. Consumer Analysis Topic: Marketing Situation Analysis For each of the top variables, do the following 1) identify and rank those (e.g., age, gender, etc.) groups with above average potential 2) consider also the size of the user population (Projected ‘000 and Percent Down) to see if the segment is likely generate too big a sales volume to ignore Using what you learned from the above, draw and justify your conclusion as to who are ideal targets.
- 11. Consumer Analysis b) what media they tend to use heavily and could thus be included into your media mix Topic: Marketing Situation Analysis Identify media that are more likely to be used heavily by the defined targets (so, once you identify the target, run the MRI using that target to find the media heavily used by them) How to find the media ? The tercile and quintile report on the media use by the product or brand users/consumers
- 12. Consumer Analysis Topic: Marketing Situation Analysis Quintile analysis: consumers are divided into five groups of (almost) equal size based on the amount of usage of the medium: Quintile 1 = heaviest usage 20%, Quintile 5 = Least usage 20% Tercile Analysis: consumers are divided into three groups of (almost) equal size: Tercile 1 = heaviest usage 33% Look at the index column for different media categories shown (e.g., daily papers, outdoor, TV, etc.) and see in what media your consumers are likely to load heavily on the quintile 1 & 2 or tercile 1 (heavy usage of the medium)
- 13. Consumer Analysis Topic: Marketing Situation Analysis See the handout for new import car buyers/leasers What media deliver well to the new import car buyers/leasers and should thus be included in your media mix? i.e., what media do your target heavily use? What media do not deliver efficiently? You may also use information from Ad Week’s “Marketer’s Guide to Media” to evaluate the delivery of each medium to your target (if described in age or some general demographic characteristics)