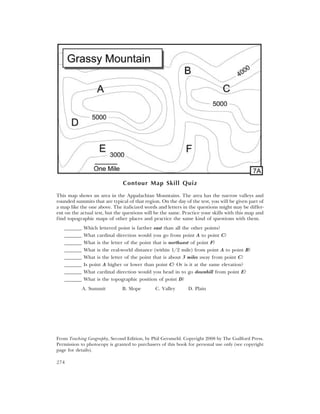
1. Contour Map Skill Quiz
This map shows an area in the Appalachian Mountains. The area has the narrow valleys and
rounded summits that are typical of that region. On the day of the test, you will be given part of
a map like the one above. The italicized words and letters in the questions might may be differ-
ent on the actual test, but the questions will be the same. Practice your skills with this map and
find topographic maps of other places and practice the same kind of questions with them.
_______ Which lettered point is farther east than all the other points?
_______ What cardinal direction would you go from point A to point C?
_______ What is the letter of the point that is northwest of point F?
_______ What is the real-world distance (within 1/2 mile) from point A to point B?
_______ What is the letter of the point that is about 3 miles away from point C?
_______ Is point A higher or lower than point C? Or is it at the same elevation?
_______ What cardinal direction would you head in to go downhill from point E?
_______ What is the topographic position of point D?
A. Summit B. Slope C. Valley D. Plain
From Teaching Geography, Second Edition, by Phil Gersmehl. Copyright 2008 by The Guilford Press.
Permission to photocopy is granted to purchasers of this book for personal use only (see copyright
page for details).
274
2. Teacher ’s Guide for Transparency 7A
This is a quiz that can be handed out ahead of time and modified on test day in two ways: by
replacing the underlined letters, words, or phrases, or by using a different map of the same
general kind. These sample questions also show how the same ideas can be adjusted for differ-
ent grade levels.
Elementary: You will be given part of a map; look at it and write your answer on each line:
_________ What is the name of the town in map sector D4 on the map?
_________ In what letter-number map sector is point D located?
_________ What cardinal direction would you go from point A to point C?
_________ What is the letter of the point that is north of point F?
_________ How far is it in the real world (within one mile) from point A to point B?
_________ Is point A higher or lower than point C? Or is it the same elevation?
_________ What cardinal direction would you head to go downhill from point C?
_________ Is point D on a hilltop, on a slope, or in a valley?
Intermediate: You will be given part of a map with some lettered points on it:
_____ Print the letter-number designation for the sector that contains point B.
_____ Print the letter that is closest to latitude 34q11cN and longitude 104q23cW.
_____ Print the true azimuth (within 10 degrees) from point B to point C.
_____ Print the letter where you would be if you saw point F to the southeast.
_____ Print the shortest road distance (nearest mile) from point A to point C.
_____ Print the RF scale of a map with a verbal scale of one inch equals 500 feet.
_____ Print the approximate elevation of point G.
_____ Print the letter that best describes the topographic position of point D.
A. Summit B. Ridge C. Spur D. Slope E. Draw
F. Bench G. Valley H. Hole I. Plain J. Pass
Advanced: You will be given a portion of a map with some lettered points on it.
_____ Print the magnetic compass reading (within 5 degrees) from point B to A.
_____ Print the letter of the map point from which you would see point A at a magnetic
compass reading of 263 degrees.
_____ Print the amount of time (within 10 minutes) it would take to go from point A to
point B at a speed of 40 miles per hour.
_____ Print the real-world area (nearest square km) represented by 3 sq cm on this map.
_____ Print the elevation difference between point C and I.
_____ Print the average gradient (nearest 5 percent) of a direct path from point A to point
B on the map.
_____ Print the elevation of the highest point along a straight line from point F to point J
on the map.
_____ Sketch a side profile and print YES if you would (NO if you would not) be able to
see point C while standing on the ground at point A.
275
3. Economic Geography Matching Quiz
Match the appropriate lettered map with the following crops and brief ly state your reasons:
Corn and soybeans require fertile soil, about 25 inches of rain, and a frost-free season that is at
least 4 months long. They also require an economy that can use them for animal feed or export
them to other countries. Which map shows where these crops are grown, and why do you think
so?
____ (letter)
Sheep and goats need grass or shrubs that grow throughout the year, or land that can be used
to grow hay for winter feed. Because these animals are not very profitable, they are seldom
raised on land that could get better use, unless there is a long tradition of raising these animals.
Which map shows where these animals are raised, and why do you think so?
____ (letter)
Rubber comes from a tree that grows in the equatorial rainforest. Which map shows where this
crop is harvested, and why do you think so?
____ (letter)
From Teaching Geography, Second Edition, by Phil Gersmehl. Copyright 2008 by The Guilford Press.
Permission to photocopy is granted to purchasers of this book for personal use only (see copyright
page for details).
276
4. Teacher ’s Guide for Transparency 7B
A matching question can be phrased in many different ways, depending on what kind of knowl-
edge a teacher wants to evaluate. The primary focus in this example is on the link between agri-
culture and climate. That is why the question provides a short explanation about each crop (so
that the question does not just test familiarity with the crops).
If, on the other hand, a teacher wants to emphasize recall of plant and animal traits as well
as of the climate pattern, the test might simply ask:
Which map shows where corn and soybeans grow? Why do you think so?
Or just: write the letter of the map that shows where rubber is produced.
Or, to emphasize a full set of spatial relationships, ask students to annotate the map by drawing
a line for the equator, dots to indicate desert areas, and upside-down V’s to show the Andes
Mountains. Then have them cite those geographical features to justify their choices as they
match the maps with the names of the farm products. South American agriculture clearly
shows the influence of environment, but that is not the only variable. The mass of sheep and
goats in Uruguay reflects a long cultural tradition that persists even while people in neighbor-
ing countries with similar land choose to grow other crops.
Other geographic patterns that can be tested with matching questions include:
Climate – World Weather Guide, USA Today Weather Almanac, www.noaa.gov
Mineral deposits, rocks – Goode’s World Atlas, a good geology text, or www.usgs.gov
Plants and animals – maps in Reader’s Digest North American Wildlife
Soil types – maps in various physical geography textbooks, or nrcs.gov
Environmental hazards – State of the Earth Atlas, Atlas of Environment, www.epa.gov
Houses – This Remarkable Continent, Atlas of Cultural Features
Settlement – Atlas of American History (at least five companies publish one)
Ethnic groups – We the People, Facts on File Atlas of Contemporary America, or census
reports for specific states, metropolitan areas, or countries, www.census.gov or www.cia.gov
Languages – same as above, and Atlas of the World Today; spoken samples in some CD-
ROMs like EnCarta or 101 Languages (it wouldn’t hurt anyone to learn how to say or rec-
ognize “Hello,” “Excuse me,” and “Thank You” in several languages)
Industry – Oxford Economic Atlas, Goode’s World Atlas, www.cia.gov
Sports – Rooney, Atlas of American Sport; Shortridge, Atlas of American Women; Rand
McNally Baseball Atlas (also has maps of stadiums, use the same way as Transparency 4C)
Major department stores – Laulajainen, Spatial Strategies in Retailing
Politics – Latitudes and Attitudes, Martis Historical Atlas of Political Parties, or U.S. Geologi-
cal Service, Electing the President: 1789-1992; call 1-800-USAMAPS.
Musical styles – some new CD-ROMs, or make a tape
Vacation spots – travel guides by AAA, Mobil, Fodors, Smithsonian
Even more topics might include migration streams, population pyramids, places named in cur-
rent news stories, environmental issues, maps from state atlases and history books, excerpts
from novels, diaries, poems, and so on. Though full, this list is not exhaustive; ARGUS and
other major curriculum projects usually have quite a few matching style activities. BUT, please,
choose well; do we really want to focus on flags, tourist attractions, minor politicians, funny
names, or other trivia?
277
5. The map above shows seven general pathways used by explorers and settlers from five Euro-
pean nations. Describe the process and consequences of the settlement depicted by arrow num-
ber 5.
Stated this way, the instruction for what the students must do is too vague. It could, how-
ever, be followed by a clarifying question, which would narrow the range of possible answers
and provide some guidance for students. Note the wide range of possible directions that the
follow-up question could take:
What country does this arrow represent? Why did those pioneers choose the kind of land
they tended to move to?
What kind of people came along this route? Was it a large or small number? Why would
they have chosen to leave their home country at that time in history?
What were their major goals in North America? How did that influence their choice of
land?
What were the major environmental conditions in the region they entered?
What Native American people were already lived in the areas they entered? What did those
Native American people do for a living?
How did these immigrant people divide land? Has that land division had consequences for
later users of the land, and what were the consequences?
What kind of houses and other structures did these immigrants build? How well did their
structures fit with the local environment?
What did these immigrants do for a living? What resources in the area made that possible?
What kind of political organization did they adopt? How well did that organization fit with
the local environment?
How would you describe the success of this migration? What aspects of the local environ-
ment helped or hindered the people moving in?
What aspects of the modern landscape in that region are results of the time when these par-
ticular people entered North Americaa?
From Teaching Geography, Second Edition, by Phil Gersmehl. Copyright 2008 by The Guilford Press.
Permission to photocopy is granted to purchasers of this book for personal use only (see copyright
page for details).
278
6. Teacher ’s Guide for Transparency 7C
Here are some essay assessment questions, aimed at different levels and outcomes:
Provide a map with several numbered locations; ask which location would be the best
choice for siting a new facility – a store, highway, gas station, sewage treatment plant –
and why. Sample answer: “I would put the restaurant at location 9 because there’s a big
highway and more people driving there.”
Provide a map and ask at which numbered location a particular hazard occurs – hurricane,
earthquake, frost, drought – and why there. Or reverse the question and ask what haz-
ards are likely to be in a specified location. What might people do to reduce the risk?
Sample answer: “______ is prone to earthquakes, so people should look for wooden
frame houses on a solid foundation rather than brick houses with big windows. Or at
least ask if a house is reinforced, because brick houses have problems in earthquakes.”
Provide a map of an urban area and ask where a given feature – truck stop, high-rise office,
baseball stadium, oil refinery – might be located and why that location is suitable. “The
oil refinery should probably be at place C. It’s near a river, and a railroad, and it is east
of the city, where prevailing winds would blow smoke and fumes away from the city.”
Provide a map of a continent with a location marked by an X. Ask what kind of people live
there, what they do for a living, and what conditions of the local area (or what connec-
tions with other areas) help give that place the traits it has. Sample answer: “People
there might raise cattle for a living, because it is too dry for most crops and I don’t think
there is any mineral deposit there. Probably there are not very many people, because
dry areas without big rivers usually do not have big cities.”
Provide a map of a continent with a location marked by an X. Ask how the conditions at the
place influenced the events of the time. Sample answer: “That area was part of the
Parthian Empire, but the Romans wanted to push them east so they could get the food
that was produced in irrigated fields along the rivers.”
Provide a map with a marked location. Ask students what they would take with them if they
were traveling (or moving) to that location. Ask them to justify their list by citing fea-
tures in the local environment that would fit the items they were taking. Sample
answers: “I’d take a raincoat, because that place has a lot of rain.” “I probably want to
learn some French before I move there, because that is what government officials speak,
but after I got there I’d start to ask my neighbors to teach me some words in the local
language – people in and around that area speak many different languages.”
Provide a map with a marked location. Ask what kind of problem is happening in that area
and what people can do to reduce the problem. Sample answer: “That area is near the
border between savanna and grassland; people might farm in the savanna or near the
rivers, but they raise livestock on the grassland. With global warming, the area is getting
drier, which means farmers can’t make a living, and livestock economies might move in.
If they speak different languages, there might be tensions.”
Note that these questions have four feature in common.
1. Each question deals with a real place.
2. Students must understand at least one broad-scale geographic pattern.
3. Students must think about how environmental, economic, and social conditions interact
in that place.
4. The question tests knowledge and skills that would be of use to a vacationer, student,
worker, employer, or citizen making everyday decisions.
279
7. From Teaching Geography, Second Edition, by Phil Gersmehl. Copyright 2008 by The Guilford Press.
Permission to photocopy is granted to purchasers of this book for personal use only (see copyright
page for details).
280
8. Teacher ’s Guide for Transparencies 7D and 7E
An individual or group project is a good way to start independent geographic exploration. By
its very nature, a project is a “synthesis” activity – it requires students to bring a variety of
knowledge and skills to bear on a specific issue. The key is to make the expectations very clear
at the outset of the activity. Expectations should span the range of learner outcomes, from
application of factual knowledge to skills in organizing and presenting results. It helps to make
an explicit list of evaluation criteria, such as those listed on the Transparencies or in this
expanded list:
Stating a problem and writing some plausible hypotheses
A. How well did you state your problem (the landscape feature or map pattern you are trying
to explain, or the issue you want to explore)?
B. How well did you state your hypothesis (your idea of what might be a valid explanation of
the feature you are studying)?
C. How well did you choose an appropriate study area? Is it typical? Are data available?
D. How well did you find useful factual information about the subject? Did you focus on
major features; were you able to avoid the “tourist trap” of noting only the exotic or
unusual?
Mapping your data
E. How well did you choose your map scale and projection, so that the base map would not
introduce unnecessary distortion in your message?
F. How well did you choose background information, so that it would help to put the the-
matic message into perspective, but wouldn’t make the main theme hard to see or inter-
pret?
G. How appropriately did you manipulate your data (e.g., by dividing total amounts of pro-
duction by population in order to get amount per capita)?
H. How well did you choose symbols for your thematic message? Do the symbols fit the
innate nature of what you are mapping?
Analyzing your map
I. How well did you analyze the geographic patterns on your maps? Did you compare your
map pattern with other appropriate maps if available?
J. How well does your analysis fit with generally accepted theories of geography? Did you
cite others’ observations or analyses if appropriate?
K. How reasonable are the conclusions you drew from your analysis?
Presenting your results
L. How well did you express your conclusions? Did you express them in ways that allow for
reasonable disagreement on points where the data are inconclusive?
M. How well did you identify questions that warrant further investigation?
N. How well did you organize your presentation? Is your report logical and interesting?
O. Did you write clearly, concisely, with good grammar, and no unnecessary jargon?
P. Did you cite your sources completely and correctly?
The list of outcomes can vary; the Transparencies assume a rather straightforward community
profile. A different list of outcomes would be appropriate for a geographic investigation of a
community issue (e.g., proposed locations for a park, a solid-waste disposal area, or a transit
system). Here, the focus would be on finding and evaluating relevant information about land
use, population density, the economy, and other traits of communities that might be affected
by the plan.
281
9. From Teaching Geography, Second Edition, by Phil Gersmehl. Copyright 2008 by The Guilford Press.
Permission to photocopy is granted to purchasers of this book for personal use only (see copyright
page for details).
282
10. Teacher ’s Guide for Transparencies 7F and 7G
Before a field trip, discuss with the class the goals of the trip. What will we observe? What crite-
ria will we use to make our observations? What product will we turn in after the trip? Here is an
example: a field trip to a new museum; on the way, we will make a graph showing changes in
building condition along a city street. (One could also focus on height of trees, languages on
signs, construction material – in short, practically any of the kinds of impressions that people
might notice and use to compare places).
Goal: Observe the condition of buildings. These observations will be made in such a way
that we can put the data on a graph or a sketch map of the route.
Procedure: On your way to the museum, stop the bus and announce the starting point of
the graph. Ask students to carefully describe what they see at the first stop. Announce
that they will use that description as a yardstick for evaluating the next stops.
Criteria. Discuss the guidelines: what students should observe and why. The real purpose of
this part of the discussion is to get students to realize that the criteria used in making a
map or graph are human inventions. As such, they can range from useful to worthless,
from fair to biased, and so on.
Product: A graph that shows the students’ evaluation of the condition of buildings along
the street, using data gathered in a systematic fashion and subject to evaluation by a
teacher or peer group
Activity: At the first stop, the goal is to write and/or sketch what you see, with enough accuracy
that your description can be used as a yardstick for comparing the next sites. Note the height,
density, and condition of buildings in the middle of the block. Clearly record any signs or other
specific clues that you think are especially helpful. This set of buildings will be a reference for
other observations. From here on, you are to record how the buildings at each stop compare
with what you saw at the first stop.
When you get back to the classroom, you will make a set of three graphs to show the size,
spacing, and condition of the buildings along the route.
This kind of disciplined field observation can be even more effective if students try to
devise their own classification ahead of time rather than just following a predetermined set of
categories. A teacher could have a list like the above in mind while conducting an open-ended
discussion before the field trip. One could even have the students design an observation form
like the example in Transparency 7F. All of these steps help tie the field experience into the
classroom.
A disciplined form of observation does not automatically preclude serendipitous events
while in the field. Offer a prize for the funniest sign seen, the most attractive sketches that stu-
dents make in trying to record what they see, or the most interesting haiku a student writes
about the trip. The students can even design quizzes for each other; immediately after the trip,
ask them to write questions to elicit memories of what they saw.
By all means evaluate the product of a field trip; this is the most important step in setting
the tone for future field trips.
283