SlideShare a Scribd company logo
1 of 1
Download to read offline
Gráfica de medias y desviación estándar x-s                                                                                                                                                                                                               G. Edgar Mata Ortiz


                                                                Límites de control para la media aritmética                                                                             Límites de control para la desviación estándar

         LCL =                          108.805                   CL =         134.100                 UCL =     159.395                               LCL =      0                               CL =     17.726                       UCL =   37.030
                                                 170                                                               NR3. Six (or more)                 NR5. Two or three out of three
                                                                                                                   points in a row are                points in a row are more than 2
                                                 160                                                                                                  SD form the mean in the same
                                                                                                                   continually increasing
                                                                                                                   or decreasing                      direction (WE 2)
            Gráfico de medias


                                                 150

                                                 140

                                                 130

                                                 120

                                                 110

                                                 100
                                                             NR4. Fourteen (or                                NR1. One point is                                                                            NR1. One point is
                                                             more) points in a row                            more than 3 standard
                                                  50                                                                                                                                                       more than 3
                                                             alternate in direction,                          devitions from the                                                                           standard devitions
                                                             increasing then
                                                                                                                                                                                                           from the mean
            Gráfico de desv. estándar


                                                  40


                                                  30


                                                  20


                                                  10


                                                  0


                                         Datos          1        2           3           4       5       6           7           8            9      10         11         12           13      14        15        16           17       18     19       20
                                          x1           103     147          143        122      88      152         153        152           89      95        138        106           122    105       166       151          159      125     125     145
                                          x2           107     145          167        165     149      143         165        128          117      98        155        112           109    125       179       204          132      133     115     144
                                          x3           140     148          121        145     128      154         75         136          123     131        169        121           157    110       153       139          152      131     93      150
                                          x4           118     109          156        127     128      170         155        108          132      90        152        155           89     110       139       138          175      164     108     145
                                          x5           158     131          104        152     148      147         132        135          153      92        102        118           94      90       154       149          168      161     147     153
                                          S            626     680          691        711     641      766         680        659          614     506        716        612           571    540       791       781          786      714     588     737
                                          x        125.2       136        138.2        142.2   128.2   153.2        136       131.8         122.8   101.2     143.2      122.4      114.2      108       158.2    156.2         157.2   142.8   117.6    147.4
                                          s       20.837 14.832 22.956 15.892 22.094                   9.239      32.336      14.26     20.846 15.145 22.833 17.095 24.343 11.225 13.467 24.457 14.824 16.327 18.018 3.4986


licmata@hotmail.com                                                                                                       http://licmata-math.blogspot.mx/                                                                              http://www.slideshare.net/licmata/

More Related Content

Viewers also liked

Process Capability Analysis: CP y CPK
Process Capability Analysis: CP y CPKProcess Capability Analysis: CP y CPK
Process Capability Analysis: CP y CPKEdgar Mata
 
Distribución norma, como hacer curva de Gauss en excel
Distribución norma, como hacer curva de Gauss en excelDistribución norma, como hacer curva de Gauss en excel
Distribución norma, como hacer curva de Gauss en excelEmilioVargasM
 
Ecuaciones simultáneas de primer grado con dos incógnitas
Ecuaciones simultáneas de primer grado con dos incógnitasEcuaciones simultáneas de primer grado con dos incógnitas
Ecuaciones simultáneas de primer grado con dos incógnitasEdgar Sierra Sierra
 
Estadística Descriptiva
Estadística DescriptivaEstadística Descriptiva
Estadística Descriptivajpgv84
 
Cramer 4x4 resuelto por cofactores
Cramer 4x4 resuelto por cofactoresCramer 4x4 resuelto por cofactores
Cramer 4x4 resuelto por cofactoresEdgar Mata
 
Gráficos estadísticos diapositiva
Gráficos estadísticos diapositivaGráficos estadísticos diapositiva
Gráficos estadísticos diapositivakarenalfonseca02
 
Graficos estadisticos en excel
Graficos estadisticos en excelGraficos estadisticos en excel
Graficos estadisticos en excelEvelyn Merizalde
 

Viewers also liked (9)

Process Capability Analysis: CP y CPK
Process Capability Analysis: CP y CPKProcess Capability Analysis: CP y CPK
Process Capability Analysis: CP y CPK
 
Distribución norma, como hacer curva de Gauss en excel
Distribución norma, como hacer curva de Gauss en excelDistribución norma, como hacer curva de Gauss en excel
Distribución norma, como hacer curva de Gauss en excel
 
Ecuaciones simultáneas de primer grado con dos incógnitas
Ecuaciones simultáneas de primer grado con dos incógnitasEcuaciones simultáneas de primer grado con dos incógnitas
Ecuaciones simultáneas de primer grado con dos incógnitas
 
Ejercicio de aplicación regla de cramer
Ejercicio de aplicación   regla de cramerEjercicio de aplicación   regla de cramer
Ejercicio de aplicación regla de cramer
 
Estadística Descriptiva
Estadística DescriptivaEstadística Descriptiva
Estadística Descriptiva
 
Cramer 4x4 resuelto por cofactores
Cramer 4x4 resuelto por cofactoresCramer 4x4 resuelto por cofactores
Cramer 4x4 resuelto por cofactores
 
Gráficos estadísticos diapositiva
Gráficos estadísticos diapositivaGráficos estadísticos diapositiva
Gráficos estadísticos diapositiva
 
Análisis Estadístico
Análisis EstadísticoAnálisis Estadístico
Análisis Estadístico
 
Graficos estadisticos en excel
Graficos estadisticos en excelGraficos estadisticos en excel
Graficos estadisticos en excel
 

More from Edgar Mata

Activity 12 c numb
Activity 12 c numbActivity 12 c numb
Activity 12 c numbEdgar Mata
 
Pw roo complex numbers 2021
Pw roo complex numbers 2021Pw roo complex numbers 2021
Pw roo complex numbers 2021Edgar Mata
 
Ar complex num 2021
Ar complex num 2021Ar complex num 2021
Ar complex num 2021Edgar Mata
 
Formato 1 1-limits - solved example 01
Formato 1 1-limits - solved example 01Formato 1 1-limits - solved example 01
Formato 1 1-limits - solved example 01Edgar Mata
 
Activity 1 1 part 2 exer ea2021
Activity 1 1 part 2 exer ea2021Activity 1 1 part 2 exer ea2021
Activity 1 1 part 2 exer ea2021Edgar Mata
 
Problem identification 2021
Problem identification 2021Problem identification 2021
Problem identification 2021Edgar Mata
 
Formato 1 1-limits ea2021
Formato 1 1-limits ea2021Formato 1 1-limits ea2021
Formato 1 1-limits ea2021Edgar Mata
 
Activity 1 1 real numbers
Activity 1 1 real numbersActivity 1 1 real numbers
Activity 1 1 real numbersEdgar Mata
 
Activity 1 1 limits and continuity ea2021
Activity 1 1 limits and continuity ea2021Activity 1 1 limits and continuity ea2021
Activity 1 1 limits and continuity ea2021Edgar Mata
 
Course presentation differential calculus ea2021
Course presentation differential calculus ea2021Course presentation differential calculus ea2021
Course presentation differential calculus ea2021Edgar Mata
 
Course presentation linear algebra ea2021
Course presentation linear algebra ea2021Course presentation linear algebra ea2021
Course presentation linear algebra ea2021Edgar Mata
 
Formato cramer 3x3
Formato cramer 3x3Formato cramer 3x3
Formato cramer 3x3Edgar Mata
 
Exercise 2 2 - area under the curve 2020
Exercise 2 2 - area under the curve 2020Exercise 2 2 - area under the curve 2020
Exercise 2 2 - area under the curve 2020Edgar Mata
 
Exercise 4 1 - vector algebra
Exercise 4 1 - vector algebraExercise 4 1 - vector algebra
Exercise 4 1 - vector algebraEdgar Mata
 
Exercise 3 2 - cubic function
Exercise 3 2 - cubic functionExercise 3 2 - cubic function
Exercise 3 2 - cubic functionEdgar Mata
 
Problemas cramer 3x3 nl
Problemas cramer 3x3 nlProblemas cramer 3x3 nl
Problemas cramer 3x3 nlEdgar Mata
 
Cramer method in excel
Cramer method in excelCramer method in excel
Cramer method in excelEdgar Mata
 
Cramer method sd2020
Cramer method sd2020Cramer method sd2020
Cramer method sd2020Edgar Mata
 
Exercise 2 1 - area under the curve 2020
Exercise 2 1 - area under the curve 2020Exercise 2 1 - area under the curve 2020
Exercise 2 1 - area under the curve 2020Edgar Mata
 
Template 4 1 word problems 2 unk 2020
Template 4 1 word problems 2 unk 2020Template 4 1 word problems 2 unk 2020
Template 4 1 word problems 2 unk 2020Edgar Mata
 

More from Edgar Mata (20)

Activity 12 c numb
Activity 12 c numbActivity 12 c numb
Activity 12 c numb
 
Pw roo complex numbers 2021
Pw roo complex numbers 2021Pw roo complex numbers 2021
Pw roo complex numbers 2021
 
Ar complex num 2021
Ar complex num 2021Ar complex num 2021
Ar complex num 2021
 
Formato 1 1-limits - solved example 01
Formato 1 1-limits - solved example 01Formato 1 1-limits - solved example 01
Formato 1 1-limits - solved example 01
 
Activity 1 1 part 2 exer ea2021
Activity 1 1 part 2 exer ea2021Activity 1 1 part 2 exer ea2021
Activity 1 1 part 2 exer ea2021
 
Problem identification 2021
Problem identification 2021Problem identification 2021
Problem identification 2021
 
Formato 1 1-limits ea2021
Formato 1 1-limits ea2021Formato 1 1-limits ea2021
Formato 1 1-limits ea2021
 
Activity 1 1 real numbers
Activity 1 1 real numbersActivity 1 1 real numbers
Activity 1 1 real numbers
 
Activity 1 1 limits and continuity ea2021
Activity 1 1 limits and continuity ea2021Activity 1 1 limits and continuity ea2021
Activity 1 1 limits and continuity ea2021
 
Course presentation differential calculus ea2021
Course presentation differential calculus ea2021Course presentation differential calculus ea2021
Course presentation differential calculus ea2021
 
Course presentation linear algebra ea2021
Course presentation linear algebra ea2021Course presentation linear algebra ea2021
Course presentation linear algebra ea2021
 
Formato cramer 3x3
Formato cramer 3x3Formato cramer 3x3
Formato cramer 3x3
 
Exercise 2 2 - area under the curve 2020
Exercise 2 2 - area under the curve 2020Exercise 2 2 - area under the curve 2020
Exercise 2 2 - area under the curve 2020
 
Exercise 4 1 - vector algebra
Exercise 4 1 - vector algebraExercise 4 1 - vector algebra
Exercise 4 1 - vector algebra
 
Exercise 3 2 - cubic function
Exercise 3 2 - cubic functionExercise 3 2 - cubic function
Exercise 3 2 - cubic function
 
Problemas cramer 3x3 nl
Problemas cramer 3x3 nlProblemas cramer 3x3 nl
Problemas cramer 3x3 nl
 
Cramer method in excel
Cramer method in excelCramer method in excel
Cramer method in excel
 
Cramer method sd2020
Cramer method sd2020Cramer method sd2020
Cramer method sd2020
 
Exercise 2 1 - area under the curve 2020
Exercise 2 1 - area under the curve 2020Exercise 2 1 - area under the curve 2020
Exercise 2 1 - area under the curve 2020
 
Template 4 1 word problems 2 unk 2020
Template 4 1 word problems 2 unk 2020Template 4 1 word problems 2 unk 2020
Template 4 1 word problems 2 unk 2020
 

Spc xs resuelto - licmata

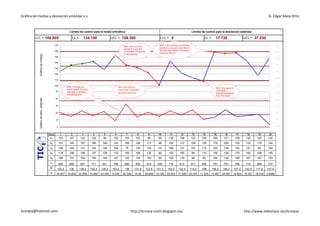
  • 1. Gráfica de medias y desviación estándar x-s G. Edgar Mata Ortiz Límites de control para la media aritmética Límites de control para la desviación estándar LCL = 108.805 CL = 134.100 UCL = 159.395 LCL = 0 CL = 17.726 UCL = 37.030 170 NR3. Six (or more) NR5. Two or three out of three points in a row are points in a row are more than 2 160 SD form the mean in the same continually increasing or decreasing direction (WE 2) Gráfico de medias 150 140 130 120 110 100 NR4. Fourteen (or NR1. One point is NR1. One point is more) points in a row more than 3 standard 50 more than 3 alternate in direction, devitions from the standard devitions increasing then from the mean Gráfico de desv. estándar 40 30 20 10 0 Datos 1 2 3 4 5 6 7 8 9 10 11 12 13 14 15 16 17 18 19 20 x1 103 147 143 122 88 152 153 152 89 95 138 106 122 105 166 151 159 125 125 145 x2 107 145 167 165 149 143 165 128 117 98 155 112 109 125 179 204 132 133 115 144 x3 140 148 121 145 128 154 75 136 123 131 169 121 157 110 153 139 152 131 93 150 x4 118 109 156 127 128 170 155 108 132 90 152 155 89 110 139 138 175 164 108 145 x5 158 131 104 152 148 147 132 135 153 92 102 118 94 90 154 149 168 161 147 153 S 626 680 691 711 641 766 680 659 614 506 716 612 571 540 791 781 786 714 588 737 x 125.2 136 138.2 142.2 128.2 153.2 136 131.8 122.8 101.2 143.2 122.4 114.2 108 158.2 156.2 157.2 142.8 117.6 147.4 s 20.837 14.832 22.956 15.892 22.094 9.239 32.336 14.26 20.846 15.145 22.833 17.095 24.343 11.225 13.467 24.457 14.824 16.327 18.018 3.4986 licmata@hotmail.com http://licmata-math.blogspot.mx/ http://www.slideshare.net/licmata/