
Recommended
Recommended
More Related Content
What's hot
What's hot (17)
Viewers also liked
Similar to Door drop facts figures 2010
Similar to Door drop facts figures 2010 (20)
Door drop facts figures 2010
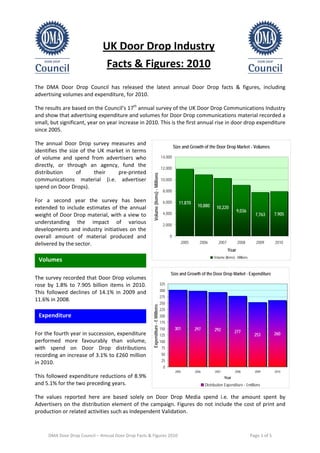
- 1. UK Door Drop Industry Facts & Figures: 2010 The DMA Door Drop Council has released the latest annual Door Drop facts & figures, including advertising volumes and expenditure, for 2010. The results are based on the Council’s 17th annual survey of the UK Door Drop Communications Industry and show that advertising expenditure and volumes for Door Drop communications material recorded a small, but significant, year on year increase in 2010. This is the first annual rise in door drop expenditure since 2005. The annual Door Drop survey measures and Size and Growth of the Door Drop Market - Volumes identifies the size of the UK market in terms of volume and spend from advertisers who 14,000 directly, or through an agency, fund the 12,000 distribution of their pre‐printed Volume (Items) - Millions communications material (i.e. advertiser 10,000 spend on Door Drops). 8,000 For a second year the survey has been 6,000 11,870 extended to include estimates of the annual 10,880 10,220 9,036 weight of Door Drop material, with a view to 4,000 7,763 7,905 understanding the impact of various 2,000 developments and industry initiatives on the overall amount of material produced and 0 delivered by the sector. 2005 2006 2007 2008 2009 2010 Year Volume (Items) - Millions Volumes Size and Growth of the Door Drop Market - Expenditure The survey recorded that Door Drop volumes rose by 1.8% to 7.905 billion items in 2010. 325 300 This followed declines of 14.1% in 2009 and 275 11.6% in 2008. 250 Expenditure - £ Millions . 225 Expenditure 200 Trends xx 175 150 301 297 292 For the fourth year in succession, expenditure 277 260 125 253 performed more favourably than volume, 100 with spend on Door Drop distributions 75 recording an increase of 3.1% to £260 million 50 25 in 2010. 0 2005 2006 2007 2008 2009 2010 This followed expenditure reductions of 8.9% Year and 5.1% for the two preceding years. Distribution Expenditure - £millions The values reported here are based solely on Door Drop Media spend i.e. the amount spent by Advertisers on the distribution element of the campaign. Figures do not include the cost of print and production or related activities such as Independent Validation. DMA Door Drop Council – Annual Door Drop Facts & Figures 2010 Page 1 of 5
- 2. Trends Size and Growth of the Door Drop Market: % Year on Year Movements 10.0% Following a period of robust and sustained 6.0% % Year on Year Movement 5.0% 3.9% growth from the late 90’s to 2005 the 3.1% 1.8% 0.0% industry had contracted from 2006 to 2009. -1.5% -1.5% Over those four years volumes consistently -5.0% -6.1% -5.1% contracted at a faster pace than spend. This -10.0% -8.3% -8.9% trend reflected a number of factors -11.6% -15.0% -14.1% including: -20.0% Improved use of client data and 2005 2006 2007 2008 2009 2010 targeting techniques to enhance Year relevance and reduce volume % Year on year increase in Volume % Year on year increase in Distribution Revenue Growth in digital / online share of advertising spend The recession which has particularly impacted on the retail and financial sectors A steady reduction in the free newspaper circulation base and a transfer of some activity to more expensive Door Drop channels Whilst the above factors continue to be influences on the medium, the encouraging return to growth in 2010 reflects two further factors: Door Drops participating in the general recovery of advertising expenditure during 2010 Service and capacity enhancements introduced by Royal Mail Door to Door Door Drops and Total UK Door Drop Growth compared with other Media Advertising Expenditure 25% 20% 17.8% Growth 13.1% 13.0% 14.9% 14.0% 13.6% 15% 9.2% 11.2% % Increase Year on Year 10% 6.5% 5.4% 6.0% 3.1% 5% The Door Drop industry noticeably 0% -1.5% -1.5% -5.1% -5% outperformed total UK advertising -10% -8.9% expenditure during the late nineties -15% -20% and early noughties. This reflected -25% the increasing maturity of the -30% -35% medium and its growing popularity as 1995 1996 1997 1998 1999 2000 2001 2002 2003 2004 2005 2006 2007 2008 2009 2010 both a strategic and a tactical Year communications tool. Door Drop Press Television Radio Total Advertising Its ability to work with other media Door Drop Growth compared with other Media - The Internet: 2005 - 2010 and almost uniquely offer both 70% precision and penetration were also 60% 50% important contributors to growth % Increase Year on Year 40% against the background of increasing 30% media fragmentation. 20% 10% 6.0% 3.1% With spend on digital media growing 0% -1.5% -1.5% -5.1% -8.9% at a significant pace, Door Drops, in -10% common with most other traditional -20% 2005 2006 2007 2008 2009 2010 media, performed less well than total Year advertising expenditure from 2006 to Door Drop Internet Total Advertising 2008. Improved use of client data and targeting techniques to enhance relevance also contributed to a below average growth rate over that period. DMA Door Drop Council – Annual Door Drop Facts & Figures 2010 Page 2 of 5
- 3. With the recession taking a heavy toll on traditional advertising channels, Door Drops performed better than total UK advertising in 2009. For 2010, Door Drops have returned to growth. However, following a more shallow ‘trough’ in 2009, the rate of year on year growth in 2010 is about half that for total UK advertising. Door Drop Communications Per Size and Growth of the Door Drop Market Letterbox Per Week 10.0 9.0 8.0 Over the last five years, the number of GB 7.0 households has grown by an estimated 3.8% 6.0 Items. whilst Door Drop volumes have decreased by 5.0 9.1 33.4%. 4.0 8.3 7.7 6.8 3.0 5.8 5.8 The average number of Door Drop 2.0 1.0 communications delivered to the average GB 0.0 household on an average week has, 2005 2006 2007 2008 2009 2010 therefore, fallen from 9.1 items in 2005 to 5.8 Year items in 2010 ‐ a reduction of 35.9%. Average Volume (Items) Per GB Household Per Week Door Drop Promotional Material Facts & Figures: 2005 to 2010 As part of the DMA’s overall policy towards environmental affairs, which has included the introduction of the Your Choice Preference Scheme for unaddressed mail, Environmental Best Practice Guidelines and BSi’s PAS2020:2009, the Door Drop Council has undertaken to monitor the total amount of promotional material delivered annually via Door Drop campaigns. The scope of the industry survey was expanded in 2009 to include the size and weight of Door Drop items. This identified that the size and pagination of Door Drop material had reduced and that the overall weight of material sent out had dropped by more than was indicated by the reduction in the volume (quantity) of Door Drop items delivered. This exercise has been repeated in 2010 and the results compared with figures from 2005. For 2005/06, Postcomm estimated that 13 billion items of unaddressed direct mail were sent out and that a combination of unaddressed Door Drops and Inserts (advertising material in magazines and newspapers) totalled 368,500 tonnes of promotional material. The Door Drop Council’s survey has identified the following key figures for 2005 and 2010: Average Item Weight Door Drop Industry Weight Estimates - Average Item Weight - gms 20.0 The average weight of a Door Drop 18.0 communication item in 2005 was 18.7 gms 16.0 14.0 (equivalent to an A4‐12pp item on 50 GSM 12.0 paper or an A4‐8pp item on 75 GSM paper). Average Item Weight - Gms 10.0 Average Item Weight - gms 8.0 18.7 gms 6.0 16.0 For 2010, the average weight of a Door Drop 4.0 item was 14% less at 16.0gms (equivalent to 2.0 an A4‐10pp item on 50 GSM or an A4‐7pp 0.0 2005 2010 item on 75 GSM). Year Average Item Weight - gms DMA Door Drop Council – Annual Door Drop Facts & Figures 2010 Page 3 of 5
- 4. Door Drop Industry Weight Estimates - Volume (Items) - millions Volumes 14,000 12,000 Between 2005 and 2010 Door Drop Volume (Items) - millions 10,000 volumes have fallen by 33% from 11.870 8,000 billion items to 7.905 billion items. Volume (Items) - 6,000 Millions 11,870 Volume (Items) - 4,000 Millions 7,905 2,000 Total Door Drop Material 0 2005 2010 Year As a result of a reduction in Door Drop Volume (Items) - Millions volumes together with a reduction in the size / weight of Door Drop items the total Door Drop Industry Weight Estimates amount of Door Drop communications - Total Weight - Metric Tonnes material being sent out has fallen by 43% 250,000 from 221,565 tonnes to 126,725 tonnes. 200,000 Metric Tonnes 150,000 Total Weight - Metric Tonnes 100,000 221,565 Recycling of Direct Marketing Total Weight - Metric 50,000 Tonnes 126,725 A report produced for Defra by Royal Mail 0 and the DMA was published in April 2010 2005 2010 entitled ‘Direct Marketing Material Waste Year Prevention – Report on industry Total Weight - Metric Tonnes performance – Full Year 2009’. Door Drop Industry Weight Estimates - % Movement 2005 to 2010 This is a detailed report and includes the 10% results of a comprehensive survey 5% regarding the level of recycling of Direct 0% Average Item Weight - -5% Marketing Material. gms -10% -13.9% Volume (Items) - % Movement -15% Millions Total Weight - Metric -20% -33.4% Tonnes The research identified that recycling -25% -42.8% rates for Direct Marketing Material had -30% -35% grown from just 29% in 2005 to 76% in -40% 2009. -45% -50% 2010 % Var 2005 The results significantly exceeded the Average Item Weight - gms Volume (Items) - Millions Total Weight - Metric Tonnes industry recycle rate targets agreed with Defra, which were 55% by the end of Recycling of Unaddressed Door Drop Mail 2009 and 70% by the end of 2013. Due to the relatively basic materials used in production; the non‐personalised nature of the communications and the Non- fact that items are delivered individually Recycled Recycled 76% to consumer’s homes, Door Drop 24% Communications are recycle‐friendly and tend to be recycled at an above‐average rate. Recycled Non- Recycled DMA Door Drop Council – Annual Door Drop Facts & Figures 2010 Page 4 of 5
- 5. Scope of the Annual Industry Survey: For data published from 2005, the survey was redefined seeking to measure and establish the size of the UK market in terms of volume and spend from advertisers who directly, or through an agency, fund the distribution of their pre‐printed communications material (i.e. advertiser spend on Door Drops). This includes revenue and volumes for pre‐printed communications where the Advertiser has directly or indirectly (e.g. via an Agency) commissioned and funded the door to door delivery of their prepared (i.e. pre‐printed or produced) communications material which has then been distributed on a commercial basis. This includes leaflets, catalogues, newsletters, product samples etc for commercial organisations, local authorities, charities, central government, locally‐sourced directories etc. The survey specifically excludes volumes and distribution expenditure for: Local Free Weekly Newspapers. Items inserted mechanically into paid or free publications. National Directories, where these are effectively publications with advertising space sold by the media owner (e.g. Yellow Pages, BT Phonebooks, Thomson Directories). The above three ‘excluded’ categories measure their own advertising revenue separately and have control over their own recycling and waste control arrangements, liaising directly with DEFRA. Sources: Door Drop Volumes and Expenditure: DMA Door Drop Council Annual Survey 2010 Door Drop Promotional Material Weights: DMA Door Drop Council Item Weight Survey 2010 Recycling Levels: Royal Mail and the DMA Direct Marketing Material Waste Prevention Report 2009. Other Advertising Expenditure: Advertising Association GB Household Figures: Estimates based on data from the Office for National Statistics © Copyright DMA Door Drop Council, April 2011 DMA Door Drop Council – Annual Door Drop Facts & Figures 2010 Page 5 of 5