1. AP/H Statistics
Mrs. LeBlanc – Perrone Name: ______________________________
8.3: P-ValueGuided Notes Date: ___________
8.3 TESTING A PROPORTION (P-VALUES)
Testing a Proportion
o Throughout this section we will assume that the situations we are dealing with satisfy the
conditions of a binomial distribution
_____ is the number of successes out of trials
is the estimate for , the _____________________________________________
on each trial
represents the _______________________________ on each trial
The samples are large: and
For large samples, the distribution is
____________________________________________________________________with
and
Hypotheses for Testing
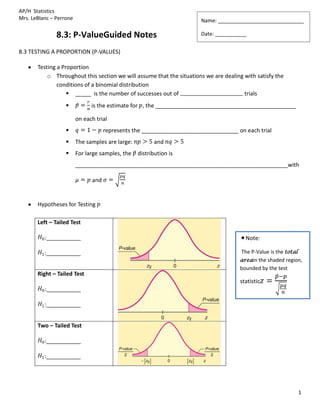
Left – Tailed Test
:___________ Note:
:___________ The P-Value is the total
areain the shaded region,
bounded by the test
Right – Tailed Test
statistic
:___________
:___________
Two – Tailed Test
:___________
:___________
1
2. AP/H Statistics
Mrs. LeBlanc – Perrone
How to Test
1. ______________________________________________________________________________
Is this a binomial experiment with trials?
Does represent the probability of success?
Identify
Is the sample large? (Is and ?) (Use p from )
If yes, then the distribution can be approximated by the normal distribution
2. ______________________________________________________________________________
______________________________________________________________________________
3. ______________________________________________________________________________
______________________________________________________________________________
Sample Test Statistic:
4. ____________________________________________________________________________
______________________________________________________________________________
use the standard normal distribution
5. ______________________________________________________________________________
If P-value , we reject
If P-value > , we fail to reject
6. ______________________________________________________________________________
2
3. AP/H Statistics
Mrs. LeBlanc – Perrone
o Example: Testing
A team of eye surgeons has developed a new technique for a risky eye operation to restore the sight of
people blinded from a certain disease. Under the old method, it is known that only 30% of the patients
who undergo this operation recover their eyesight. Suppose that surgeons in various hospitals have
performed a total of 225 operations using the new method and that 88 have been successful (i.e., the
patients fully recovered their sight). Can we justify the claim that the new method is better than the
old one? (Use a 1% level of significance.)
3
4. AP/H Statistics
Mrs. LeBlanc – Perrone
Summary Questions
1. How is testing (using P-values) similar to testing (using P-values)?
____________________________________________________________________________________
____________________________________________________________________________________
____________________________________________________________________________________
____________________________________________________________________________________
2. How do you find the total area in each tail, when testing using P-values? (Choose one method: using
the table or using the calculator. Hint: it’s a similar process to what we did in chapter 6)
____________________________________________________________________________________
____________________________________________________________________________________
____________________________________________________________________________________
____________________________________________________________________________________
____________________________________________________________________________________
____________________________________________________________________________________
3. What does it mean to “reject” or “fail to reject” ? (Hint: see section 8.1)
____________________________________________________________________________________
____________________________________________________________________________________
____________________________________________________________________________________
____________________________________________________________________________________
“HOT” Question:
__________________________________________________________________________________________
__________________________________________________________________________________________
4