Recommended

Recommended
More Related Content
Featured
Featured (20)
Mayo Clinic Conference on Systems Engineering and Operations Research in Healthcare
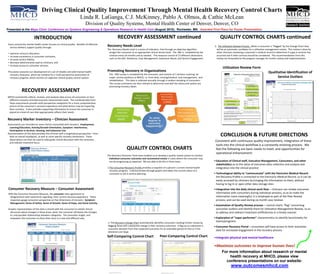
- 1. Driving Clinical Quality Improvement Through Mental Health Recovery Control Charts Linda R. LaGanga, C.J. McKinney, Pablo A. Olmos, & Cathie McLean Division of Quality Systems, Mental Health Center of Denver, Denver, CO Presented at the Mayo Clinic Conference on Systems Engineering & Operations Research in Health Care (August 2010), Rochester, MN. Awarded First Place for Poster Presentation. INTRODUCTION RECOVERY ASSESSMENT continued QUALITY CONTROL CHARTS continued Every community mental health center focuses on clinical quality. Benefits of effective service delivery support quality through: Recovery Needs Level 3. The Utilization Review Process: When a consumer is “flagged” by the Change Chart they The Recovery Needs Level is a series of indicators that through an objective algorithm will be an automatic candidate for a utilization management review. This review is done by • optimize resource allocation, assigns the consumer to an appropriate clinical service level. The RNL is completed by the other clinicians reviewing a consumer’s medical record to determine if a gap in services has • increase consistency in consumer outcomes, clinician every six months and as needed. The measure consist of 15 different dimensions occurred and if other services should be considered. The recommendations from this • increase service fidelity, such as the GAF, Residence, Case Management, Substance Abuse, and Service Engagement. review are forwarded to the program manager for further review and implementation. • decrease administrative load on clinicians, and • increase access to consumer services. Utilization Review Form This poster presents our development of a set of reliable and valid mental health Promoting Recovery in Organizations Qualitative Identification of recovery measures, which we combine for a multi‐perspective assessment of The PRO survey is completed by the consumer, and consists of 7 sections covering all recovery progress, which anchors an objective clinical quality control system. major service positions at MHCD, i.e. front desk, nursing/medical, case management, and Service Outliers rehabilitation. This data is collected annually through a random sampling of consumers. The survey summaries are then utilized to determine how well the teams and system are promoting recovery ideals. RECOVERY ASSESSMENT MHCD consistently collects, reviews, and analyzes data across all consumers on four different recovery‐oriented outcome measurement tools. The combined data from these assessments provide multi‐perspective viewpoints for a more comprehensive picture of the consumer’s recovery experience and what factors may be impacting their recovery. It also provides supporting information to ensure the consumer is placed at a level of care that appropriately reflects their needs. Recovery Marker Inventory – Clinician Assessment Assessments are recorded on seven factors associated with recovery: Employment, Learning/Education, Activity/Growth Orientation, Symptom Interference, Participation in Services, Housing, and Substance Use. Documentation of this data provides the clinician with a longitudinal perspective – from both an overall standpoint, as well as more specific recovery dimensions. These CONCLUSION & FUTURE DIRECTIONS observations can then be used to help guide clinical discussion with the consumer, and indicate treatment focus. Consistent with continuous quality improvement, integration of these tools into the clinical workflow is a constantly evolving process. We QUALITY CONTROL CHARTS feel the following are basic needs to meet, and opportunities for operational enhancement: The Recovery Outcome Tools have enabled us to develop a quality review system to monitor individual consumer outcomes and recommend review in cases where the consumer may not be progressing as expected. We are able to do this in three ways: • Education of Clinical staff, Executive Management, Consumers, and other stakeholders as to the value of outcomes data collection and analysis and 1.The Consumer Recovery Profile provides a snapshot of a person’s current mental health integration into the clinical practice recovery progress. It demonstrates through graphs and tables the current status of a consumer to aid in service planning. • Technological ability to “communicate” with the Electronic Medical Record ‐ the Recovery Profile is connected to the Electronic Medical Record, so it can be easily accessed by clinicians by bringing the information to them, without having to log in or open other data storage sites Consumer Recovery Measure – Consumer Assessment • Integration into the daily clinical work flow – clinicians can review outcomes With the Consumer Recovery Measure, the consumer rates agreement or information with consumers during individual sessions, so as to make the disagreement with statements regarding their current recovery experience. These information more meaningful; it is employed as part of the Peer Review responses gauge consumer perspective on five dimensions of recovery: Symptom process; and can be used during six month case reviews Management, Sense of Safety, Sense of Growth, Sense of Hope, and Social Activity. • Automation of Quality Review process – control charts “flag” concerning Graphic representation of this data is shared with the consumer to initiate clinical outcomes outliers and identify them for Utilization Management Review, so as discussion about changes in these areas, what the consumer attributes the changes to address and redirect treatment inefficiencies in a timely manner to, and possible relationships between categories. This promotes insight, and empowers the consumer to share their story in a new and different way. • Exploration of “super performer” characteristics to identify benchmarks for 2. The Recovery Change Chart automatically identifies consumers needing further review by teams/programs flagging those with substantial change in their recovery outcomes. A flag occurs whenever a • Consumer Recovery Portal – consumers will have access to their outcomes consumer deviates from their expected outcomes for an extended period of time or if the data for increased engagement in the recovery process deviations are large. Self‐Comparing Control Chart Peer‐Comparing Control Chart •Integrate physical and mental healthcare •Maximize outcomes to improve human lives! For more information about research or mental health recovery at MHCD, please view conference presentations on our website: www.outcomesmhcd.com