Marel Q1 2024 Investor Presentation from May 8, 2024
Medical Office Market
1. Topics covered: medical office building (MOB) sales trends, national CRE
values, MOB leasing activity, capital markets, and a market forecast
Fact #4: Metro Atlanta’s MOB vacancy rate is 19%²
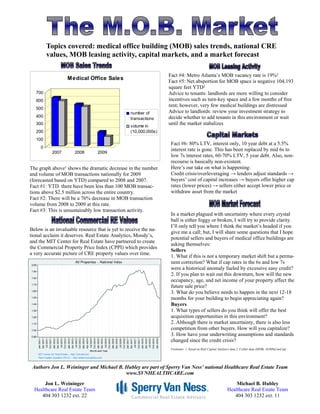
Medical Office Sales
Fact #5: Net absportion for MOB space is negative 104,193
square feet YTD²
700 Advice to tenants: landlords are more willing to consider
600 incentives such as turn-key space and a few months of free
rent; however, very few medical buildings are distressed
500
number of Advice to landlords: review your investment strategy to
400
transactions decide whether to add tenants in this environment or wait
300
volume in
until the market stabalizes
200 (10,000,000s)
100
Fact #6: 80% LTV, interest only, 10 year debt at a 5.5%
0
interest rate is gone. This has been replaced by mid 6s to
2007 2008 2009
low 7s interest rates, 60-70% LTV, 5 year debt. Also, non-
recourse is basically non-existent.
The graph above¹ shows the dramatic decrease in the number Here’s our take on what is happening:
and volume of MOB transactions nationally for 2009 Credit crisis/overleveraging → lenders adjust standards →
(forecasted based on YTD) compared to 2008 and 2007. buyers’ cost of capital increases → buyers offer higher cap
Fact #1: YTD there have been less than 100 MOB transac- rates (lower prices) → sellers either accept lower price or
tions above $2.5 million across the entire country. withdraw asset from the market
Fact #2: There will be a 76% decrease in MOB transaction
volume from 2008 to 2009 at this rate.
Fact #3: This is unsustainably low transaction activity.
In a market plagued with uncertainty where every crystal
ball is either foggy or broken, I will try to provide clarity.
I’ll only tell you where I think the market’s headed if you
Below is an invaluable resource that is yet to receive the na-
give me a call; but, I will share some questions that I hope
tional acclaim it deserves. Real Estate Analytics, Moody’s,
potential sellers and buyers of medical office buildings are
and the MIT Center for Real Estate have partnered to create
asking themselves:
the Commercial Property Price Index (CPPI) which provides
Sellers
a very accurate picture of CRE property values over time.
1. What if this is not a temporary market shift but a perma-
nent correction? What if cap rates in the 6s and low 7s
were a historical anomaly fueled by excessive easy credit?
2. If you plan to wait out this downturn, how will the new
occupancy, age, and net income of your property affect the
future sale price?
3. What do you believe needs to happen in the next 12-18
months for your building to begin appreciating again?
Buyers
1. What types of sellers do you think will offer the best
acquisition opportunities in this environment?
2. Although there is market uncertainty, there is also less
competition from other buyers. How will you capitalize?
3. How have your underwriting assumptions and standards
changed since the credit crisis?
Footnotes: 1. based on Real Capital Analytics data 2. CoStar data (MOBs 10,000sf and up)
Authors Jon L. Weininger and Michael B. Hubley are part of Sperry Van Ness’ national Healthcare Real Estate Team
www.SVNHEALTHCARE.com
Jon L. Weininger Michael B. Hubley
Healthcare Real Estate Team Healthcare Real Estate Team
404 303 1232 ext. 22 404 303 1232 ext. 11