Validation of potential fishing zone (pfz) using satellite data phd credit seminar jitendra i
•
4 likes•1,304 views

Validation of potential fishing zone (pfz) using satellite data phd credit seminar jitendra i

Recommended
Recommended
More Related Content
What's hot
What's hot (20)
Similar to Validation of potential fishing zone (pfz) using satellite data phd credit seminar jitendra i
Similar to Validation of potential fishing zone (pfz) using satellite data phd credit seminar jitendra i (20)
More from College of Fisheries, KVAFSU, Mangalore, Karnataka
More from College of Fisheries, KVAFSU, Mangalore, Karnataka (20)
Recently uploaded
Recently uploaded (20)
Validation of potential fishing zone (pfz) using satellite data phd credit seminar jitendra i
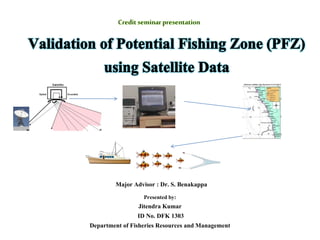
- 1. Major Advisor : Dr. S. Benakappa Presented by: Jitendra Kumar ID No. DFK 1303 Department of Fisheries Resources and Management
- 2. Traditional methods of locating the fishing grounds Compass & Previous experience Colour Bubbles breaking on Surface Muddy and oily water Reflection in the Night Smell FishAvailability
- 3. Indirect detection is possible by observing the associated sea surface phenomena
- 4. Satellite Remote Sensing can be a very powerful tool employed in the wise-use of fishery resources, including its utilization to detect Potential Fishing Zones The first use of satellite remote sensing in fishery advisory operations in the US was in 1971 Laurs, 1993
- 5. Potential Fishing Zone PFZ is a reliable and short-term forecast on the fish aggregation zones in the open sea. What is PFZ? Potential Fishing Zone advisories - A promising tool for Precision fishing
- 7. How it is developed? Source: Subramanian et al., 2014 and http://www.icargoa.res.in/
- 8. PFZ advisories are being generated and disseminated to the entire fishermen community situated -Indian coast To improve the coverage- Electronic display board (EDB) has been developed and installed at various fish landing centre How PFZ is received at the fish landing centre? Latest EDB version Subramanian et al., 2014
- 10. How to use PFZ? It is better to catch fish - day after receiving
- 11. Fishing at the end of the PFZ advisory will give a smaller catch
- 12. Choudhury et al. (2007)
- 13. If the PFZ is shown as a curve then fishing inside the curved area will yield maximum catch.
- 14. When there are two or more PFZ close to each other, then fishing in between those gives a better catch
- 15. Fishing on the opposite direction of the shift is likely to give a much lesser catch or no catch at all.
- 17. Materials and Methods April 2007 and March 2011 Three coastal districts Thiruvallur (1) Chennai (3) Kancheepuram (2) During the study period- Gillnet gears - used for fishing
- 18. PFZ Generation NOAA AVHRR Data Extraction SST Image Generation Geometric correction SST Computation Overlay of SST contours on Chl. image IRS P4 OCM Chl. computation Atmospheric Corrections Data Extraction Chl. Image generation Co- Registration Interpretation of Fishery Forecast PFZ Chart Generation Generation of fishery forecast
- 19. Dissemination of PFZ advisories The PFZ advisories were disseminated to the fishing community using a wide range of media such as to enable the fishing community to obtain information and attempt for more fishing in the PFZ
- 21. Chennai District
- 22. Kancheepuram district Rabbit fish (Siganus javus)
- 23. Total fish catch in three coastal districts of North Tamil Nadu
- 26. Number of beneficiaries in the fishing community
- 28. Materials and Methods Total of 87 validation experiments were carried out during 2009-12 Identical vessels of three categories gillnetters, trawlers and longliners For validation experiments within and outside PFZs. Mann-Whitney U test using statistical package Gut contents of pelagic fishes- (PFZ and non-PFZ viz.) Sardinella spp. (Clupeidae) Rastrelliger spp. (Scombridae) and Megalaspis cordyla (Carangidae) Feedback data also collected.
- 29. Fish catch: PFZ vis-à-vis non-PFZ: Results Descriptive statistics for the total fish catch
- 30. Species contribution PFZ vis-à-vis Non PFZ from gillnetters
- 31. PFZ vis-à-vis Non PFZ from trawlers
- 32. PFZ vis-à-vis Non PFZ from longliners
- 33. Gut contents of fishes within and outside PFZ Major gut contents of pelagic fishes A total of 461 fish specimens including 155 clupeids, 190 scombrids and 116 carangids were considered
- 34. Gut content analysis revealed significant variation between the PFZ and Non-PFZ . For sardines (Sardinella spp.), 92% Fish (PFZ) full stomach fully digested greenish mass as major diet i.e. better availability of food 46% Fish (non-PFZ) full-stomach
- 35. Significantly higher in notified (PFZ) area Discussion
- 36. The fluctuations in the physical, chemical and biological oceanographic conditions have influence on the periodic and seasonal migration of fishes Kawasaki et al. (1991)
- 37. Kripa et al. (2014) PFZ advisory maps released by the INCOIS during 2003-07 regions of the Arabian Sea off Kerala with depths less than 50 m occurred more in the PFZ advisory maps than the mid continental shelf region and the continental slope.
- 38. Positive relationship between PFZ and abundance of commercially important pelagic fishes. CPUE was more- PFZ Extra quantity of fish caught- 2 to 6 times - PFZ Extra benefit obtained 2 to 7 times - PFZ
- 39. Validation off Karwar showed that catch was significantly higher in notified (PFZ) area with high densities as compared to non notified (non-PFZ) regions. Radhakrishnan et al. (2004) reported more or less same fish catch in both IPFZ and Non-IPFZ locations based on the validation studies carried out along the Mangalore coast. Choudhury et al. (2007)
- 40. Subsequently the usefulness of the technology for locating pelagic fish concentration along Kerala coast was established based on validation attempted since 1996 - (Pillai et al., 1996, 1997, 1998, 2000, 2006, 2007)
- 41. Things to avoid Avoid fishing at the end point of the PFZ advisory, it will yield a lower catch. Avoid fishing on the opposite direction of the shifting feature as the fish moves in the direction of the shift. Fishing is to be avoided during day time as the fishes dive to deeper areas during day time because of the sunlight. Ideal time is to fish during late evening or early morning. Indiscriminate fishing of small sizes of fishes.
- 42. Helps to locate the fishing grounds Saving on valuable fuel and human work Reduction in search time by 30 to 70 % Fishing period reduced from 3-5 days to 1-2 days Traditional fishermen can benefit by the use of PFZ forecast when available near shore Conclusion (Solanki et al., 2005; Nammalwar et al., 2013 and Subramanian et al., 2014) (Subramanian et al., 2014) (Simpson, 1992 and Subramanian et al., 2014) Choudhury et al. (2007) Solanki et al., 2002, 2003
- 43. It is necessary to utilize available technology and scientific tools like remote sensing in order to ensure economically viable fishing by reducing the search time for productive fishing grounds.
- 44. CHATURVEDI, N., NARAIN, A., GULATI, D. K., JOHN, M. E. & SOMVANSHI, V. S. (2000) Interrelationship between satellite derived chlorophyll and temperature profile from cruise data: a study for Arabian sea on seasonal basis. PORSES Proceedings. Vol. 1. Goa, India, Dec. 5-8, 2000. pp 347-349. DWIVEDI, R.M., SOLANKI, H.U., NAYAK, S.R., GULATI D.K. and SOMVANSHI, V.S. (2005) Exploration of fishery resources through integration of ocean colour with sea surface temperature: Indian experience. Ind. J. Mar. Sci. 34(4): 430-440. GEORGE, G., PANDIAN KRISHNAN, SIBNARAYAN DAM ROY, KAMAL SARMA, M. P. GOUTHAM BHARATHI1, M. KALIYAMOORTHY, V. KRISHNAMURTHY and T. SRINIVASA KUMAR. (2013). Validation of Potential Fishing Zone (PFZ) Forecasts from Andaman and Nicobar Islands, Fishery Technology, 50: 208- 212. NAMMALWAR, P AND SATHEESH, S. and RAMESH, R (2013) Applications of Remote Sensing in the validations of Potential Fishing Zones (PFZ) along the coast of North Tamil Nadu, India. Indian Journal of Geo-Marine Sciences, 42 (3): 283-292. NAYAK, S.R., SOLANKI, H.U. and DWIVEDI, R.M. (2003) Utilization of IRS P4 ocean colour data for potential fishing zone-A cost benefit analysis. Ind. J. Mar. Sci., 32(3): 244-248 SOLANKI, H. U., DWIVEDI, R. M., NAYAK, S. R., GULATI, D. K., JOHN, M. E. and SOMAVANSHI, V. S. 2003. Potential Fishing Zone (PFZs) forecast using satellite data derived biological and physical processes. J. Indian Soc. Rem. Sen., 31(2): 67-69. SOLANKI, H.U., DWIVEDI, R.M., NAYAK, S.R., JADEJA, J.V., THAKER, D.B., DAVE, H.B. and PATEL, M.I. (2001). Application of ocean colour monitor chlorophyll and AVHRR SST for fishery forecast: Preliminary validation result off Gujarat coast, north coast of India. Indian Journal Marine Sciences, 30:132–138.
- 45. Acknowledgement Chairman: Dr. S. Benakappa Professor and Head, Dept. of FRM Members: Dr. Sujitha Thomas Senior Scientist,CMFRI, Mangalore Dr. H.N. Anjanayappa Associate Professor, Dept. of FRM Dr. S.R. Somashekara Associate Professor, Dept. of FRM Dr. Lakshmipathi M.T. Associate Professor,Dept. of AEM Mr. A.S. Kumar Naik AssistantProfessor, Dept. of FRM