An effective frequency domain approach to tuning non-PID controllers for high performance
•
0 likes•698 views

This document proposes a new method for tuning non-PID controllers to achieve high performance control of complex processes. The method involves 3 stages: 1) Determining an optimal closed-loop transfer function based on the process characteristics and limitations. 2) Deriving an ideal controller from the optimal transfer function, which is usually complex. 3) Applying model reduction to the ideal controller to obtain a simpler, realizable controller form. Simulation examples are provided to demonstrate the effectiveness of the proposed non-PID controller tuning method for complex processes where PID control is insufficient.

Recommended
Recommended
More Related Content
Viewers also liked
Viewers also liked (20)
Similar to An effective frequency domain approach to tuning non-PID controllers for high performance
Similar to An effective frequency domain approach to tuning non-PID controllers for high performance (20)
More from ISA Interchange
More from ISA Interchange (20)
Recently uploaded
Recently uploaded (20)
An effective frequency domain approach to tuning non-PID controllers for high performance
- 1. ISA TRANSACTIONS® ISA Transactions 41 ͑2002͒ 37–49 An effective frequency domain approach to tuning non-PID controllers for high performance Qing-Guo Wang,* He Ru, Xiao-Gang Huang Department of Electrical & Computer Engineering, National University of Singapore, 10 Kent Ridge Crescent, Singapore 119260, Singapore ͑Received 31 May 2000; accepted 7 September 2000͒ Abstract In this paper, a new tuning method is proposed for the design of non-PID controllers for complex processes to achieve high performance. Compared with the existing PID tuning methods, the proposed non-PID controller design method can yield better performance for a wide range of complex processes. A suitable objective transfer function for the closed-loop system is chosen according to process characteristics. The corresponding ideal controller is derived. Model reduction is applied to fit the ideal controller into a much simpler and realizable form. Stability analysis is given and simulation examples are provided to demonstrate the effectiveness of the proposed method. © 2002 ISA—The Instrumentation, Systems, and Automation Society. Keywords: Non-PID controllers; Loop performance; Nonminimum phase; Model reduction; Stability 1. Introduction necessarily results in sluggish response and poor performance, which might not be desirable. To The PID controller is the most widely used con- overcome the limitations imposed by PID control- troller in the industry ͓1͔. Most PID tuning meth- lers, controllers of other types, i.e., non-PID con- ods are based on specific types of processes such trollers, are thus needed for high performance con- as first-order plus dead time ͑FOPDT͒ and second- trol of complex processes. order plus dead time ͑SOPDT͒ processes ͓2͔. Such Though there are already a lot of methods avail- models may be obtained by control-relevant iden- able for designing non-PID controllers, most of tification ͓3͔ or other methods. For complex pro- them are based on state space approach, which cesses beyond the FOPDT and SOPDT types, PID makes them inconvenient for direct implementa- control may not be able to generate satisfactory tion. We are thus motivated to find a more simple results. For example, if the process Nyquist curve and effective way to design non-PID controllers has an irregular contour, especially around the using output feedback only. crossover frequency, a PID controller could be dif- In this paper, a new tuning method is proposed ficult to shape it satisfactorily. Under the circum- for the design of general non-PID controllers for stances, the PID controller is often detuned by complex processes. The proposed design starts trading off some performance to a sufficient extent with specifying an objective closed-loop transfer so as to make closed-loop stable. However, this function, which is supposed to achieve the fastest possible response. Performance limitation im- *Corresponding author. Tel.: ϩ65-6874-2282; fax: ϩ65- posed by the nonminimum phase part of the plant 6779-1103; E-mail address: elewqg@nus.edu.sg. has been taken into consideration, such as right 0019-0578/2002/$ - see front matter © 2002 ISA—The Instrumentation, Systems, and Automation Society.
- 2. 38 Qing-Guo Wang, He Ru, and Xiao-Gang Huang / ISA Transactions 41 (2002) 37–49 In this section, we will discuss the first stage of our non-PID controller design. It is well known that the best achievable control performance for a process is limited by its nonminimum phase nature ͓4͔. To figure out the achievable performance, the Fig. 1. Unity feedback control system. ˆ process model G is factorized into half plane zeros and time delays. The ideal con- troller derived from the objective closed-loop G ͑ s ͒ ϭG mp͑ s ͒ ˆ ˆ ͫ͟ m iϭ1 ͬ ͑ z i Ϫs ͒ e Ϫ s , ͑2͒ transfer function turns out to be very complex. ˆ where G mp represents the stable and minimum Model reduction with a recursive least squares al- gorithm is thus applied to fit it into a much simpler ˆ phase part of G . The nonminimum phase part of form. The order of the controller is determined as G consists of nonminimum phase zeros ͟ iϭ1 ( z i ˆ m the lowest so as to make the controller of the least Ϫs ) and the time delay e Ϫ s . As nonminimum complexity and yet achieve a specified approxima- phase zeros and time delays are inherent charac- tion accuracy. Simulation results are provided to teristics of a process and cannot be altered by any show that the proposed design is applicable to a feedback control, the achievable closed-loop trans- wide range of complex processes with high perfor- fer function H is formulated as ͫ͟ ͩ ͪͬ mance where PID controllers are inadequate or m limited in performance. z i Ϫs H͑ s ͒ϭ e Ϫs f ͑ s ͒, ͑3͒ The paper is organized as follows. Specification iϭ1 z i ϩs of our desired objective loop performance is de- tailed in Section 2. In Section 3, the model reduc- ˆ that is, the nonminimum phase part of G has to tion method employed in our proposed design is remain in H without any change. The f in Eq. ͑3͒ presented. Then the overall tuning procedure is usually has the format summarized in Section 4 and simulation examples are provided in Section 5. In Section 6, stability of f ͑ s ͒ ϭ f 1͑ s ͒ f 2͑ s ͒ , ͑4͒ the proposed method is analyzed. Finally, some where concluding remarks are made in Section 7. 1 ͩ ͪ 2. Determination of the objective loop f 1͑ s ͒ ϭ ␦ ͑5͒ 1 performance sϩ1 Nn Consider the conventional unity feedback con- is a filter to provide necessary high frequency gain ˆ trol system in Fig. 1, where G is a model of the reduction ͑or roll-off͒ rate and given stable plant G to be controlled and K the controller. Our proposed method for non-PID con- 2 n f 2͑ s ͒ ϭ ͑6͒ troller design consists of the following three s 2 ϩ2 n sϩ 2 n stages. First, the best achievable objective transfer function H for the closed-loop system is derived is a standard second-order rational function that from the process dynamic characteristics. Next, reflects typical performance requirements such as the ideal controller K, which might be complex overshoot and settling time. and not realizable, is obtained from The filter order ␦ in Eq. ͑5͒ determines the roll- off rate of the system at high frequencies. Let ˆ GK ( G ) be the relative degree of G . ␦ is taken as ˆ ˆ Hϭ . ͑1͒ ˆ 1ϩG K ␦ ϭmax͕ 0, ͑ G ͒ Ϫ2 ͖ ˆ ͑7͒ ˆ At the last stage, its approximation K , a simple to ensure that the resultant K is proper and physi- rational function, is found through model reduc- cally realizable. N in Eq. ͑5͒ is a parameter that tion. measures how much faster the roll-off rate of f 1 is
- 3. Qing-Guo Wang, He Ru, and Xiao-Gang Huang / ISA Transactions 41 (2002) 37–49 39 relative to that of f 2 . To provide necessary high- b frequency gain reduction without changing the nϷ ͑11͒ working frequency range characteristics, N is cho- ͓ ͱ͑ 2 2 Ϫ1 ͒ 2 ϩ1Ϫ ͑ 2 2 Ϫ1 ͔͒ 1/2 sen in the range of 10–20. ignoring the effect of the f 1 . The damping ratio is usually set according to the overshoot specification on the closed loop step response. It is generally acceptable to have the de- 3. Model reduction fault value of as 0.707. n serves as a measure of the closed-loop response speed, and is related to Once a suitable H is determined by the proce- the closed-loop bandwidth, which is essentially dure described in the preceding section, the ideal limited by the nonminimum phase part of the pro- controller can then be calculated from Eq. ͑1͒ as cess. One knows that the response tends to be H heavily oscillatory if n is too large while a slug- Kϭ . ͑12͒ gish response results if n is too small. A suitable ͑ 1ϪH ͒ G ˆ n is found as follows. It is shown by Astrom ͓4͔ that the gain crossover This controller is usually of a highly compli- frequency g has to meet cated form and difficult to implement. Hence model reduction is employed to find a controller in ͩ ͪ m the least complex form and yet achieve the speci- z iϪ j g fied approximation accuracy. A number of meth- ͚ arctan iϭ1 z iϩ j g Ϫ g уϪ ϩ m Ϫn g /2, ods for rational approximation are surveyed by ͑8͒ Pintelon et al. ͓6͔. A recursive least squares ͑RLS͒ algorithm is suitable for our application and is briefly described as follows. The problem at hand where the m is the required phase margin and n g is to find a nth-order rational function approxima- is the slope of the open loop gain at the crossover tion: frequency. It is generally accepted that a desired shape for the open-loop gain ͉ L ( j ) ͉ b n s n ϩb nϪ1 s nϪ1 ϩ¯ϩb 1 sϩb 0 ͉ G ( j ) K ( j ) ͉ should typically have a slope of ˆ Kϭ ˆ ͑13͒ s n ϩa nϪ1 s nϪ1 ϩ¯ϩa 1 s about Ϫ1 ͑i.e., n g ϭϪ1 ͒ around the crossover fre- quency, with preferably steeper slopes before and with an integrator such that the approximation er- after the crossover. ror Equation ͑8͒ thus reduces to M J ͚ ͉ W ͑ j i ͒ „K ͑ j i ͒ ϪK ͑ j i ͒ …͉ 2 ˆ ͑14͒ ͩ ͪ m iϭ1 z iϪ j g ͚ iϭ1 arctan z iϩ j g Ϫ g уϪ /2ϩ m . is minimized, where the original function K as ͑9͒ well as the weighting W are given and M is the number of frequency points to be used in the al- gorithm. The cost function J is rewritten as The selection of m reflects the control system ͯ M robustness to the process uncertainty ͓4͔. Typical W͑ j i͒ values for m could be /6, /4, and /3, respec- J͑k͒ ͚ iϭ1 ͑ j i ͒ n ϩa ͑ kϪ1 ͒ ͑ j i ͒ nϪ1 ϩ¯ϩa ͑ kϪ1 ͒ ͑ j i ͒ nϪ1 1 tively. Our study shows that m ϭ /6 is good enough to determine the g . The bandwidth b of ϫ ͕ ͓ b ͑ k ͒ ͑ j i ͒ n ϩb ͑ k ͒ ͑ j i ͒ nϪ1 ϩ¯ϩb ͑ k ͒ ͑ j i ͒ n nϪ1 1 the closed-loop can be estimated ͓5͔ from g by ϩb ͑ k ͒ ͔ ϪK ͑ j i ͓͒͑ j i ͒ n ϩa ͑ k ͒ ͑ j i ͒ nϪ1 ϩ¯ 0 nϪ1 bϭ  g , ͯ ͑10͒ 2 ϩa ͑ k ͒ ͑ j i ͔͒ ͖ , 1 ͑15͒ where  ͓ 1,2͔ . In our design, the  is selected as 2 to achieve a larger n and thus a quicker re- where k denotes the index for the kth recursion in sponse. It follows from the definition of b for H the iterative weighted linear least squares method in Eq. ͑3͒ that and
- 4. 40 Qing-Guo Wang, He Ru, and Xiao-Gang Huang / ISA Transactions 41 (2002) 37–49 W͑ j i͒ Table 1 W͑ j ͒ϭ ¯ Summary of simulation results. ͑ ji͒ n ϩa nϪ1 ͑ j i ͒ nϪ1 ϩ¯ϩa ͑ kϪ1 ͒ ͑ j i ͒ ͑ kϪ1 ͒ 1 Plant Method M p ͑%͒ ts operates as a weighting function derived from the parameters generated in the last recursion. It is eϪ5s Proposed 4.2 20.5 Gϭ Wang-PID 4.3 36.1 ͑ s2ϩsϩ1͒͑sϩ2͒ recommended ͓6͔ that the W is chosen as 1 and ¯ Zhuang-PID 20.1 40.3 standard LS is applied in each iteration. On con- 1.2e Ϫ10s Proposed 5.0 42.2 vergence, the resultant parameters will form one Gϭ Wang-PID 11.0 67.3 ͑ 5sϩ1 ͒͑ 2.5sϩ1 ͒ solution that minimizes the cost function in Eq. Zhuang-PID 20.1 62.9 ͑14͒. To derive the relevant recursive equations, ͑ Ϫ2sϩ1 ͒ e Ϫ4s Proposed 0.5 45.9 rearrange Eq. ͑15͒ to yield the matrix equation Gϭ ͑ 5sϩ1 ͒͑ 3sϩ1 ͒ Wang-PID 4.1 47.0 y kϭ k k , Zhuang-PID 20.1 47.1 where y k ϭϪK ͑ s ͒͑ j i ͒ n , fied phase margin m and approximation accuracy ⑀. k ϭ ͓ a ͑ k ͒ ¯a ͑ k ͒ b ͑ k ͒ b ͑ k ͒ ¯b ͑ k ͒ ͔ T , nϪ1 1 n nϪ1 0 • Step 1. Find out all the nonminimum phase zeros z i , iϭ1,2,...,m, and the time delay of the plant k ϭ ͓ K ͑ s ͒͑ j i ͒ nϪ1 ¯K ͑ s ͒͑ j i ͒ Ϫ ͑ j i ͒ n ˆ model G . Ϫ ͑ j i ͒ nϪ1 ¯Ϫ ͑ j i ͒ Ϫ1 ͔ . • Step 2. Obtain ␦ from Eq. ͑7͒ and choose N in 10–20. The fitting range used in RLS is chosen as ⍀ • Step 3. Determine g from Eq. ͑9͒ and obtain n ( 0.01 g , g ) with M usually taken as 50–100 from Eqs. ͑10͒ and ͑11͒. and i logarithmically equally spaced. This range • Step 4. Form H from Eq. ͑3͒, then evaluate K is the most important for closed-loop stability and from Eq. ͑1͒. robustness. • Step 5. Obtain a controller in Eq. ͑13͒ with the Once a solution to Eq. ͑13͒ is found, the follow- RLS method in Section 3. ing criterion is used to validate the solution: Eϭmax ͯ K ͑ j ͒ ϪK ͑ j ͒ ˆ K͑ j ͒ ͯ р⑀, ⍀, 5. Examples In this section, simulation results for several ͑16͒ typical examples are provided to demonstrate the where ⑀ is the user-specified fitting error threshold. effectiveness of our non-PID controller tuning al- In our design, simulation results show that ⑀ gorithm. The simulation is done under the perfect ϭ5% is good enough for control performance. To model matching condition, i.e., G ϭG ͑model ˆ find a model of the lowest order and yet meet Eq. mismatch will be considered in Section 6͒. Com- ͑16͒, we start with a model order nϭ2 until the parisons are made with two PID tuning methods. smallest integer n is reached such that Eq. ͑16͒ is One is the technique proposed by Wang et al. ͓7͔ satisfied. and it is based on fitting the process frequency response to a SOPDT structure. The other is the modified Ziegler-Nichols method using the opti- 4. Tuning procedure mum ISTE criterion ͓8͔. For ease of presentation, these two PID tuning methods will be referred to In this section, the overall tuning procedure is as Wang-PID method and Zhuang-PID method, re- summarized as follows. spectively, in this paper. The dynamic perfor- mance indices of the closed-loop step responses in 4.1. Overall tuning procedure terms of overshoot in percentage ( M p ) and set- tling time ͑to 1%͒ in seconds ( t s ) are shown in ˆ Given the model G ( s ) of a stable process G ( s ) , Table 1. In Figs. 2– 4, the system responses for the seek a non-PID controller K ( s ) to meet the speci- proposed method, Wang-PID method, and
- 5. Qing-Guo Wang, He Ru, and Xiao-Gang Huang / ISA Transactions 41 (2002) 37–49 41 Fig. 2. Control performance for e Ϫ5s /(s 2 ϩsϩ1)(sϩ2) ͑ , step input; , proposed controller; ¯ , Wang-PID; -•-•-, Zhuang-PID͒. Zhuang-PID method are exhibited by solid, dot- 1.8454s 5 ϩ5.1757s 4 ϩ8.5743s 3 ted, and dashed-dotted lines, respectively. ϩ8.1018s 2 ϩ4.6103sϩ1.2594 Kϭ ˆ , ͑17͒ s 5 ϩ7.0064s 4 ϩ12.8928s 3 5.1. Example 1 ϩ7.0838s 2 ϩ5.2692s Consider the following oscillatory and high- order plant: with the fitting error Eϭ0.22% less than ⑀ ϭ5%. Our design is completed. The PID control- e Ϫ5s ler obtained by the Wang-PID method is Gϭ . ͑ s 2 ϩsϩ1 ͒͑ sϩ2 ͒ 0.1851 The process is of minimum phase and no z i ex- K PIDϭ0.2031ϩ ϩ0.1860s, ists. The dead time is 5. The relative degree is 3, s yielding ␦ ϭ1 from Eq. ͑7͒. N is taken as 20. With default ϭ0.707, it follows that g ϭ0.2094 from while the Zhuang-PID method generates Eq. ͑9͒ and n ϭ0.4189 from Eqs. ͑10͒ and ͑11͒. H ( s ) is thus given by 0.2943 K PIDϭ0.9322ϩ ϩ1.7504s. 0.1755e Ϫ5s s H͑ s ͒ϭ . ͑ s 2 ϩ0.5924sϩ0.1755͒͑ 0.1194sϩ1 ͒ We observe from the step responses plotted in The ideal controller K is obtained from Eq. ͑1͒ Fig. 2 that the Zhuang-PID method does not pro- and model reduction is invoked to give its ap- vide good tuning because the step response is ˆ proximation K as rather oscillatory and the settling time is relatively
- 6. 42 Qing-Guo Wang, He Ru, and Xiao-Gang Huang / ISA Transactions 41 (2002) 37–49 Fig. 3. Control performance for 1.2e Ϫ10s /(5sϩ1)(2.5sϩ1) ͑ , step input; , proposed controller; ¯ , Wang-PID; -•-•-, Zhuang-PID͒. long. The Wang-PID method results in a sluggish The Zhuang-PID method generates a PID control- response. Our proposed design method achieves ler the best performance. 0.0614 5.2. Example 2 K PIDϭ0.6482ϩ ϩ2.7242s. s Consider a plant with a long dead time used in The closed-loop step responses are given in Fig. Zhuang and Atherton ͓8͔: 3. The controller from our method improves the 1.2e Ϫ10s closed-loop system performance significantly in Gϭ . terms of overshoot reduction and response speed. ͑ 5sϩ1 ͒͑ 2.5sϩ1 ͒ It follows from our design procedure that the 5.3. Example 3 lowest order controller is Consider a typical nonminimum phase plant 0.7916s 3 ϩ0.5488s 2 ϩ0.1351sϩ0.0116 from Chien ͓9͔: Kϭ ˆ , s 3 ϩ0.3999s 2 ϩ0.2135s ͑18͒ ͑ Ϫ2sϩ1 ͒ e Ϫ4s Gϭ . with the fitting error Eϭ0.02% less than ⑀ ͑ 5sϩ1 ͒͑ 3sϩ1 ͒ ϭ5%. The Wang-PID method gives a PID con- troller Note that this plant has a right half plane zero at 0.5. Since our proposed design method has already 0.0451 taken into account this inherent characteristic of a K PIDϭ0.3020ϩ ϩ0.4531s. s plant, it succeeds in producing a controller
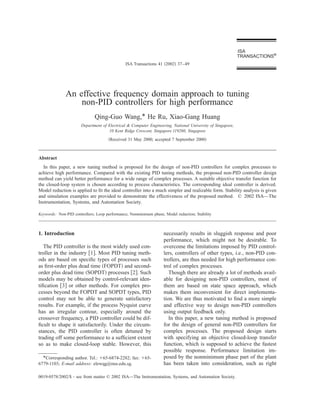
- 7. Qing-Guo Wang, He Ru, and Xiao-Gang Huang / ISA Transactions 41 (2002) 37–49 43 Fig. 4. Control performance for (Ϫ2sϩ1)e Ϫ4s /(5sϩ1)(3sϩ1) ͑ , step input; , proposed controller; ¯ , Wang- PID; -•-•-, Zhuang-PID͒. Kϭ ˆ 0.5748s 2 ϩ0.1426sϩ0.0098 s 2 ϩ0.1338s , with the fitting error Eϭ0.18% less than ⑀ ϭ5%. The Wang-PID method gives a PID con- troller Gϭ ͫ 12.8e Ϫs 16.7sϩ1 6.60e Ϫ7s 10.9sϩ1 Ϫ18.9e Ϫ3s 21.0sϩ1 Ϫ19.4e Ϫ3s 14.4sϩ1 ͬ . The BLT method ͓11͔ gives a multiloop PI con- 0.0630 troller: K PIDϭ0.3979ϩ ϩ0.0701s. ͫ ͬ s k 1͑ s ͒ 0 The Zhuang-PID method produces a PID control- K͑ s ͒ϭ 0 k 2͑ s ͒ ͫ ͬ ler K PIDϭ0.9485ϩ 0.1075 ϩ2.8263s. 0.375 1ϩ ͩ 1 8.29s ͪ 0 ͩ ͪ s ϭ . 1 0 Ϫ0.075 1ϩ The step responses are given in Fig. 4. For this 23.6s example, our proposed method gives almost no overshoot and achieves the best performance. Now let k 1 remain as given by the BLT method, but apply our method to design a new k 2 for the 5.4. Example 4 second loop. The equivalent plant for the second loop with the first loop closed is obtained ͓5͔ as Complex dynamics often come from multivari- g 21g 12 able interactions. Consider the well-known Wood/ g 2 ϭg 22Ϫ Ϫ1 Berry binary distillation column plant ͓10͔: k 1 ϩg 11
- 8. 44 Qing-Guo Wang, He Ru, and Xiao-Gang Huang / ISA Transactions 41 (2002) 37–49 Fig. 5. Nyquist curve of g 2 in Example 4. whose Nyquist curve is shown in Fig. 5. It is ob- with the fitting error Eϭ2.62% less than ⑀ vious that g 2 is not in the FOPDT or SOPDT ϭ5%. Hence, the corresponding multiloop con- ͫ ͬ form. Hence it is very difficult to control g 2 by a troller is formed as ͩ ͪ PID controller, as can be seen from Fig. 6. To figure out what the equivalent nonminimum phase 1 0.375 1ϩ 0 zeros and dead time are in this g 2 , we first apply 8.29s model reduction to get its rational plus dead time 0.0559s3ϩ0.0192s2 K͑ s ͒ϭ . approximation g 2 as ˆ ϩ0.0029sϩ0.0002 0 Ϫ s 3 ϩ0.1512s 2 ϩ0.0144s ͑ 2.0197s 4 ϩ1.0793s 3 ϩ1.1030s 2 ϩ0.0732sϩ0.0054)e Ϫ3.1s The step response of the resultant feedback sys- g 2 ϭϪ ˆ , tem is shown in Fig. 6 with solid lines. The step s 5 ϩ1.2517s 4 ϩ0.6339s 3 ϩ0.1570s 2 ϩ0.0107sϩ0.0006 response using the BLT method is given in dashed-dotted lines. It is observed that the pro- posed method achieves much better loop perfor- from which we can determine the objective mance for this second loop. Since the second loop closed-loop transfer function H ( s ) as usual. The is slower than the first one in the BLT design and proposed controller design procedure then gives the slow loop dominates the system performance, its improvement is more desirable and beneficial. Our simulation shows that within the approxi- 0.0559s 3 ϩ0.0192s 2 ϩ0.0029sϩ0.0002 mation error bound ⑀ ϭ5%, the resultant closed- K ϭϪ ˆ s 3 ϩ0.1512s 2 ϩ0.0144s ˆ loop response achieved by K is so close to our
- 9. Qing-Guo Wang, He Ru, and Xiao-Gang Huang / ISA Transactions 41 (2002) 37–49 45 Fig. 6. Control performance for Example 4 ͑ , step input; , proposed controller; -•-•-, BLT͒. specified objective closed-loop step response that 6. Stability analysis one can hardly distinguish them from the graph. Hence, no curves for the ideal loop are shown in In this section, we will give a detailed stability Figs. 2– 4 and 6. The proposed design method re- analysis of our single-loop control system. Both ally achieves better closed-loop responses with ˆ nominal stability ( GϭG ) and robust stability ( G much smaller overshoot and shorter settling times, ˆ G ) will be discussed. thus shows its superiority over PID control for complex processes. The proposed method is a First, consider the case without model uncer- simple and effective way to design high perfor- ˆ tainty, i.e., GϭG . As our proposed method makes mance controllers. ˆ an approximation K to the ideal controller K, the
- 10. 46 Qing-Guo Wang, He Ru, and Xiao-Gang Huang / ISA Transactions 41 (2002) 37–49 Fig. 7. Block diagram of nominal system. nominal single-loop system is actually as shown in Fig. 8. Block diagram of system with process uncertainty. Fig. 7͑a͒, where K ϭK ( 1ϩ⌬ K ) . The system in ˆ Fig. 7͑a͒ can be redrawn ͓12͔ into Fig. 7͑b͒, where Recall that in the proposed algorithm, the ap- ˆ GK QϭϪHϭϪ . proximation accuracy is required to meet Eq. ͑16͒: ͯ ͯ ˆ 1ϩG K K ͑ j ͒ ϪK ͑ j ͒ ˆ Eϭmax р⑀, ͓ 0, g ͔ , It can be easily seen that Q is stable since H is K͑ j ͒ ˆ stable. With the standard assumption that K has the same number of unstable poles as K, the nomi- where ⑀ is usually specified as 5%. The resultant nal single-loop feedback system is stable ͓12͔ if controller K then satisfies Eq. ͑21͒ with big mar- ˆ and only if gin and the nominal stability of the designed single-loop system is thus expected. ʈ H ͑ j ͒ ⌬ K ͑ j ͒ ʈ ϱ Ͻ1. ͑19͒ Under the situation where the model does not From Eq. ͑3͒, it is easy to note that ʈ H ʈ ϭ ʈ f ʈ represent the plant exactly, nominal stability is not ϭ ʈ f 1 f 2 ʈ . Hence Eq. ͑19͒ is equivalent to sufficient and robust stability of the closed-loop system has to be considered. The single-loop sys- ʈ f 1 ͑ j ͒ f 2 ͑ j ͒ ⌬ K ͑ j ͒ ʈ ϱ Ͻ1. ͑20͒ tem with model uncertainty is shown in Fig. 8͑a͒, The term f 1 provides high frequency roll-off where ͉ ⌬ K ͉ р ␦ K ( ) and ͉ ⌬ G ͉ р ␦ G ( ) . It can be rate and ʈ f 1 ( j ) ʈ ϱ р1 for all . Also note redrawn into the standard form in Fig. 8͑b͒, where ʈ f 2 ( j ) ʈ ϱ р1 for all with chosen as 0.707 ⌬ is the normalized uncertainty ⌬ ϭdiag͕⌬K ,⌬G͖ ˜ ˜ ˜ ˜ or below. Therefore, ͉ f ( j ) ͉ decays fast for with ͉ ⌬ K ͉ р1 and ͉ ⌬ G ͉ р1. The transfer function ˜ ˜ у g and we can assume that Eq. ͑20͒ is true matrix between z and x has no uncertainty and is for у g . It follows that we now need to given by ͬͫ ͬ check Eq. ͑20͒ only for the working frequency range ͓ 0, g ͔ . Note that ʈ f 1 ( j ) f 2 ( j ) ʈ ϱ р ʈ f 1 ( j ) ʈ ϱ ʈ f 2 ( j ) ʈ ϱ р1 for all , hence the Qϭ ͫ ␦K 0 0 ␦G ϪG K ˆ ˆ G ϪK ϪG K ˆ ͑ 1ϩG K ͒ Ϫ1 ˆ ͫ ͬ nominal closed loop is stable if ͯ ͯ ͫ ͬ H K ͑ j ͒ ϪK ͑ j ͒ ˆ ␦K 0 ϪH Ϫ ͉ ⌬ K͉ ϭ р1, ͓ 0, g ͔ . ϭ ˆ G , K͑ j ͒ 0 ␦G ͑21͒ G ͑ 1ϪH ͒ ˆ ϪH
- 11. Qing-Guo Wang, He Ru, and Xiao-Gang Huang / ISA Transactions 41 (2002) 37–49 47 Fig. 9. Performance robustness for e Ϫ5s /(s 2 ϩsϩ1)(sϩ2) ͑ , step input; , nominal performance; -•-•-, perfor- mance after 20% gain change͒. whose stability is guaranteed by our selection of The robust stability condition ͑22͒ becomes H. It follows from the stability robustness theorem ͓13͔ that the uncertain feedback system remains ␦ K ͉ H ͉ 2 ϩ ␦ G ͉ H ͉ 2 ϩ2 ␦ K ␦ G ͉ ͑ 1ϪH ͒ H ͉ 2 2 stable for all ⌬ ϭdiag͕⌬K ,⌬G͖ if and only if ˜ ˜ ˜ ʈ Q ʈ Ͻ1, ͑22͒ ϩ ͱ␦ ͓ K ͉ H ͉ ϩ ␦ G ͉ H ͉ ϩ2␦ K ␦ G ͉ ͑ 1ϪH ͒ H ͉ ͔ 2 2 2 2 Ϫ4 ␦ K ␦ G ͉ H ͉ 2 2 2 2 where ʈ Q ʈ ϭsup „Q ( j ) … and ͑•͒ is the р2, ᭙. ͑24͒ structured singular value with respect to ⌬ . In our ˜ case, the structured singular value „Q ( j ) … can Since 4 ␦ K ␦ G ͉ H ͉ 2 у0, ᭙, and ͉ 1ϪH ͉ р1 2 2 be calculated by ϩ ͉ H ͉ р2, Eq. ͑24͒ is satisfied if „Q ͑ j ͒ …ϭ ͑ DQD Ϫ1 ͒ ϭinf ¯ ͑ DQD Ϫ1 ͒ , D ␦ K ͉ H ͉ 2 ϩ ␦ G ͉ H ͉ 2 ϩ4 ␦ K ␦ G ͉ H ͉ р1, 2 2 ᭙, ͑25͒ where Dϭdiag͕d1 ,d2͖, d 1 ,d 2 Ͼ0, and ¯ ( • ) repre- sents the largest singular value. By some calcula- i.e., tions, we can get „Q ͑ j ͒ … ␦ K͑ ͉͒ f ͑ j ͉͒ 2ϩ ␦ G͑ ͉͒ f ͑ j ͉͒ 2 2 2 ͩ ͯ ͯ ͪ 1ϪH 1/2 ϩ4 ␦ K ͑ ͒ ␦ G ͑ ͒ ͉ f ͑ j ͒ ͉ р1, ᭙. ␦ K ϩ ␦ G ϩ2 ␦ K ␦ G 2 2 H ϩ ͱͩ 2 2 ͯ ͯͪ ␦ K ϩ ␦ G ϩ2 ␦ K ␦ G 1ϪH 2 H ͯͯ Ϫ4 ␦ K ␦ G 2 2 1 H 2 As ͉ f ( j ) ͉ decays fast for ϭ0.707 or below for у g , Eq. ͑25͒ is likely to hold for high ϭ͉H͉ . 2 frequencies. Thus, assume that Eq. ͑25͒ is true for ͑23͒ у g . We now need to check Eq. ͑25͒ only for
- 12. 48 Qing-Guo Wang, He Ru, and Xiao-Gang Huang / ISA Transactions 41 (2002) 37–49 Fig. 10. Performance robustness for 1.2e Ϫ10s /(5sϩ1)(2.5sϩ1) ͑ , step input; , nominal performance; -•-•-, performance after 20% dominant time constant change͒. the working frequency range ͓ 0, g ͔ . Due to indeed nominally stable. To see robustness, intro- ʈ f ( j ) ʈ ϱ р1 for all , the closed loop is robustly duce a 20% perturbation in gain K, giving K stable if ϭ1.2. Due to ␦ K ϭ0.22%р5% and ␦ G ϭ20% р90.37%, the resultant system is expected to re- ␦ K ͑ ͒ ϩ ␦ G ͑ ͒ ϩ4 ␦ K ͑ ͒ ␦ G ͑ ͒ р1, 2 2 main stable, which is indeed the case, as exhibited in Fig. 9 with the dashed-dotted line. ͓ 0, g ͔ . In the proposed method, ͉ ⌬ K ͉ is made small, 6.2. Example 6 i.e., ␦ K ( ) р5%. Let ␦ K ϭ5%, then the closed loop is robustly stable if Reconsider Example 2 ␦ G ͑ ͒ р90.37%, ͓ 0, g ͔ . ͑26͒ 1.2e Ϫ10s Gϭ , ͑ 5sϩ1 ͒͑ 2.5sϩ1 ͒ 6.1. Example 5 with the dominant time constant TϭT 0 ϭ5. Our Reconsider Example 1 proposed method produces a non-PID controller in Ke Ϫ5s Eq. ͑18͒ and the nominal performance is shown in Gϭ , Fig. 10 with the solid line. It can be seen that the ͑ s 2 ϩsϩ1 ͒͑ sϩ2 ͒ system is nominally stable. To see robustness, in- with the nominal KϭK 0 ϭ1. Our proposed troduce a 20% perturbation in T, giving Tϭ6. It method generates a non-PID controller in Eq. ͑17͒ follows from Example 2 that ␦ K ϭ0.02%р5%. and the nominal performance is shown in Fig. 9 Additionally, it can be found that ␦ G ( ) р5.75% with the solid line. It can be seen that the system is р90.37% for ͓ 0, g ͔ . Based on our analysis
- 13. Qing-Guo Wang, He Ru, and Xiao-Gang Huang / ISA Transactions 41 (2002) 37–49 49 before, one thus concludes that the resultant sys- ͓4͔ Astrom, K. J., Limitations on control system perfor- tem will remain stable, as confirmed in Fig. 9 with mance. European Journal of Control, submitted for publication. the dashed-dotted line. ͓5͔ Maciejowski, J. M., Multivariable Feedback Design. Addison-Wesley, Workingham, UK, 1989. 7. Conclusion ͓6͔ Pintelon, R., Guillaume, P., Rolain, Y., Schoukens, J., and Vanhamme, H., Parametric identification of trans- In this paper, a systematic non-PID controller fer functions in the frequency domain—a survey. design method is proposed. Simulation examples IEEE Trans. Autom. Control 39, 2245–2260 ͑1994͒. ͓7͔ Wang, Q. G., Lee, T. H., and Ho, W. F., PID tuning for show that the proposed non-PID tuning method is improved performance. IEEE Trans. Control Syst. applicable to a wide class of complex processes, Technol. 7 ͑4͒, 457– 465 ͑1999͒. such as processes with essential high-order dy- ͓8͔ Zhuang, M. and Atherton, D. P., Automatic tuning of namics, right half plane zeros, or long time delays, optimum pid controllers. IEE Proc.-D: Control Theory where the existing PID tuning methods are gener- Appl. 140 ͑3͒, 216 –224 ͑1993͒. ally unable to generate high performance. ͓9͔ I. L. Chien, IMC-PID controller design—an extension, IFAC Symp. Adaptive Control Chem. Proc., 1988, p. 155. References ͓10͔ Wood, R. K. and Berry, M. W., Terminal composition ͓1͔ Astrom, K. J., Hagglund, T., Hang, C. C., and Ho, W. control of a binary distillation column. Chem. Eng. K., Automatic tuning and adaptation for PID Sci. 28, 1707–1717 ͑1973͒. controllers—a survey. Control Eng. Pract. 1, 699–714 ͓11͔ Luyben, W. L., Simple method for tuning siso control- ͑1993͒. lers in multivariable systems. I&EC Process Des. Dev. ͓2͔ Ho, W. K., Hang, C. C., and Cao, L. S., Tuning of PID 25, 654 – 660 ͑1986͒. controllers based on gain and phase margin specifica- ͓12͔ Green, M. and Limebeer, D., Linear Robust Control. tions. Automatica 31 ͑3͒, 497–502 ͑1994͒. Prentice Hall, Englewood Cliffs, NJ, 1995. ͓3͔ Rivera, D. E., Pollard, J. F., and Garcia, C. E., ͓13͔ Doyle, J. C., Wall, J. E., and Stein, G., Performance Control-relevant prefiltering: A systematic design ap- and robustness analysis for structured uncertainty; in: proach and case study. IEEE Trans. Autom. Control 37 Proc. IEEE Conf. Decision and Control, Vol. 2, Or- ͑7͒, 964 –974 ͑1992͒. lando, FL, 1982, pp. 629– 636.