SlideShare a Scribd company logo
1 of 4
French property

                                 market report                                                                              N° 13 - OCTOBER 2011


                                                                                                        months in 3 departments: Meurthe-et-
                                                                                                        Moselle, Pyrénées- Orientales and Deux-
                              Old apartments                             Old houses
 INSEE NOTA-                                                                                            Sèvres.
 RIES INDEX                                                                                             Apartment prices, in contrast, show a rise
 (INSEE-              Index value          Variation*          Index value          Variation*          of over 10% in 8 departments: Alpes-de-
 labeled)                                                                                               Haute-Provence, Corse-du-Sud, Haute-
                      2011     2011       3                   2011       2011       3                   Corse, Indre- et-Loire, Mayenne, Nord,
                                                   1 year                                1 year
                       T1       T2      months                 T1         T2      months                Orne and Haute- Vienne. Similarly, house
 Metropolitan                                                                                           prices have risen by 10% in 15 departments
                      231.0    236,4     2,3 %     10,3 %     194,4      195,8     0,7 %        5,3 %   (Ardèche/Ardennes/Aube/Corse-du-Sud/
 France
                                                                                                        Haute-Corse/Dordogne/Jura/Haute-
 Île-de-France        246.2    254.8     3.5 %     17.3 %     188.2      190.3     1.1 %        6.5 %   Loire/Lot-et-Garonne/Morbihan/Moselle/
                                                                                                        Nièvre/Haute-Saône/Haute-Vienne/Terri-
 Provinces            217.1    219.5     1.1 %      3.8 %     196.6      197.7     0.6 %        4.9 %
                                                                                                        toire de Belfort). The price falls are occur-
* 3-month variation: development between 2011T1 and 2011T2 * year-on-year change: development           ring especially in average-sized cities, such
                                                   capital has thus reached 22.5% in Paris pro-         as -2% in Le Havre for apartments, and
                                                   per and 15.1% in its closest suburbs. In the         -9% in Bayonne for houses. There are few
                                                   provinces, however, the annual rise in prices        large falls or falls affecting large cities.
           Analysis                                is both more moderate and less contrasting
                                                   between apartments and houses. Indeed,
                                                                                                        This confirms the great variation between
                                                                                                        markets, which is not simply a matter of a
                                                   house prices actually rose by more than              contrast between Paris and the provinces.
                                                   apartment prices (4.9% compared to 3.8%).            It should be noted that the information
■ The resale market                                This trend is confirmed by the figures re-
                                                   corded in the Rhône-Alpes and PACA re-
                                                                                                        from preliminary contracts displays a com-
                                                                                                        parable level of variation.
                                                   gions, where the price gap between houses
Volumes
                                                   and apartments reached or exceeded two
At the end of June 2011, the volume of
                                                   percentage points.
sales of existing properties in France num-                                                             ■ The new-build market   
bered 812,000 in one year. This level of
growth is admittedly slower (+16% in June          In the second quarter, price stability pre-          According to the Markemetron bulle-
2011 compared with +32% in December                vailed  in  the  provinces,  for  both  houses       tin (sales outlook indicator for individual
2010), but it is nevertheless contributing         and apartments.                                      non-estate houses), the annual number
to a return to the transaction levels seen         The provincial market appears to be driven           of transactions relating to such properties
during the “best years” (2003-2007).               by a certain number of large conurbations            was 5.5% down at the end of August 2011.
In Ile-de-France, the trend is one of stabili-     such as Lille and Nantes, where prices are           This trend has accelerated, since the fall
sation (+1% in May-July on the same period         rising by around 10% each year, with little          was just 2% three months earlier. It is also
of 2010). The provinces, meanwhile, show           difference between houses and apart-                 more accentuated in the South and West.
a significant rise (+8%) in the number of          ments. In Toulouse, contrastingly, the rate          As for real estate development, sales of
properties changing hands in the second            of increase is much greater for houses.              dwellings to private individuals have re-
quarter of 2011 compared with the second           Apartment prices are falling in 17 departments       tracted by 22.6% between the second quar-
quarter of 2010.                                   (Allier/Hautes-Alpes/Calvados/Cantal/Cha-            ters of 2010 and 2011, including 21.8% in
                                                   rente-Maritime/Gard/Loir-et-Cher/Loire/              apartment blocks. New instructions have
Price                                              Lot-et-Garonne/Manche/Oise/Pas-de-Ca-                dropped by 8.6%. Twelve regions are expe-
The  increase  in  year-on-year  prices  re-       lais/Somme/Tarn-et-Garonne/Var/Vosges/               riencing a simultaneous fall in sales and
mains generally strong in the second quar-         Territoire de Belfort) and those of houses           new instructions. This has led to a mode-
ter of 2011 (7.8%), in spite of a slowdown.        in 16 departments (Aisne/Alpes-de-Haute-             rate rise (1.5%) in the number of dwellings
This is due to the price of apartments ha-         Provence/Cantal/Charente/Creuse/Drôme/               placed on sale (68,100) and the average
ving risen by 10.3% in one year and that of        Indre/Haute-Marne/Meurthe-et-Moselle/                sale period has risen from 7 to 8 and a half
houses by 5.3%. This trend is confirmed in         Orne/Hautes-Pyrénées/Pyrénées-Orien-                 months. This increase in stock applies in
recent months since, between the first and         tales/Haut-Rhin/Deux-Sèvres/Somme/                   particular to Île-de-France and the Rhône-
the second quarter, a rise of 2.1% can be          Vaucluse). Apartment prices have dropped             Alpes region. The average price per m2 of
observed in the price of apartments and of         for two consecutive quarters in 6 depart-            apartments sold in the second quarter of
0.1% in the price of houses.                       ments: Allier, Calvados, Charente- Mari-             2011 is also up 7.7%, with rises seen in Au-
Paris is displaying a price development            time, Somme, Var and Vosges.                         vergne, Brittany and Île-de-France, while
quite distinct from the rest of the country.       House prices have been displaying a                  the average price for individual houses has
The annual rise in apartment prices in the         downward trend for two consecutive                   risen by just 1.8%.
                                                                                                        French property
                                                                                                        market report
                                                                                                        NOTAIREs dE FRANCE - N° 13 - October 2011
Outlook
■ The resale market                                                   make their credit restrictions more stringent,               10.3% for all pre-owned dwellings in Ile-de-
                                                                      in spite of interest rates remaining low.                    France and 16.2% for apartments in Paris,
The recent change in the volume of                                    Secondly, there’s the reform of the taxation                 a historically high rate, compared with an
transactions reflects a slight slowdown                               of capital gains on property, due to come                    average of 8.6% in previous years.
which we announced at the start of the year                           into force on 1 February next year, which
for the second year half. However, the latest                         by doubling (to 30 years instead of 15) the                  As for the price of resale properties, the
fiscal measures concerning the imposition                             period of ownership required in order to be                  developments should remain positive on
of capital gains on property should correct                           exempt, will dissuade some owners of rental                  the currently dynamic markets which we
this trend. In addition, the volume of sales                          accommodation, second homes or property                      have already mentioned, due to a shortage
for 2011 should be equivalent or even slightly                        assets which are inherited (in two stages),                  of available stock.
above that of 2010, which was 783,000. On the                         from putting them up for sale. The same will
other hand, we are expecting a significant fall                       apply to a proportion of potential investors
in sale numbers in 2012, which could reach                            in these same assets. And finally, there is                  ■ The new-build market 
several tens of thousands of transactions,                            the customary wait-and-see approach seen
all on a market showing increasing levels                             during pre-election periods.                                 The end of the year should, as is usually
of inter-regional contrast.                                           Another trend detected since the start of 2011               the case, be more dynamic, due to a
                                                                      is likely to continue and affect the property                temporary acceleration in new-build
Three reasons are combining to create this                            market in the coming months, namely:                         sales ahead of December 31 linked to the
situation. First of all, there is the economic                        - a significant fall in the number of first-                 imminent end of the full-rate Scellier tax
and financial context. Growth forecasts                               time buyers (by which we mean buyers                         deduction scheme, and possible future tax
have been revised downwards, causing the                              aged under 30).                                              adjustments. However, the volume of sales
banks, which are already facing numerous                              - a rise in buyers aged over 60: 16% for the                 from 2010, namely 115,000, will certainly
problems (most notably the Greek crisis),                             provinces, compared with an average of 12%                   not be equalled, with a figure not exceeding
to implement strict rules (Basle III) and to                          in previous years.                                           100,000 transactions most likely.


        Average price per sq.m. of old apartments
            Development over 1 year: 1 April 2010 to 30 June 2010 / 1 April 2011 to 30 June 2011


                                                                              Dunkerque
                                                                               1 933 €                                                                 Metz
                                                                                9,4 %                                                                 1 929 €
                                                                                                                      Lille        Reims
                                                                                                                    2 856 €                            8,2 %
                                                                                                                                  2 025 €
                                                                                                                     7,1 %         3,4 %
                                                        Caen                                    Paris                                                      Nancy
                                                       2 263 €                                 8 150 €                                                    1 850 €
                             Rennes                     7,7 %                                  22,5 %                                                      6,9 %
                             2 239 €
                              6,8 %                                                                                                                      Strasbourg
                                                                                                              Orléans                                      2 444 €
                                                                                         Tours                 2 046 €        Mulhouse                     12,8 %
                                                                                        2 262 €                 5,4 %          1 207 €
                                                                                         8,9 %                                  2,6 %
                                                                                                                                                               Besançon
                                                  Nantes                                                                                                        1 763 €
                                                  2 550 €                                                                                                        5,0 %
                                                   7,7 %
                                                                                                            Saint-Étienne                     Dijon
                                                                                                               1 263 €                       2 133 €
                                                           Poitiers                                                                           2,4 %
                                                           1 515 €                                              1,0 %
   Guadeloupe                                              -0,1 %
      2 120 €                                                                                                                                         Lyon
                            Ns                                 Limoges                                                                               3 107 €
                                                               1 352 €                       Clermont-            Nîmes                              10,6 %
    La Réunion                                                  10,6 %                        Ferrand             1 775 €
      2 292 €                                                                                 1 587 €              2,0 %         Grenoble                        Nice
       3,8 %                                                                                   7,6 %                             2 422 €                       3 679 €
                                                       Bordeaux
                                                        2 738 €                                                                   4,5 %                         8,4 %
                                                         9,5 %
                                                                                                                                                                   Toulon
                                                                                                                                                                   2 324 €
   Annual change in price                                                                                                                                           4,7 %
   per sq.m.                                    Bayonne
                                                2 667 €                         Toulouse
        Less than 0 %                            12,8 %                          2 464 €                                                                                 Haute-Corse
                                                                                  4,9 %                   Montpellier          Marseille                                    2 352 €
        From 0 % to 5 %                                                                                    2 527 €             2 538 €                                        12,6 %
        5 % plus                                                                                            5,1 %               5,7 %
   ns = not significant (the volume of sales does not permit the calculation of suitable statistics)
   Source: Notaires de France property database (the prices in Île-de-France are an evaluation of                                                                   Corse-du-Sud
   the INSEE notaries index for the 2nd quarter of 2011). Outside Île-de-France, the prices have been                                                                  2 924 €
   calculated based on an average volume of 150 transactions per city and per quarter
                                                                                                                                  French property
                                                                                                                                  market report
                                                                                                                                  NOTAIREs dE FRANCE - N° 13 - October 2011
Average sale price of older houses
          Development over 1 year: 1 April 2010 to 30 June 2010 / 1 April 2011 to 30 June 2011
                                                                                            Amiens                           Lille
                                                                         Rouen             156 000 €                       179 000 €
                                                                       180 000 €             6,1 %                           8,5 %
                                                                                                                                               Reims
                                                   Le Havre             10,4 %                                                               200 000 €
                                                   182 200 €                                                                                  -5,2 %
                                                     4,5 %
                                                                                                                                                                   Metz
                                                                                                        Île-de-France                                            180 500 €
                                                    Caen                                                  304 700 €                                                2,6 %
                        Brest                     232 700 €
                      188 000 €                                                                              6,5 %
                                                                                       Chartres                                                                 Nancy
                        19,0%                                                          189 500 €                                                              170 800 €
                                                                                        -3,8 %                                                                  0,5 %
                                                                      Tours                                                         Troyes
                                                                    190 000 €                                                      156 900 €
                                                                      0,0 %                                                         14,2 %
                                                                                                                   Orléans
                                                Nantes                                                            202 200 €
                                               240 000 €                                                            0,6 %
                                                 9,1 %
                                                                                                                                                    Dijon
                                                                                                                        Saint-Étienne             227 000 €
                                                         Poitiers                                     Chateauroux        182 000 €
                                                                                                       113 000 €                                    2,9 %
                                                        158 000 €                                                           1,1 %
                                                         -1,3 %                                          9,2 %
                                                                                                                                                                   Lyon
                         Ns                                                                                                                                      296 000 €
                                                                                                      Limoges                                                      7,6 %
La Réunion                                                                                           145 000 €
240 000 €                                                                                              2,1 %
   0,2%                                                                                                                              Grenoble
                                                                                                                                    305 000 €
                                                                                                         Nîmes                        -0,5 %
                                                         Bordeaux             Montauban                 194 000 €
                                                         246 900 €            159 000 €                  -3,0 %
Annual change                                             10,2 %               -0,6 %                                                                                   Toulon
in sale prices                                                                                                                                                         340 000 €
                                                                                                                                                                         6,3 %
    Less than 0 %
    From 0 % to 10 %                                                        Toulouse
                                                                            265 000 €                  Montpellier             Marseille /                                Haute-Corse
    10 % plus                                                                 8,4 %                    303 500 €            Aix-en-Provence                                220 000 €
                                                                                                         6,1 %                 318 500 €                                    18,9 %
ns = not significant (the volume of sales does not permit the calculation of suitable statistics)                                9,8 %
Source: Notaires de France property database (the prices in Île-de-France are an evaluation of
the INSEE notaries index for the 2nd quarter of 2011). Outside Île-de-France, the prices have been                                                               Corse-du-Sud
calculated based on an average volume of 150 transactions per city and per quarter                                                                                300 000 €
                                                                                                                                                                    20,0 %


      Price per sq.m. of new property in 2nd quarter of 2011 (apartments)
                                                                                                                           Nord-Pas-
                                                                                     Picardie                              de-Calais
                                                                                     3 307 €                                3 094 €            Champagne-
                                                   Haute-Normandie                    7,8 %                                 -2,8 %              Ardennes
                                                       3 023 €                                                                                   3 088 €
                                                        3,5 %                                                                                     5,3 %

                                                                                                                                                                Lorraine
                                                Basse-Normandie                                                                                                 2 809 €
                                                    3 472 €                                                                                                      9,0 %
                          Bretagne                   3,2 %
                           3 178 €
                           11,0 %                                                                                                                              Alsace
                                                                                                                   Île-de-France                               3 019 €
                                                                                                                       5 031 €                                  7,8 %
                                                                                                                        8,8 %
                                              Pays-de-                                                                                                          Franche-Comté
                                              la-Loire                                                                                                              2 730 €
                                               3 456 €                                                                                                               0,5 %
                                                7,6 %                                                 Centre
                                                                                                      3 043 €                                   Bourgogne
                                                                                                       0,5 %                                     2 653 €
                                           Poitou-Charentes                                                                                       -8,2 %
                                                3 574 €
                                                 7,4 %
                                                                                                                                                         Rhône-Alpes
                        Ns                                                                                                                                 3 728 €
                                                                Limousin                                                                                    8,3 %
                                                                 2 666 €                                        Auvergne
                                                                  4,5 %                                          3 071 €
                                                                                                                 17,4 %
                                                        Aquitaine
                                                         3 441 €                                                                                                PACA
                                                          7,1 %                                                                                                4 176 €
                                                                                                                                                                4,6 %

Price development per sq.m. 
     Less than 0 %                                                          Midi-Pyrénées
                                                                                                                                                                        Corse
                                                                                                                                                                       3 269 €
     From 0 % to 5 %                                                           3 389 €                    Languedoc-                                                    2,0 %
                                                                                8,0 %                      Roussillon
     5 % plus                                                                                               3 280 €
ns = not significant (sales volumes                                                                         -0,4 %
do not permit the calculation
of suitable statistics)
Source: FPI / ECLN / CGDD / SOeS
                                                                                                                                       French property
                                                                                                                                      market report
                                                                                                                                      NOTAIREs dE FRANCE - N° 13 - October 2011
Housing indices
   France: the property price index for
France as a whole is calculated by the
                                                                            International comparison:
Notaires de France in partnership with                                    property price index compared
the INSEE. This index is published every                             to the income available per household
three months and uses the hedonic pri-                                            Base 2000=1
cing method. The data result from sale
                                                                                   France
documents transmitted by the notaries.                                             United States
                                                                                   United Kingdom
   United states: the FHFA index produced
by the Federal Housing Finance Agency,
a US government body, measures the
development of the price of individual
houses based on a sample of mortgage
loans, using the repeated sales method.
   United Kingdom: the DCLG index is
the official house price index published
by the British government, based on a
sample of mortgage loans. It uses the
hedonic pricing method.
                                                   Source: CGEDD according to INSEE, notarial databases, deseasonalized INSEE Notaries Indices, Freddie Mac, FHFA, R.Shiller, US Bureau of Economic
                                                   Analysis, Census Bureau, Bureau of Labor Statistics, UK DCLG, UK National Statistics
                                                   Graphic downloadable at: http://www.cgedd.developpement-durable.gouv.fr/rubrique.php3?id_rubrique=138.


The residential property market in Ile-de-France and Paris in
the 2nd quarter of 2011


        All the analyses and press conference pack can be found on the Notaires de France property portal 
        accessible at http://www.notaires.fr 

Contact: Olivier Pavy, Director of Economic Affairs – High Council for the Notarial Profession. Editorial Committee: Pierre Bazaille, Thierry Delesalle,
Michel Pagès and Olivier Pavy. Published by: Conseil supérieur du notariat - 60 bd de La Tour-Maubourg - 75007 Paris - Tél. +33 (0)1 44 90 30 00
www.notaires.fr. design and creation: Bureau de Création - ISSN : 2100-241X
                                                                                                                                            French property
                                                                                                                                            market report
                                                                                                                                            NOTAIREs dE FRANCE - N° 13 - October 2011

More Related Content

Recently uploaded

(Best) ENJOY Call Girls in Faridabad Ex | 8377087607
(Best) ENJOY Call Girls in Faridabad Ex | 8377087607(Best) ENJOY Call Girls in Faridabad Ex | 8377087607
(Best) ENJOY Call Girls in Faridabad Ex | 8377087607dollysharma2066
 
Memorándum de Entendimiento (MoU) entre Codelco y SQM
Memorándum de Entendimiento (MoU) entre Codelco y SQMMemorándum de Entendimiento (MoU) entre Codelco y SQM
Memorándum de Entendimiento (MoU) entre Codelco y SQMVoces Mineras
 
Ten Organizational Design Models to align structure and operations to busines...
Ten Organizational Design Models to align structure and operations to busines...Ten Organizational Design Models to align structure and operations to busines...
Ten Organizational Design Models to align structure and operations to busines...Seta Wicaksana
 
Pitch Deck Teardown: Geodesic.Life's $500k Pre-seed deck
Pitch Deck Teardown: Geodesic.Life's $500k Pre-seed deckPitch Deck Teardown: Geodesic.Life's $500k Pre-seed deck
Pitch Deck Teardown: Geodesic.Life's $500k Pre-seed deckHajeJanKamps
 
Financial-Statement-Analysis-of-Coca-cola-Company.pptx
Financial-Statement-Analysis-of-Coca-cola-Company.pptxFinancial-Statement-Analysis-of-Coca-cola-Company.pptx
Financial-Statement-Analysis-of-Coca-cola-Company.pptxsaniyaimamuddin
 
MAHA Global and IPR: Do Actions Speak Louder Than Words?
MAHA Global and IPR: Do Actions Speak Louder Than Words?MAHA Global and IPR: Do Actions Speak Louder Than Words?
MAHA Global and IPR: Do Actions Speak Louder Than Words?Olivia Kresic
 
TriStar Gold Corporate Presentation - April 2024
TriStar Gold Corporate Presentation - April 2024TriStar Gold Corporate Presentation - April 2024
TriStar Gold Corporate Presentation - April 2024Adnet Communications
 
Unlocking the Future: Explore Web 3.0 Workshop to Start Earning Today!
Unlocking the Future: Explore Web 3.0 Workshop to Start Earning Today!Unlocking the Future: Explore Web 3.0 Workshop to Start Earning Today!
Unlocking the Future: Explore Web 3.0 Workshop to Start Earning Today!Doge Mining Website
 
FULL ENJOY Call girls in Paharganj Delhi | 8377087607
FULL ENJOY Call girls in Paharganj Delhi | 8377087607FULL ENJOY Call girls in Paharganj Delhi | 8377087607
FULL ENJOY Call girls in Paharganj Delhi | 8377087607dollysharma2066
 
Market Sizes Sample Report - 2024 Edition
Market Sizes Sample Report - 2024 EditionMarket Sizes Sample Report - 2024 Edition
Market Sizes Sample Report - 2024 EditionMintel Group
 
8447779800, Low rate Call girls in Tughlakabad Delhi NCR
8447779800, Low rate Call girls in Tughlakabad Delhi NCR8447779800, Low rate Call girls in Tughlakabad Delhi NCR
8447779800, Low rate Call girls in Tughlakabad Delhi NCRashishs7044
 
8447779800, Low rate Call girls in Uttam Nagar Delhi NCR
8447779800, Low rate Call girls in Uttam Nagar Delhi NCR8447779800, Low rate Call girls in Uttam Nagar Delhi NCR
8447779800, Low rate Call girls in Uttam Nagar Delhi NCRashishs7044
 
Buy gmail accounts.pdf Buy Old Gmail Accounts
Buy gmail accounts.pdf Buy Old Gmail AccountsBuy gmail accounts.pdf Buy Old Gmail Accounts
Buy gmail accounts.pdf Buy Old Gmail AccountsBuy Verified Accounts
 
Entrepreneurship lessons in Philippines
Entrepreneurship lessons in  PhilippinesEntrepreneurship lessons in  Philippines
Entrepreneurship lessons in PhilippinesDavidSamuel525586
 
Chapter 9 PPT 4th edition.pdf internal audit
Chapter 9 PPT 4th edition.pdf internal auditChapter 9 PPT 4th edition.pdf internal audit
Chapter 9 PPT 4th edition.pdf internal auditNhtLNguyn9
 
The-Ethical-issues-ghhhhhhhhjof-Byjus.pptx
The-Ethical-issues-ghhhhhhhhjof-Byjus.pptxThe-Ethical-issues-ghhhhhhhhjof-Byjus.pptx
The-Ethical-issues-ghhhhhhhhjof-Byjus.pptxmbikashkanyari
 
Organizational Structure Running A Successful Business
Organizational Structure Running A Successful BusinessOrganizational Structure Running A Successful Business
Organizational Structure Running A Successful BusinessSeta Wicaksana
 
APRIL2024_UKRAINE_xml_0000000000000 .pdf
APRIL2024_UKRAINE_xml_0000000000000 .pdfAPRIL2024_UKRAINE_xml_0000000000000 .pdf
APRIL2024_UKRAINE_xml_0000000000000 .pdfRbc Rbcua
 
Cybersecurity Awareness Training Presentation v2024.03
Cybersecurity Awareness Training Presentation v2024.03Cybersecurity Awareness Training Presentation v2024.03
Cybersecurity Awareness Training Presentation v2024.03DallasHaselhorst
 
Flow Your Strategy at Flight Levels Day 2024
Flow Your Strategy at Flight Levels Day 2024Flow Your Strategy at Flight Levels Day 2024
Flow Your Strategy at Flight Levels Day 2024Kirill Klimov
 

Recently uploaded (20)

(Best) ENJOY Call Girls in Faridabad Ex | 8377087607
(Best) ENJOY Call Girls in Faridabad Ex | 8377087607(Best) ENJOY Call Girls in Faridabad Ex | 8377087607
(Best) ENJOY Call Girls in Faridabad Ex | 8377087607
 
Memorándum de Entendimiento (MoU) entre Codelco y SQM
Memorándum de Entendimiento (MoU) entre Codelco y SQMMemorándum de Entendimiento (MoU) entre Codelco y SQM
Memorándum de Entendimiento (MoU) entre Codelco y SQM
 
Ten Organizational Design Models to align structure and operations to busines...
Ten Organizational Design Models to align structure and operations to busines...Ten Organizational Design Models to align structure and operations to busines...
Ten Organizational Design Models to align structure and operations to busines...
 
Pitch Deck Teardown: Geodesic.Life's $500k Pre-seed deck
Pitch Deck Teardown: Geodesic.Life's $500k Pre-seed deckPitch Deck Teardown: Geodesic.Life's $500k Pre-seed deck
Pitch Deck Teardown: Geodesic.Life's $500k Pre-seed deck
 
Financial-Statement-Analysis-of-Coca-cola-Company.pptx
Financial-Statement-Analysis-of-Coca-cola-Company.pptxFinancial-Statement-Analysis-of-Coca-cola-Company.pptx
Financial-Statement-Analysis-of-Coca-cola-Company.pptx
 
MAHA Global and IPR: Do Actions Speak Louder Than Words?
MAHA Global and IPR: Do Actions Speak Louder Than Words?MAHA Global and IPR: Do Actions Speak Louder Than Words?
MAHA Global and IPR: Do Actions Speak Louder Than Words?
 
TriStar Gold Corporate Presentation - April 2024
TriStar Gold Corporate Presentation - April 2024TriStar Gold Corporate Presentation - April 2024
TriStar Gold Corporate Presentation - April 2024
 
Unlocking the Future: Explore Web 3.0 Workshop to Start Earning Today!
Unlocking the Future: Explore Web 3.0 Workshop to Start Earning Today!Unlocking the Future: Explore Web 3.0 Workshop to Start Earning Today!
Unlocking the Future: Explore Web 3.0 Workshop to Start Earning Today!
 
FULL ENJOY Call girls in Paharganj Delhi | 8377087607
FULL ENJOY Call girls in Paharganj Delhi | 8377087607FULL ENJOY Call girls in Paharganj Delhi | 8377087607
FULL ENJOY Call girls in Paharganj Delhi | 8377087607
 
Market Sizes Sample Report - 2024 Edition
Market Sizes Sample Report - 2024 EditionMarket Sizes Sample Report - 2024 Edition
Market Sizes Sample Report - 2024 Edition
 
8447779800, Low rate Call girls in Tughlakabad Delhi NCR
8447779800, Low rate Call girls in Tughlakabad Delhi NCR8447779800, Low rate Call girls in Tughlakabad Delhi NCR
8447779800, Low rate Call girls in Tughlakabad Delhi NCR
 
8447779800, Low rate Call girls in Uttam Nagar Delhi NCR
8447779800, Low rate Call girls in Uttam Nagar Delhi NCR8447779800, Low rate Call girls in Uttam Nagar Delhi NCR
8447779800, Low rate Call girls in Uttam Nagar Delhi NCR
 
Buy gmail accounts.pdf Buy Old Gmail Accounts
Buy gmail accounts.pdf Buy Old Gmail AccountsBuy gmail accounts.pdf Buy Old Gmail Accounts
Buy gmail accounts.pdf Buy Old Gmail Accounts
 
Entrepreneurship lessons in Philippines
Entrepreneurship lessons in  PhilippinesEntrepreneurship lessons in  Philippines
Entrepreneurship lessons in Philippines
 
Chapter 9 PPT 4th edition.pdf internal audit
Chapter 9 PPT 4th edition.pdf internal auditChapter 9 PPT 4th edition.pdf internal audit
Chapter 9 PPT 4th edition.pdf internal audit
 
The-Ethical-issues-ghhhhhhhhjof-Byjus.pptx
The-Ethical-issues-ghhhhhhhhjof-Byjus.pptxThe-Ethical-issues-ghhhhhhhhjof-Byjus.pptx
The-Ethical-issues-ghhhhhhhhjof-Byjus.pptx
 
Organizational Structure Running A Successful Business
Organizational Structure Running A Successful BusinessOrganizational Structure Running A Successful Business
Organizational Structure Running A Successful Business
 
APRIL2024_UKRAINE_xml_0000000000000 .pdf
APRIL2024_UKRAINE_xml_0000000000000 .pdfAPRIL2024_UKRAINE_xml_0000000000000 .pdf
APRIL2024_UKRAINE_xml_0000000000000 .pdf
 
Cybersecurity Awareness Training Presentation v2024.03
Cybersecurity Awareness Training Presentation v2024.03Cybersecurity Awareness Training Presentation v2024.03
Cybersecurity Awareness Training Presentation v2024.03
 
Flow Your Strategy at Flight Levels Day 2024
Flow Your Strategy at Flight Levels Day 2024Flow Your Strategy at Flight Levels Day 2024
Flow Your Strategy at Flight Levels Day 2024
 

Featured

2024 State of Marketing Report – by Hubspot
2024 State of Marketing Report – by Hubspot2024 State of Marketing Report – by Hubspot
2024 State of Marketing Report – by HubspotMarius Sescu
 
Everything You Need To Know About ChatGPT
Everything You Need To Know About ChatGPTEverything You Need To Know About ChatGPT
Everything You Need To Know About ChatGPTExpeed Software
 
Product Design Trends in 2024 | Teenage Engineerings
Product Design Trends in 2024 | Teenage EngineeringsProduct Design Trends in 2024 | Teenage Engineerings
Product Design Trends in 2024 | Teenage EngineeringsPixeldarts
 
How Race, Age and Gender Shape Attitudes Towards Mental Health
How Race, Age and Gender Shape Attitudes Towards Mental HealthHow Race, Age and Gender Shape Attitudes Towards Mental Health
How Race, Age and Gender Shape Attitudes Towards Mental HealthThinkNow
 
AI Trends in Creative Operations 2024 by Artwork Flow.pdf
AI Trends in Creative Operations 2024 by Artwork Flow.pdfAI Trends in Creative Operations 2024 by Artwork Flow.pdf
AI Trends in Creative Operations 2024 by Artwork Flow.pdfmarketingartwork
 
PEPSICO Presentation to CAGNY Conference Feb 2024
PEPSICO Presentation to CAGNY Conference Feb 2024PEPSICO Presentation to CAGNY Conference Feb 2024
PEPSICO Presentation to CAGNY Conference Feb 2024Neil Kimberley
 
Content Methodology: A Best Practices Report (Webinar)
Content Methodology: A Best Practices Report (Webinar)Content Methodology: A Best Practices Report (Webinar)
Content Methodology: A Best Practices Report (Webinar)contently
 
How to Prepare For a Successful Job Search for 2024
How to Prepare For a Successful Job Search for 2024How to Prepare For a Successful Job Search for 2024
How to Prepare For a Successful Job Search for 2024Albert Qian
 
Social Media Marketing Trends 2024 // The Global Indie Insights
Social Media Marketing Trends 2024 // The Global Indie InsightsSocial Media Marketing Trends 2024 // The Global Indie Insights
Social Media Marketing Trends 2024 // The Global Indie InsightsKurio // The Social Media Age(ncy)
 
Trends In Paid Search: Navigating The Digital Landscape In 2024
Trends In Paid Search: Navigating The Digital Landscape In 2024Trends In Paid Search: Navigating The Digital Landscape In 2024
Trends In Paid Search: Navigating The Digital Landscape In 2024Search Engine Journal
 
5 Public speaking tips from TED - Visualized summary
5 Public speaking tips from TED - Visualized summary5 Public speaking tips from TED - Visualized summary
5 Public speaking tips from TED - Visualized summarySpeakerHub
 
ChatGPT and the Future of Work - Clark Boyd
ChatGPT and the Future of Work - Clark Boyd ChatGPT and the Future of Work - Clark Boyd
ChatGPT and the Future of Work - Clark Boyd Clark Boyd
 
Getting into the tech field. what next
Getting into the tech field. what next Getting into the tech field. what next
Getting into the tech field. what next Tessa Mero
 
Google's Just Not That Into You: Understanding Core Updates & Search Intent
Google's Just Not That Into You: Understanding Core Updates & Search IntentGoogle's Just Not That Into You: Understanding Core Updates & Search Intent
Google's Just Not That Into You: Understanding Core Updates & Search IntentLily Ray
 
Time Management & Productivity - Best Practices
Time Management & Productivity -  Best PracticesTime Management & Productivity -  Best Practices
Time Management & Productivity - Best PracticesVit Horky
 
The six step guide to practical project management
The six step guide to practical project managementThe six step guide to practical project management
The six step guide to practical project managementMindGenius
 
Beginners Guide to TikTok for Search - Rachel Pearson - We are Tilt __ Bright...
Beginners Guide to TikTok for Search - Rachel Pearson - We are Tilt __ Bright...Beginners Guide to TikTok for Search - Rachel Pearson - We are Tilt __ Bright...
Beginners Guide to TikTok for Search - Rachel Pearson - We are Tilt __ Bright...RachelPearson36
 

Featured (20)

2024 State of Marketing Report – by Hubspot
2024 State of Marketing Report – by Hubspot2024 State of Marketing Report – by Hubspot
2024 State of Marketing Report – by Hubspot
 
Everything You Need To Know About ChatGPT
Everything You Need To Know About ChatGPTEverything You Need To Know About ChatGPT
Everything You Need To Know About ChatGPT
 
Product Design Trends in 2024 | Teenage Engineerings
Product Design Trends in 2024 | Teenage EngineeringsProduct Design Trends in 2024 | Teenage Engineerings
Product Design Trends in 2024 | Teenage Engineerings
 
How Race, Age and Gender Shape Attitudes Towards Mental Health
How Race, Age and Gender Shape Attitudes Towards Mental HealthHow Race, Age and Gender Shape Attitudes Towards Mental Health
How Race, Age and Gender Shape Attitudes Towards Mental Health
 
AI Trends in Creative Operations 2024 by Artwork Flow.pdf
AI Trends in Creative Operations 2024 by Artwork Flow.pdfAI Trends in Creative Operations 2024 by Artwork Flow.pdf
AI Trends in Creative Operations 2024 by Artwork Flow.pdf
 
Skeleton Culture Code
Skeleton Culture CodeSkeleton Culture Code
Skeleton Culture Code
 
PEPSICO Presentation to CAGNY Conference Feb 2024
PEPSICO Presentation to CAGNY Conference Feb 2024PEPSICO Presentation to CAGNY Conference Feb 2024
PEPSICO Presentation to CAGNY Conference Feb 2024
 
Content Methodology: A Best Practices Report (Webinar)
Content Methodology: A Best Practices Report (Webinar)Content Methodology: A Best Practices Report (Webinar)
Content Methodology: A Best Practices Report (Webinar)
 
How to Prepare For a Successful Job Search for 2024
How to Prepare For a Successful Job Search for 2024How to Prepare For a Successful Job Search for 2024
How to Prepare For a Successful Job Search for 2024
 
Social Media Marketing Trends 2024 // The Global Indie Insights
Social Media Marketing Trends 2024 // The Global Indie InsightsSocial Media Marketing Trends 2024 // The Global Indie Insights
Social Media Marketing Trends 2024 // The Global Indie Insights
 
Trends In Paid Search: Navigating The Digital Landscape In 2024
Trends In Paid Search: Navigating The Digital Landscape In 2024Trends In Paid Search: Navigating The Digital Landscape In 2024
Trends In Paid Search: Navigating The Digital Landscape In 2024
 
5 Public speaking tips from TED - Visualized summary
5 Public speaking tips from TED - Visualized summary5 Public speaking tips from TED - Visualized summary
5 Public speaking tips from TED - Visualized summary
 
ChatGPT and the Future of Work - Clark Boyd
ChatGPT and the Future of Work - Clark Boyd ChatGPT and the Future of Work - Clark Boyd
ChatGPT and the Future of Work - Clark Boyd
 
Getting into the tech field. what next
Getting into the tech field. what next Getting into the tech field. what next
Getting into the tech field. what next
 
Google's Just Not That Into You: Understanding Core Updates & Search Intent
Google's Just Not That Into You: Understanding Core Updates & Search IntentGoogle's Just Not That Into You: Understanding Core Updates & Search Intent
Google's Just Not That Into You: Understanding Core Updates & Search Intent
 
How to have difficult conversations
How to have difficult conversations How to have difficult conversations
How to have difficult conversations
 
Introduction to Data Science
Introduction to Data ScienceIntroduction to Data Science
Introduction to Data Science
 
Time Management & Productivity - Best Practices
Time Management & Productivity -  Best PracticesTime Management & Productivity -  Best Practices
Time Management & Productivity - Best Practices
 
The six step guide to practical project management
The six step guide to practical project managementThe six step guide to practical project management
The six step guide to practical project management
 
Beginners Guide to TikTok for Search - Rachel Pearson - We are Tilt __ Bright...
Beginners Guide to TikTok for Search - Rachel Pearson - We are Tilt __ Bright...Beginners Guide to TikTok for Search - Rachel Pearson - We are Tilt __ Bright...
Beginners Guide to TikTok for Search - Rachel Pearson - We are Tilt __ Bright...
 

French property market analysis 2011 october

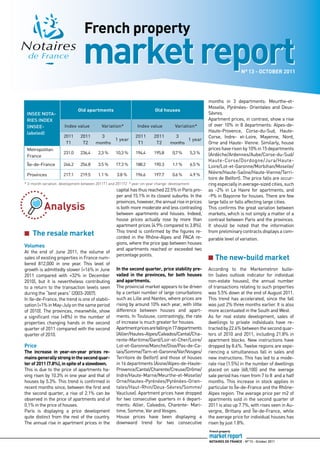
  • 1. French property market report N° 13 - OCTOBER 2011 months in 3 departments: Meurthe-et- Moselle, Pyrénées- Orientales and Deux- Old apartments Old houses INSEE NOTA- Sèvres. RIES INDEX Apartment prices, in contrast, show a rise (INSEE- Index value Variation* Index value Variation* of over 10% in 8 departments: Alpes-de- labeled) Haute-Provence, Corse-du-Sud, Haute- 2011 2011 3 2011 2011 3 Corse, Indre- et-Loire, Mayenne, Nord, 1 year 1 year T1 T2 months T1 T2 months Orne and Haute- Vienne. Similarly, house Metropolitan prices have risen by 10% in 15 departments 231.0 236,4 2,3 % 10,3 % 194,4 195,8 0,7 % 5,3 % (Ardèche/Ardennes/Aube/Corse-du-Sud/ France Haute-Corse/Dordogne/Jura/Haute- Île-de-France 246.2 254.8 3.5 % 17.3 % 188.2 190.3 1.1 % 6.5 % Loire/Lot-et-Garonne/Morbihan/Moselle/ Nièvre/Haute-Saône/Haute-Vienne/Terri- Provinces 217.1 219.5 1.1 % 3.8 % 196.6 197.7 0.6 % 4.9 % toire de Belfort). The price falls are occur- * 3-month variation: development between 2011T1 and 2011T2 * year-on-year change: development ring especially in average-sized cities, such capital has thus reached 22.5% in Paris pro- as -2% in Le Havre for apartments, and per and 15.1% in its closest suburbs. In the -9% in Bayonne for houses. There are few provinces, however, the annual rise in prices large falls or falls affecting large cities. Analysis is both more moderate and less contrasting between apartments and houses. Indeed, This confirms the great variation between markets, which is not simply a matter of a house prices actually rose by more than contrast between Paris and the provinces. apartment prices (4.9% compared to 3.8%). It should be noted that the information ■ The resale market    This trend is confirmed by the figures re- corded in the Rhône-Alpes and PACA re- from preliminary contracts displays a com- parable level of variation. gions, where the price gap between houses Volumes and apartments reached or exceeded two At the end of June 2011, the volume of percentage points. sales of existing properties in France num- ■ The new-build market    bered 812,000 in one year. This level of growth is admittedly slower (+16% in June In the second quarter, price stability pre- According to the Markemetron bulle- 2011 compared with +32% in December vailed  in  the  provinces,  for  both  houses  tin (sales outlook indicator for individual 2010), but it is nevertheless contributing and apartments. non-estate houses), the annual number to a return to the transaction levels seen The provincial market appears to be driven of transactions relating to such properties during the “best years” (2003-2007). by a certain number of large conurbations was 5.5% down at the end of August 2011. In Ile-de-France, the trend is one of stabili- such as Lille and Nantes, where prices are This trend has accelerated, since the fall sation (+1% in May-July on the same period rising by around 10% each year, with little was just 2% three months earlier. It is also of 2010). The provinces, meanwhile, show difference between houses and apart- more accentuated in the South and West. a significant rise (+8%) in the number of ments. In Toulouse, contrastingly, the rate As for real estate development, sales of properties changing hands in the second of increase is much greater for houses. dwellings to private individuals have re- quarter of 2011 compared with the second Apartment prices are falling in 17 departments tracted by 22.6% between the second quar- quarter of 2010. (Allier/Hautes-Alpes/Calvados/Cantal/Cha- ters of 2010 and 2011, including 21.8% in rente-Maritime/Gard/Loir-et-Cher/Loire/ apartment blocks. New instructions have Price Lot-et-Garonne/Manche/Oise/Pas-de-Ca- dropped by 8.6%. Twelve regions are expe- The  increase  in  year-on-year  prices  re- lais/Somme/Tarn-et-Garonne/Var/Vosges/ riencing a simultaneous fall in sales and mains generally strong in the second quar- Territoire de Belfort) and those of houses new instructions. This has led to a mode- ter of 2011 (7.8%), in spite of a slowdown. in 16 departments (Aisne/Alpes-de-Haute- rate rise (1.5%) in the number of dwellings This is due to the price of apartments ha- Provence/Cantal/Charente/Creuse/Drôme/ placed on sale (68,100) and the average ving risen by 10.3% in one year and that of Indre/Haute-Marne/Meurthe-et-Moselle/ sale period has risen from 7 to 8 and a half houses by 5.3%. This trend is confirmed in Orne/Hautes-Pyrénées/Pyrénées-Orien- months. This increase in stock applies in recent months since, between the first and tales/Haut-Rhin/Deux-Sèvres/Somme/ particular to Île-de-France and the Rhône- the second quarter, a rise of 2.1% can be Vaucluse). Apartment prices have dropped Alpes region. The average price per m2 of observed in the price of apartments and of for two consecutive quarters in 6 depart- apartments sold in the second quarter of 0.1% in the price of houses. ments: Allier, Calvados, Charente- Mari- 2011 is also up 7.7%, with rises seen in Au- Paris is displaying a price development time, Somme, Var and Vosges. vergne, Brittany and Île-de-France, while quite distinct from the rest of the country. House prices have been displaying a the average price for individual houses has The annual rise in apartment prices in the downward trend for two consecutive risen by just 1.8%. French property market report NOTAIREs dE FRANCE - N° 13 - October 2011
  • 2. Outlook ■ The resale market make their credit restrictions more stringent, 10.3% for all pre-owned dwellings in Ile-de- in spite of interest rates remaining low. France and 16.2% for apartments in Paris, The recent change in the volume of Secondly, there’s the reform of the taxation a historically high rate, compared with an transactions reflects a slight slowdown of capital gains on property, due to come average of 8.6% in previous years. which we announced at the start of the year into force on 1 February next year, which for the second year half. However, the latest by doubling (to 30 years instead of 15) the As for the price of resale properties, the fiscal measures concerning the imposition period of ownership required in order to be developments should remain positive on of capital gains on property should correct exempt, will dissuade some owners of rental the currently dynamic markets which we this trend. In addition, the volume of sales accommodation, second homes or property have already mentioned, due to a shortage for 2011 should be equivalent or even slightly assets which are inherited (in two stages), of available stock. above that of 2010, which was 783,000. On the from putting them up for sale. The same will other hand, we are expecting a significant fall apply to a proportion of potential investors in sale numbers in 2012, which could reach in these same assets. And finally, there is ■ The new-build market  several tens of thousands of transactions, the customary wait-and-see approach seen all on a market showing increasing levels during pre-election periods. The end of the year should, as is usually of inter-regional contrast. Another trend detected since the start of 2011 the case, be more dynamic, due to a is likely to continue and affect the property temporary acceleration in new-build Three reasons are combining to create this market in the coming months, namely: sales ahead of December 31 linked to the situation. First of all, there is the economic - a significant fall in the number of first- imminent end of the full-rate Scellier tax and financial context. Growth forecasts time buyers (by which we mean buyers deduction scheme, and possible future tax have been revised downwards, causing the aged under 30). adjustments. However, the volume of sales banks, which are already facing numerous - a rise in buyers aged over 60: 16% for the from 2010, namely 115,000, will certainly problems (most notably the Greek crisis), provinces, compared with an average of 12% not be equalled, with a figure not exceeding to implement strict rules (Basle III) and to in previous years. 100,000 transactions most likely. Average price per sq.m. of old apartments Development over 1 year: 1 April 2010 to 30 June 2010 / 1 April 2011 to 30 June 2011 Dunkerque 1 933 € Metz 9,4 % 1 929 € Lille Reims 2 856 € 8,2 % 2 025 € 7,1 % 3,4 % Caen Paris Nancy 2 263 €  8 150 €  1 850 € Rennes 7,7 % 22,5 % 6,9 % 2 239 € 6,8 % Strasbourg Orléans 2 444 € Tours  2 046 €  Mulhouse 12,8 %  2 262 € 5,4 % 1 207 € 8,9 % 2,6 % Besançon Nantes 1 763 € 2 550 € 5,0 % 7,7 % Saint-Étienne Dijon  1 263 € 2 133 € Poitiers 2,4 % 1 515 € 1,0 % Guadeloupe -0,1 %   2 120 € Lyon Ns Limoges  3 107 € 1 352 €  Clermont- Nîmes 10,6 % La Réunion 10,6 %  Ferrand  1 775 €  2 292 € 1 587 € 2,0 % Grenoble Nice 3,8 % 7,6 % 2 422 € 3 679 € Bordeaux 2 738 € 4,5 % 8,4 % 9,5 % Toulon  2 324 € Annual change in price  4,7 % per sq.m. Bayonne 2 667 € Toulouse  Less than 0 % 12,8 % 2 464 € Haute-Corse 4,9 % Montpellier Marseille  2 352 €  From 0 % to 5 % 2 527 € 2 538 €    12,6 %  5 % plus 5,1 % 5,7 % ns = not significant (the volume of sales does not permit the calculation of suitable statistics) Source: Notaires de France property database (the prices in Île-de-France are an evaluation of Corse-du-Sud the INSEE notaries index for the 2nd quarter of 2011). Outside Île-de-France, the prices have been  2 924 € calculated based on an average volume of 150 transactions per city and per quarter French property market report NOTAIREs dE FRANCE - N° 13 - October 2011
  • 3. Average sale price of older houses Development over 1 year: 1 April 2010 to 30 June 2010 / 1 April 2011 to 30 June 2011 Amiens Lille Rouen 156 000 € 179 000 € 180 000 € 6,1 % 8,5 % Reims Le Havre 10,4 % 200 000 € 182 200 € -5,2 % 4,5 % Metz Île-de-France 180 500 € Caen 304 700 € 2,6 % Brest 232 700 € 188 000 € 6,5 % Chartres Nancy 19,0%  189 500 € 170 800 € -3,8 % 0,5 % Tours Troyes  190 000 € 156 900 € 0,0 % 14,2 % Orléans Nantes 202 200 € 240 000 € 0,6 % 9,1 % Dijon Saint-Étienne 227 000 € Poitiers Chateauroux 182 000 € 113 000 € 2,9 % 158 000 € 1,1 % -1,3 % 9,2 % Lyon Ns 296 000 € Limoges 7,6 % La Réunion 145 000 € 240 000 € 2,1 % 0,2% Grenoble 305 000 € Nîmes -0,5 % Bordeaux Montauban 194 000 € 246 900 € 159 000 € -3,0 % Annual change 10,2 % -0,6 % Toulon in sale prices 340 000 € 6,3 %  Less than 0 %  From 0 % to 10 % Toulouse 265 000 € Montpellier Marseille / Haute-Corse  10 % plus 8,4 % 303 500 € Aix-en-Provence 220 000 € 6,1 % 318 500 € 18,9 % ns = not significant (the volume of sales does not permit the calculation of suitable statistics) 9,8 % Source: Notaires de France property database (the prices in Île-de-France are an evaluation of the INSEE notaries index for the 2nd quarter of 2011). Outside Île-de-France, the prices have been Corse-du-Sud calculated based on an average volume of 150 transactions per city and per quarter 300 000 € 20,0 % Price per sq.m. of new property in 2nd quarter of 2011 (apartments) Nord-Pas- Picardie de-Calais 3 307 € 3 094 € Champagne- Haute-Normandie 7,8 % -2,8 % Ardennes 3 023 € 3 088 € 3,5 % 5,3 % Lorraine Basse-Normandie 2 809 € 3 472 €  9,0 % Bretagne 3,2 % 3 178 € 11,0 % Alsace Île-de-France 3 019 € 5 031 € 7,8 % 8,8 % Pays-de- Franche-Comté la-Loire 2 730 € 3 456 € 0,5 % 7,6 % Centre 3 043 € Bourgogne 0,5 % 2 653 € Poitou-Charentes -8,2 % 3 574 € 7,4 % Rhône-Alpes Ns 3 728 € Limousin 8,3 % 2 666 € Auvergne 4,5 % 3 071 € 17,4 % Aquitaine 3 441 € PACA 7,1 % 4 176 € 4,6 % Price development per sq.m.   Less than 0 % Midi-Pyrénées Corse 3 269 €  From 0 % to 5 % 3 389 € Languedoc- 2,0 % 8,0 % Roussillon  5 % plus 3 280 € ns = not significant (sales volumes -0,4 % do not permit the calculation of suitable statistics) Source: FPI / ECLN / CGDD / SOeS French property market report NOTAIREs dE FRANCE - N° 13 - October 2011
  • 4. Housing indices  France: the property price index for France as a whole is calculated by the International comparison: Notaires de France in partnership with property price index compared the INSEE. This index is published every to the income available per household three months and uses the hedonic pri- Base 2000=1 cing method. The data result from sale France documents transmitted by the notaries. United States United Kingdom  United states: the FHFA index produced by the Federal Housing Finance Agency, a US government body, measures the development of the price of individual houses based on a sample of mortgage loans, using the repeated sales method. United Kingdom: the DCLG index is the official house price index published by the British government, based on a sample of mortgage loans. It uses the hedonic pricing method. Source: CGEDD according to INSEE, notarial databases, deseasonalized INSEE Notaries Indices, Freddie Mac, FHFA, R.Shiller, US Bureau of Economic Analysis, Census Bureau, Bureau of Labor Statistics, UK DCLG, UK National Statistics Graphic downloadable at: http://www.cgedd.developpement-durable.gouv.fr/rubrique.php3?id_rubrique=138. The residential property market in Ile-de-France and Paris in the 2nd quarter of 2011 All the analyses and press conference pack can be found on the Notaires de France property portal  accessible at http://www.notaires.fr  Contact: Olivier Pavy, Director of Economic Affairs – High Council for the Notarial Profession. Editorial Committee: Pierre Bazaille, Thierry Delesalle, Michel Pagès and Olivier Pavy. Published by: Conseil supérieur du notariat - 60 bd de La Tour-Maubourg - 75007 Paris - Tél. +33 (0)1 44 90 30 00 www.notaires.fr. design and creation: Bureau de Création - ISSN : 2100-241X French property market report NOTAIREs dE FRANCE - N° 13 - October 2011