Secondary Data Analysis
•Download as PPTX, PDF•
1 like•1,557 views

UMd lecture November 30, 2010 on secondary data analysis.

Recommended
More Related Content
What's hot
What's hot (20)
Viewers also liked
Viewers also liked (6)
Similar to Secondary Data Analysis
Similar to Secondary Data Analysis (20)
More from REY DECASTRO
More from REY DECASTRO (14)
Recently uploaded
Recently uploaded (20)
Secondary Data Analysis
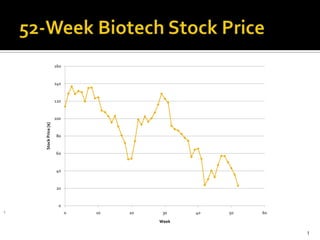
- 1. 52-Week Biotech Stock Price 1
- 2. 100 Years of “Emma” 2
- 3. 17 Years Superbowl Viewership 3
- 4. 4 What is common among these time series data?
- 5. All wrong! All these time series are fabrications All these time series are “random walks” 5
- 6. 6 Welcome to secondary data analysis.
- 7. Secondary Data Analysis B. Rey de Castro, Sc.D. Guest Researcher CDC National Center for Health Statistics University of Maryland College Park School of Public Health FMSC 720 Study Design in MCH Epidemiology November 30, 2010
- 8. Secondary Data Analysis Data that you did not collect yourself Both the data and study design are givens The statistical analysis is up to you 8
- 9. Uses for Secondary Data Hypothesis generation/testing Pilot data for grant proposals Expanding knowledge Publications
- 10. National Health and Nutrition Examination Survey (NHANES) http://www.cdc.gov/nchs/nhanes.htm Population Children, adults nationwide Method Face to face interview Physical exams Content Chronic and Infectious Disease Mental health and cognitive functioning Energy Balance Reproductive history and sexual behavior Respiratory disease Data N ~ 5,000 annually Initiated in 1960’s; Annual since 1999 On-line tutorial
- 11. National Health Interview Survey (NHIS) http://www.cdc.gov/nchs/nhis.htm Population Households, families, adults, children nationwide Method Face to face interview Content Health conditions and behaviors, access to and use of health services Cancer Control Module (1987, 1992, 2000, 2003, and 2005) Energy Balance Cancer Screening Sun Avoidance Tobacco Use and Control Genetic Testing Data N ~ 40,000 households (~87,000 individuals) annually Initiated in 1957
- 12. Other Federal Surveys National Longitudinal Mortality Study http://www.census.gov/nlms/ National Health Care Survey http://www.cdc.gov/nchs/nhcs.htm National Ambulatory Medical Care Survey http://www.cdc.gov/nchs/about/major/ahcd/ahcd1.htm Medical Expenditure Panel Survey http://www.meps.ahrq.gov/ Medicare Current Beneficiary Survey http://www.cms.hhs.gov/MCBS/ Medicare Health Outcomes Survey http://www.hosonline.org/ National Survey on Drug Use and Health http://www.oas.samhsa.gov/nhsda.htm National Survey of Family Growth http://www.cdc.gov/nchs/about/major/nsfg/nsfgbiblio.htm
- 13. Strengths Inexpensive data collection and design costs More statistical power: larger samples Broader geographic area Generalizable to national population Improves understanding of hypothesis Test trends over time Potential for linkage Person Geographically
- 14. Limitations 1 Substantial time spent on statistical analysis Cross-sectional Recall bias Mismatch: ideal and feasible hypothesis Mismatch: hypothesis and original purpose Generalizabilityto small areas impossible Specialized statistical techniques
- 15. Limitations 2 Quality Validity & reliability Changes to survey over time Poor documentation Restricted/conditional access Confidentiality 15
- 16. Recap Just a few examples of publicly available data Most are cross-sectional All employ a complex sampling design Many use multi-stage sampling Requires special software to analyze e.g., SUDAAN Use of weighting, clustering, and stratification Differences in variance estimation methods
- 18. Statistical Weight The statistical weight of a sampled person is the number of people in the population that the person represents. Weights derived from Selection probabilities Response rates Post-stratification adjustment e.g., gender, education, income, region
- 19. Stratification Population divided before sampling into disjoint, exhaustive groups (strata) Members termed primary sampling units (PSUs) Independent samples are taken in each strata Strata formed by similar geographic areas e.g., NHANES: partition US counties into 49 strata based on region and economic/racial characteristics Sample 2 counties (PSUs) from each strata
- 20. Clustering Persons residing in a small area may have similar characteristics Thus, responses of subjects in small area are potentially correlated Correlation must be accounted for in the analysis Survey analysis programs do this through strata/PSU information
- 21. Variance Estimation for Surveys Linearization: Uses a Taylor series expansion to estimate variance of non-linear estimators Default method for most programs Requires stratification and PSU information Replication: Calculates parameter estimates for each replicate and combines to estimate variance Jackknife with replicate weights available for SUDAAN, STATA, SAS and WesVAR
- 22. Replication vs. Linearization If survey doesn’t have replicate weights use the full sample weights and linearization If survey has replicate weights use them with the jackknife procedure Most software use linearization method Only SUDAAN, STATA, SAS, and WesVAR can incorporate replicate weights
- 23. Complex Survey Design Correct variance estimates Proper hypothesis testing Standard errors will tend to be larger Less likely to make Type I error
- 24. Statistical Software for Analyzing Health Surveys Specifically designed for analyzing data utilizing complex sampling designs: SUDAAN WesVar Others that can be used: SAS STATA SPSS Mplus
- 25. Data/Research Resources Univ. of Michigan Consortium for social research: http://www.icpsr.umich.edu/ UCLA Statistical Computing: http://www.ats.ucla.edu/stat/ BRFSS Maps http://apps.nccd.cdc.gov/gisbrfss/default.aspx State Cancer Profiles http://statecancerprofiles.cancer.gov/
- 26. References Korn, E.L. and Graubard, B.I. (1999). Analysis of Health Surveys. New York: John Wiley State Cancer Profiles: http://statecancerprofiles.cancer.gov/ SUDAAN: http://www.rti.org/SUDAAN/ SAS: http://www.sas.com/ SPSS: http://www.spss.com/ STATA: http://www.stata.com/ WesVar: http://www.westat.com/wesvar/ Mplus: http://www.statmodel.com/
- 27. Other Data Sources State registries Birth Death Cancer Emergency room admissions Acute outcomes 27
- 28. Intermission 28
- 29. Secondary Data Analysis Data that you did not collect yourself Both the data and study design are givens The statistical analysis is up to you 29
- 30. Lesson One 30 Integrity
- 31. Dirty Data Key-punch errors Invalid data Missing data Mislabeled variables Unknown variables 31
- 33. Processing Data Recode data Label variables Format data 33
- 34. Investigation Reality checks Out-of-range values Descriptive statistics Ranges: out-of-range or improbable values Frequencies: missing values or classes Simple graphical display 34
- 35. Normal Ranges 35
- 36. Imputing Missing Values Increases available data Statistically more complex Defensibility Useful 36
- 37. Lesson Two Spend time up-front being sure about your data Foundation of sand or stone? Crystal clear case definition & recodes More time preparing than analyzing Prevents problems Simplifies analysis 37
- 38. Statistical Analysis Plan 38
- 39. Outcome 39
- 40. Design 40
- 42. Longitudinal 42
- 43. Hierarchical 43
- 44. Diagnostics Independence Homoskedasticity Skewness Influential observations 44
- 45. Lesson Three Plan, then execute the plan Conform statistical technique to outcome and design Diagnostics 45
- 46. Case Study Ongoing spatial epidemiology project Complex survey Cross-sectional Data linkage Childhood asthma episodes Air pollution exposure 46
- 47. Case Study Air pollutant: acrolein EPA attributes >90% non-cancer respiratory health effects to acrolein No epidemiology to date 47
- 48. Data Linkage 48
- 49. National Health Interview Survey Health outcome Asthma episode in last 12 months 2000 – 2004 Children 3 – 17 years-old Parents of ~66,000 kids surveyed Nationally representative sample Complex survey weighting 49
- 50. National Health Interview Survey Potential Confounders Smoking household Acrolein industry household Age, sex, race Education, income, single-parent family Access to care, insurance Urban/rural Census regional division 50
- 51. National Air Toxics Assessment Air pollutant Acrolein Strong respiratory irritant Cigarette smoke; industrial emissions 2002 Modeled exposure assessment Census tracts nationwide 51
- 52. 52 How would you link these two databases?
- 54. 54 But, requires access to confidential NHIS data.
- 55. NCHS Says Orient to data structure and contents Locate variables Download data Append & merge data Clean & recode data Format & label variables 55
- 56. NHIS Data Processing Extract and compile data by year Multiple files 2004 redesign Compile data 2000 – 2004 Formatting and variable names a pain Identify records with complete data Link to NATA Done confidentially by NCHS staff 56
- 57. Analysis Plan Hypothesis “Childhood asthma episodes are associated with census-tract-level estimates of acrolein exposure” Descriptive statistics Logistic regression Complex weighted variance estimation SAS-callable SUDAAN 57
- 58. Wisdom Network Cultivate relationships Front-line staff Principal investigators 58
- 59. Wisdom No one cares more about your problem than you Or, you should 59
- 60. Wisdom Teach yourself Learn to learn 60
- 61. Contact B. Rey de Castro, Sc.D. jsq7@cdc.gov http://www.slideshare.net/intelligo/secondary-data-analysis-5972949 61
Editor's Notes
- Stage 1: Primary sampling units (PSUs) are selected. These are mostly single counties or, in a few cases, groups of contiguous counties with probability proportional to a measure of size (PPS).Stage 2: The PSUs are divided up into segments (generally city blocks or their equivalent). As with each PSU, sample segments are selected with PPS.Stage 3: Households within each segment are listed, and a sample is randomly drawn. In geographic areas where the proportion of age, ethnic, or income groups selected for oversampling is high, the probability of selection for those groups is greater than in other areas.Stage 4: Individuals are chosen to participate in NHANES from a list of all persons residing in selected households. Individuals are drawn at random within designated age-sex-race/ethnicity screening subdomains. On average, 1.6 persons are selected per household.