1. ISSN: 0001-5113
AADRAY
ACTAADRIAT.,
47 (Suppl.): 5 - 18, 2006
UDC: 551.468(262.3)
551.46.06(262.6):556.02
The ADRICOSM Pilot Project: a coastal and river basin
prediction system for the Adriatic Sea
Sergio CASTELLARI 1
, Nadia PINARDI 2
and Alessandro COLUCCELLI 1
1
Istituto Nazionale di Geofisica e Vulcanologia (INGV) – Sezione di Bologna,
Via Donato Creti 12, 40129 Bologna, Italy
2
Università di Bologna, Corso di Scienze Ambientali
Via S. Alberto 169, 48100 Ravenna, Italy
The ADRICOSM project was launched in October 2001, and ended in March 2005, with the
main objective of demonstrating the feasibility of a near real time operational marine monitoring
and forecasting system at the shelf and coastal scales, with connections to river basin runoff and
coastal town sewer systems. The basic system consisted of an efficient network for the collection of
marine data such as in situ temperature and salinity profiles and satellite sea surface temperature,
a regional (AREG) and shelf scale modeling system, a data assimilation system and finally a coastal
scale modeling system. Every week AREG releases 7 day marine forecasts at 5 km horizontal
scales, which are used to nest other hydrodynamic models toward the coastal scale. Two shelf
models (ASHELF-1 and ASHELF-2) at a 1.5 km horizontal scale were nested in AREG in order to
simulate (and in the future to forecast) shelf scale oceanographic features. Another important aspect
of ADRICOSM was the integration of the Cetina river (Croatia) and urban sewage monitoring/
modeling (Split, Croatia) systems with the shelf marine model. This integrated model system was
used to simulate the dispersion of sewer discharges from the urban area in the coastal waters for
water management performance studies. ADRICOSM is one of the first integrated land and marine
waters operational oceanographic systems able to meet the urgent needs for reliable integrated
coastal forecasts for the effective management of marine areas.
Key words: ADRICOSM, prediction, Adriatic Sea
INTRODUCTION
The Adriatic Sea is an important shelf area
where the occurrence of critical environmental
issues such as extensive algae blooms, seawater
anoxia and coastal erosion may affect the
economic activities of the area. An effective
management of the Adriatic marine environment
in order to control its evolving state and its
trends is essential. An “operational coastal
management system (OPCOMS)” is needed,
and should include systematic and long-term
routine oceanographic/wave/atmospheric and
biochemical measurements and modeling, along
with their rapid interpretation/dissemination
to a large number of end-users. OPCOMS
therefore has great potential as the basic support
for environmental coastal assessment and
2. 6 ACTAADRIATICA, 47 (Suppl.): 5-18, 2006
the development of marine warning systems.
Examples of possible data products include
warnings (of coastal floods, storm damage,
harmful algal blooms, oil spills and other
contaminant dispersal, etc.), optimal ship
routing, predictions of primary productivity,
ocean currents, ocean climate variability, etc.
The ADRICOSM Pilot Project (ADRIatic
sea integrated COastal areaS and river basin
Management system pilot project) is a scientific
pilot “pre-operational” project aimed at the
implementation of a NRT (Near Real Time)
OPCOMS at the shelf area scale. ADRICOSM
is based on experience drawn from the MFSPP
project (Mediterranean Forecasting System Pilot
Project, PINARDI et al., 2003), which was aimed at
building a NRT Mediterranean scale monitoring
and nowcasting/forecasting system (Fig. 1)
to become the backbone of an operational
and sustained Mediterranean operational
oceanography system for the open ocean and its
coastal areas.
The main objectives of the ADRICOSM
Pilot Project were:
• to demonstrate the feasibility of NRT
nested coastal current forecasts,
• to develop the integration of a river
monitoring and modeling system with coastal
marine forecasting at a test site near Split
(Croatia).
The ADRICOSM Pilot Project was launched
in October 2001 within the Adriatic Ionian
Initiative, which has demonstrated the political
will to construct a multinational force for
the environmental protection of the Adriatic
Sea. Moreover, ADRICOSM was built upon
the Italian-Slovenian-Croatian agreement for
scientific and technological collaboration in the
Adriatic Sea. ADRICOSM was also designed to
be consistent with the international directives
defined in the UNESCO-IOC Coastal Global
Ocean Observing System (C-GOOS) and the
UNEP-Mediterranean Action Plan Integrated
Coastal Areas and River Management Program.
ADRICOSM involved sixteen Scientific
Institutions from threeAdriatic riparian countries
(Italy, Slovenia and Croatia) and from France.
Furthermore, the ADRICOSM Project was also
designed as the backbone of the ADRICOSM
Partnership, which was launched as a Type II
Fig. 1. The Mediterranean Forecasting System approach as a basis for constructing a marine
environmental prediction system
3. 7CASTELLARI, PINARDI & COLUCCELLI: The ADRICOSM Pilot Project: a coastal and river basin prediction system
Initiative at the World Summit on Sustainable
Development (WSSD) in Johannesburg in
September 2002 by the Italian Ministry of
Environment and Territory. On April 2004, the
ADRICOSM Partnership was inserted as one
of the Mediterranean Components of the EU
Water Initiative. Finally ADRICOSM was also
part of the Mediterranean Forecasting System
Toward Environmental Predictions (MFSTEP)
project as one of the regional Mediterranean
components. The ADRICOSM Pilot Project
ended in March 2005, although some other
projects such as ADRICOSM – PULA BAY and
NERES (NEretva River delta Environmental
requalification and Sustainable development)
started within this context.
In the following paper we shall describe the
ADRICOSM system components such as the
observing and marine forecasting systems and
the river basin integrated modeling, concluding
with a discussion on the societal usage of
the marine forecasting system. The detailed
scientific results from each component are
illustrated in other papers of this volume.
THE ADRICOSM OBSERVING
SYSTEM COMPONENTS
The ADRICOSM project co-ordinated
a highly complex network of platforms for
oceanographic NRT data collection. The
components were:
• Voluntary Observing Ship (VOS) tempera-
ture profiles by XBTs,
• satellite sea surface temperature and
chlorophyll data,
• CTD (Conductivity-Temperature-Depth)
coastal networks for temperature and salinity
profiles, and in situ buoy stations for ocean
surface variables and meteo-marine parameters.
The Voluntary Observing Ship (VOS)
temperature profiles
Two XBT tracks (so-called ADRIA-VOS-
1, ADRIA-VOS-2) for collecting temperature
profiles, with 10 nautical mile resolution along
track, were organized and implemented with
monthly and bi-weekly sampling frequency
during ADRICOSM. This horizontal resolution
was selected in order to resolve the mesoscale
Fig. 2. The ADRICOSM marine monitoring system (CTD, XBT and buoys) with the
different data collecting centres
4. 8 ACTAADRIATICA, 47 (Suppl.): 5-18, 2006
in the southern Adriatic basin, where the first
baroclinic radius of deformation is about 10
km. The ADRIA-VOS-1 runs from Ploče
(Croatia) to Malta, while the ADRIA-VOS-2
extends between Dubrovnik and Bari (Fig.
2). The Ploče-Malta track, managed by OGS
(Istituto Nazionale di Oceanografia e Geofisica
Sperimentale, Trieste, Italy), was established
during the MFSPP project and continued during
the ADRICOSM project (GAČIĆ et al., 2006).
The Dubrovnik-Bari track was managed by
IOF (Institute of Oceanography and Fisheries,
Split, Croatia) (MOROVIĆ et al., 2006) and ENEA
(Agency for New Technology, Energy and the
Environment, La Spezia, Italy). Both tracks
started on October 1, 2001 and were completed
in October 2004. Inter-comparison of the profiles
between the two different tracks at a cross-check
station in the central Southern Adriatic basin
showed the consistency of the data collected
by the two VOS ships. The XBT measurements
were collected according to common protocols
for data acquisition, transmission and control
(MANZELLA et al., 2003; MANZELLA et al., 2006).
The full-resolution VOS-XBT profiles were
transmitted in NRT via cellular phone to the
ENEA collecting centre (La Spezia, Italy) where
quality checks on the data were performed.
The satellite data
The Satellite Oceanography Group of ISAC-
CNR (Institute of Atmospheric and Climate
Sciences – National Research Council, Rome,
Italy) developed, during the ADRICOSM
project, the first NRT distribution system of
satellite data products consisting of remotely-
sensed ocean colour and sea surface temperature
(SST) data (SCIARRA et al., 2006). The service
comprised of data acquisition, data processing
and data distribution and it provided satellite data
products for the period October 2002 – March
2005. This long-term time series of satellite data
products was used to validate the regional model
seasonal temperature cycle and contributed to
the monitoring of water type properties in the
Adriatic Sea. The following data products were
available during the ADRICOSM project:
• Adriatic Sea Real-Time satellite-derived SST,
Chlorophyll a concentration, case I and case
II waters along with cloud mask images at a
1-km resolution,
• Daily Optimally Interpolated-OI SST at a 5-
km resolution (model grid),
• Daily Optimally Interpolated-OI Chlorophyll a
at a 5-km resolution (model grid).
The CTD data
During ADRICOSM a network of coastal
monitoring stations measuring depth, tempera-
ture, conductivity (salinity) and oxygen profiles
was upgraded or established in order to capture
the low frequency signals that have periodic-
ity greater than the tidal and inertial oscilla-
tions. In the case of ADRICOSM the sampling
interval was chosen to be two weeks during the
pre-operational period and one week during
the operational period and data were collected
within two days for each area (synoptic sam-
pling). The areas where the CTD stations were
implemented (Fig. 2) were:
• the Emilia-Romagna coastal area (EM),
which was managed by ARPA (Regional
Agency for Environmental Protection
of Emilia Romagna, Cesenatico, Italy)
(MANZELLA et al., 2006);
• the Gulf of Trieste (GT), which was man-
aged by LBM (Laboratory of Marine
Biology, Trieste, Italy) (CELIO et al., 2006)
and by MBS (Marine Biological Station,
Piran, Slovenia) (MALAČIČ & PETELIN
2006; MALAČIČ et al., 2006);
• the Rovinj coastal area (RO), which was
managed by CMR (Centre for Marine
Research - Institute “Ruđer Bošković”,
Rovinj, Croatia) (LYONS et al., 2006);
• the Pelješac-Vis-Drvenik coastal area
(PVD), which was managed by IOF
(InstituteofOceanographyandFisheries,
Split, Croatia) (GRBEC et al., 2006).
Some of these areas were defined ad hoc
for the project while others were derived
from existing monitoring systems such as the
Emilia-Romagna and the Trieste areas. During
ADRICOSM an intercalibration experiment for
the marine probes (CTD) used for this network
5. 9CASTELLARI, PINARDI & COLUCCELLI: The ADRICOSM Pilot Project: a coastal and river basin prediction system
was conducted and showed consistency among
the measurements. A CTD data collection
protocol was developed for all the CTD coastal
networks. All network CTD data were collected
in about one, or maximum two, days and were
transmitted after a few hours to the ENEA Data-
Center (La Spezia, Italy) through an ftp data
transmission system. The bi-weekly and weekly
data collections were conducted from September
2002 to December 2003, except for the Emilia-
Romagna area where monitoring continues for
institutional purposes, the network being part of
the traditional ARPA monitoring network.
The in situ buoys
Two in situ multi-parametric permanent
stations were used in addition to one completely
developed during ADRICOSM with the main
purpose of evaluating the marine forecast quality
(Fig. 2):
• the Po river “S1” buoy station (BORTOLUZZI
et al., 2006);
• the Tagliamento river “MAMBO” buoy
station;
• the Marjan Cape (Split) station (DADIĆ et
al., 2006).
The S1 buoy was started duringADRICOSM
(BORTOLUZZI et al., 2006) while the others were
already functioning and the data, if requested,
weremadeavailabletotheADRICOSMpartners.
The S1 station data were compared each day to
the products derived from the forecasting model
of the Adriatic Sea, thus contributing to a real
time validation system.
Marine data transmission and management
During the ADRICOSM project a number
of centres were networked (Fig. 2). Each of
these had a different responsibility yet all of
them worked with ftp and Web pages to make
available in NRT the different ADRICOSM
products. In particular, for CTD and XBT a
robust transmission strategy was applied. The
XBT data, after collection, were sent by GSM
phone to the ENEA Data-Centre, where they
were quality-controlled and archived. The NRT
procedures for the XBTs quality control were
developed in the MFSPP project (MANZELLA
et al., 2003; MANZELLA et al., 2006), and usually
took about 20 minutes to quality-control the
data. Finally, through a Web service it was
possible to access the raw XBT data (the
original temperature profiles) and the CTD
quality controlled data in MedAtlas format,
which is the European data standard developed
in the context of different European projects
over the past ten years.
THE MARINE MODELING
COMPONENT AT BASIN AND SHELF
SCALE
TheADRICOSM modeling system consisted
of the following components (Fig.3):
• the Adriatic Regional Model (AREG),
• the north Adriatic Shelf Model (ASHELF-1),
• the Adriatic Shelf Model for the Split
coastal area (ASHELF-2),
• the Gulf of Trieste models (ACOAST-1
and ACOAST-2).
The AREG and ASHELF models
In ADRICOSM the most widely used
circulation model was the free-surface, three-
dimensional finite-difference numerical model
based on the Princeton Ocean Model (POM)
(BLUMBERG & MELLOR, 1987). During this
project POM was implemented in two main
versions: the Adriatic Regional Model (AREG)
covering the entire Adriatic basin (ZAVATARELLI
& PINARDI, 2003; ODDO, 2005; ODDO et al., 2005;
ODDO et al., 2006) while the Adriatic Shelf Model
covered the north Adriatic Sea (ASHELF-1)
(ZAVATARELLI & PINARDI, 2003; ODDO, 2005) and
the coastal area of Split (ASHELF-2) (ORLIĆ et
al., 2006).
The AREG, ASHELF-1 and ASHELF-2
models all use grids with constant horizontal
resolution. The AREG grid has a resolution
of 5 km (approximately 1/20°), and its model
domain encompasses the entire Adriatic basin
and extends south of the Otranto channel into
the Northern Ionian Sea, where the only open
boundary is located. The ASHELF-1 grid has a
horizontal resolution of 1.5 km (approximately
6. 10 ACTAADRIATICA, 47 (Suppl.): 5-18, 2006
1/37°), and the only open boundary cuts the
basin across an ideal line running from the
southern tip of the Istrian peninsula to the Italian
coast at approximately 43.6° lat. N (ODDO, 2005).
Finally, the ASHELF-2 grid has a horizontal
resolution of 1 km and its domain covered the
Split coastal area including the islands of Brač
and Šolta, the channel between the Pelješac
peninsula and the island of Korčula, and the
channel between the mainland and the island of
Hvar (ORLIĆ et al., 2006).
The atmospheric forcing for AREG,
ASHELF-1 and ASHELF-2 was provided by
ECMWF (European Center for Medium range
Weather Forecasting) surface variables with
interactive air-sea physics (ODDO et al., 2005). In
the AREG model the monthly river runoff data
were obtained from the monthly climatology,
and the major Adriatic rivers were considered
as point sources while minor contributions have
been defined as distributed source functions. The
ASHELF-2 model included four rivers: Jadro,
Žrnovnica, Cetina and Neretva (ORLIĆ et al.,
2006). The models were hierarchically connected
to one another by simple one-way nesting
techniques. In addition, the AREG model was
connected to the Mediterranean Forecasting
System general circulation model covering the
entire Mediterranean basin (Fig. 3).
The ACOAST 1.1 and ACOAST-1.2 models
Very high horizontal resolution marine
models were also developed for the Gulf of
Trieste in two different versions: ACOAST-1.1
and ACOAST-1.2. The ACOAST-1.1 domain
is a grid with a horizontal resolution of 250 m.
The ocean model used was the MIT circulation
model (Massachusetts Institute of Technology,
Boston), which is a three-dimensional, finite
volume (with partial cells capability), free
surface numerical model (CRISE et al., 2006). It
can be run in non-hydrostatic mode and allows
the use of alternative numerical schemes for the
advective and diffusive terms. TheACOAST-1.2
was a POM model installed with a resolution of
0.5 km x 0.5 km, which was one-way nested in
the ASHELF-1 model of the Northern Adriatic.
Its domain covers an area surrounding the Gulf
of Trieste in the Northern Adriatic (MALAČIČ &
PETELIN, 2006).
The AREG forecasting system
ADRICOSM demonstrated the feasibility
of an NRT marine forecasting system working
Fig. 3. The ADRICOSM nested modeling network
7. 11CASTELLARI, PINARDI & COLUCCELLI: The ADRICOSM Pilot Project: a coastal and river basin prediction system
at shelf scales. This result is the outcome of a
complex technological and scientific chain (Fig.
4). In the Adriatic Sea, the forecast time span is
determined by the capability to predict the river
run-off, such as the Po River (ODDO et al., 2006).
The forecast lead time was then established to
be seven days even if ECMWF forecast was
available for ten days.
The dissemination of the AREG simulations
and forecasts was conducted through the Web
network on a regular weekly basis. Forecasts
and simulations were produced once a week
and published (http://www.bo.ingv.it/adricosm)
on Wednesday at noon, 24 hours after the actual
start of the forecast. Three types of graphic
outputs were produced:
1) horizontal fields in the entire model domain
(Fig. 5), with the exception of the velocity
fields which were divided in sub-regions to
show the circulation in finer detail,
2) zooms over selected regions,
3) sections along transects (Fig. 6) where CTD
data were collected.
The available fields over the entire basin
were:
- Surface fields: Total Heat Flux (Wm-2
),
Sea Surface Elevation (m), Sea Surface Anoma-
ly (m), Wind Stress (dyn cm-2
),
-3-Dfields:Temperature(°C),Salinity(psu),
Temperature Anomaly (°C), Salinity Anomaly
(psu), Total Velocity (m s-1
and knots).
Another important step was the development
of a data assimilation scheme for the CTD
and XBT data collected during ADRICOSM.
However, data assimilation was not implemented
in Real Time and the project produced only
a delayed mode assimilated data set that was
available on request. The data assimilation
system used in ADRICOSM was SOFA (System
for Ocean Analysis and Forecast, DE MEY &
BENKIRAN, 2002), and it was applied for the first
time in coastal areas (GREZIO & PINARDI, 2006).
Fig. 4. The ADRICOSM operational forecasting system is composed of the AREG model at a 5-km horizontal resolution
which gets the boundary conditions from the Mediterranean model. The downscaling is performed along the nested
model chain, ASHELF at a 1.5-km horizontal resolution and ACOAST at 0.5 km. Input data are the atmospheric
forcing from ECMWF and the daily Po River discharge from ARPA Emilia Romagna. AREG runs on an NEC-SX6
supercomputer, situated at the NRT-Modeling-Centre (INGV, Bologna, Italy). Model simulations and forecasts are
released once a week and disseminated via FTP. The forecast bulletin is published on the ADRICOSM Web site and
data are available to the end-users on request
8. 12 ACTAADRIATICA, 47 (Suppl.): 5-18, 2006
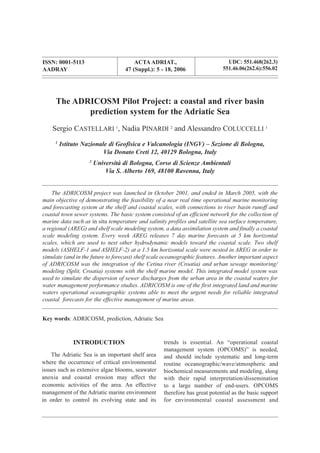
Fig. 5. Graphic output for the entire basin: sea surface temperature simulation
as an average for 4-5 September 2006
Fig. 6. Sections along transects disseminated through the Web: an example
of the salinity field along the southern transect of Rovinj
9. 13CASTELLARI, PINARDI & COLUCCELLI: The ADRICOSM Pilot Project: a coastal and river basin prediction system
THE INTEGRATED RIVER BASIN
AND COASTAL AREA COMPONENT
The third important development in
ADRICOSM was based on the Split-Brač-Hvar
coastal area with connections to the Cetina river
basin and Split sewer system. The Cetina is an
important river in the middle karstic coastal area
of Croatia and, due to its large water flow, is
used as a water supply for agricultural activities,
for hydro-electric purposes and for recreational
activities. This river is now completely regulated
although it still provides the coastal area with
organic and inorganic suspended materials
making these areas among the most critical on
the Croatian coastline.
Existing hydrographic data for the river
basin, along with data of the Split sewer system,
the river watershed and the coastal area, were
acquired and organised in a data-base (BETTIN et
al., 2006). Water quality data were then obtained
through automatic samplers placed at suitable
locations within the sewer network and in the
Cetina river. Finally, measurements of quality
parameters (Total Nitrogen – COD, Suspended
Solids – SS) were provided through laboratory
analyses. The water quality measurements were
essential for analyses of urban drainage impact
on the receiving water body and for the planning
of measures to reduce the pollution. In order to
simulate all components of the watershed of the
Cetina river basin and the urban sewage system
the following models were used (Fig. 7):
• the MOUSE model (Danish Hydraulic
Institute - DHI) for the Split Sewer System,
• the MIKE11 (DHI) for the Cetina river,
• the RMA2-SMS (Surface water Modeling
System) from Environmental Modeling System,
Inc., Utah, for the Split coastal area (Fig. 8).
Fig. 7. The three different models used for the Cetina catchment analysis: the MIKE11 model, the MOUSE model
and the RMA2-SMS model
10. 14 ACTAADRIATICA, 47 (Suppl.): 5-18, 2006
All these models were integrated and con-
nected (BETTIN et al., 2006). In addition, an inter-
face between the RMA2-SMS two-dimensional
model and the ASHELF-2 three-dimensional
model was developed in the coastal area of Split
in order simulate the urban outflow of pollutants
in Kaštela Bay. Coupling two models with dif-
ferent horizontal resolutions from 1.5 km to 20
m was a challenge and the project only demon-
strated the feasibility of building such a system.
This model system, calibrated with the
collected data, was used to evaluate the status of
the coastal area by considering all the pollution
inputs coming from urban discharges, industries,
rivers and diffusive loads from agriculture.
These hydrodynamic simulation results showed
that critical areas are located especially on the
south-western side of the Split network, along
the coastal pipe collecting waters all the way to
the main outlet in the deep sea. This integrated
system can be used as an effective DSS (Decision
Support System) for management and planning
of the wastewater facilities and receiving marine
waters, and can also be used as a collaborative
tool among the various bodies in charge of the
operation and quality control of the Split area.
USE OF THE FORECAST PRODUCTS
One of the aims of ADRICOSM was the
provision of suitable information, derived from
the operational forecasts, to end-users. A target
end-user group for the marine forecasts is the
coastguard corps. They are interested in oil
spill forecasting to help in the management
and remediation action against accidental and
operational release of oil in marine areas. The
project produced an interface between the oil
spill prediction MEDSLIK model (ZODIATIS et
al., 2003; LARDNER et al., 1998) and the forecast
products that are suitable for rapid deployment
of oil spill forecasts in areas of interest. This
end-user tool was presented during a training
course on “Operational Oceanography of the
Adriatic Sea” at the IMA (International Marine
Academy) in Trieste (Italy) at the end of the
year 2004.
Detailed knowledge of the current velocity
field and wind forcing are essential elements for
prediction of the fate of pollutants and oil spills
in the sea and the relevant products from the
ADRICOSM forecasting system were included
as a basic input data set to MEDSLIK.
One of the main features of the MEDSLIK
application is a user-friendly graphical interface,
which makes it easy to insert the input data
describing the oil spill accident source, and to
choose between different data sets of current
and wind data. The results are visualized in Fig.
9 for a study case where an accidental oil release
occurs near the Croatian coast. For the reasons
explained above, ADRICOSM-MEDSLIK
Fig. 8 A zoom of the RMA2-SMS model domain in Kaštela Bay (horizontal resolution 20 m – 200 m):.(a) - the simulation of
dispersal of pollutants from the Split sewer outflow in Kaštela Bay; (b) - simulated hydrodynamics with very complex
two eddy system within the Bay. The arrows indicate the current direction with amplitude given by colour
a b
11. 15CASTELLARI, PINARDI & COLUCCELLI: The ADRICOSM Pilot Project: a coastal and river basin prediction system
represents a seminal example of the possible
end-user applications of the information derived
from an operational forecasting system.
CONCLUSIONS
The ADRICOSM project demonstrated the
feasibility of a NRT operational monitoring and
forecasting system of marine physical parameters
(temperature, salinity and velocity) at the shelf
scale of the Adriatic Sea. The innovative aspect
of the project is, above all, the downscaling
to coastal area resolution from basin scale
circulation hydrodynamics and the integration
of land-derived water and material inputs with
appropriate resolution to study pollution impacts.
The integrated system approach thatADRICOSM
has started will probably be a useful example for
future developments that will require a much
closer interaction with end-users.
At present, applications such as oil spill
models and fishery assessment models (ARNERI,
personal communication) can be interconnected
with the output of the ADRICOSM operational
system. Further development of this system
both in downscaling of the marine models
(by increasing the complexity of the nested
model network and the horizontal resolution
of each model) and expansion of the marine
coastal observations (by also collecting the
marine biochemical parameters) will result in
an increase in the value of such systems and the
usage of their products by the local and regional
end-users.
AKNOWLEDGEMENTS
The ADRICOSM Pilot Project has been
financially supported by the Italian Ministry
for the Environment and Territory (IMET) -
Department for Environmental Research and
Development. Additional support was provided
by the Slovenian Research Agency and the
Croatian Ministry of Science, Education and
Sports.All the partners of the project are thanked
for their contribution to the Acta Adriatica
special issue and for making it possible to write
this paper as a review of their results.
Fig. 9. The oil spill simulation in the Adriatic Sea near the Istrian coast using the Medslick model cou-
pled with the AREG forecasting model. The arrows indicate the modeled flow field, the colours
the concentration of the contaminant a few days after its release and the white arrow the direction
of the wind at the sea surface
12. 16 ACTAADRIATICA, 47 (Suppl.): 5-18, 2006
REFERENCES
ADRICOSM GROUP. 2005. Final Scientific Report.
IstitutoNazionalediGeofisicaeVulcanologia
(INGV), Bologna (Italy), 496 pp.
ARTEGIANI, A., D. BREGANT, E. PASCHINI, N.
PINARDI, F. RAICICH & A. RUSSO. 1997. The
Adriatic Sea general circulation. Part I: Air-
Sea interactions and water mass structure, J.
Phys. Oceanogr., 27: 1492-1514.
BETTIN, A., A. PRETNER, A. BERTONI, J. MARGETA,
M. GONELLA & P. POLO. 2006. The IRMA
concept applied to River Cetina and Split
catchment. Acta Adriat., 47 (Suppl.): 247-
266.
BLUMBERG, A. F. & G. L. MELLOR. 1987. A
description of a three-dimensional coastal
ocean circulation model. In: N. S. Heaps
(Editor). Three-dimensional Coastal Ocean
Models. AGU, Washington, pp 1-16.
BORTOLUZZI, G., F. FRASCARI, P. GIORDANO, M.
RAVAIOLI,G.STANGHELLINI&A.COLUCCELLI.
2006. The S1 buoy station, Po River delta:
data handling and presentation. Acta Adriat.,
47 (Suppl.): 113-131.
CELIO, M., V. MALAČIČ, A. BUSSANI, B. ČERMELJ,
C. COMICI & B. PETELIN. 2006. The coastal
scale observing system component of
ADRICOSM: Gulf of Trieste network. Acta
Adriat., 47 (Suppl.): 65-79.
CRISE, A., S. QUERIN & V. MALAČIČ. 2006. A strong
bora event in the Gulf of Trieste: a numerical
study of wind driven circulation in stratified
conditions with a pre-operational model.
Acta Adriat., 47 (Suppl.): 185-206.
DADIĆ, V., M. BONE, G. BEG PAKLAR, B. GRBEC,
D. IVANKOVIĆ, F. MATIĆ & M. MOROVIĆ. 2006.
Automatic meteo-ocean station (AMOS):
real-time data acquisition, validation,
archiving and numerical modeling. Acta
Adriat., 47 (Suppl.): 133-148.
DE MEY, P. & M. BENKIRAN. 2002. A multivariate
reduced-order optimal interpolation method
and its application to the Mediterranean
basin-scale circulation. In Pinardi N. &
J.D. Woods (Editors). Ocean Forecasting:
Conceptual Basis and Application, Springer-
Verlag Berlin, pp. 281-306.
DEMIROV, E., N. PINARDI & C. FRATIANNI. 2003.
Assimilation scheme of the Mediterranean
Forecasting System: operational
implementation. Ann. Geophys., 21: 180-
204.
GAČIĆ, M., V. CARDIN & V. KOVAČEVIĆ. 2006.
Variations of thermal conditions in the
southern Adriatic from XBT measurements
in the period October 2002 – June 2003.
Acta Adriat., 47 (Suppl.): 19-31.
GRBEC, B., V. DADIĆ, F. MATIĆ, M. MOROVIĆ, G.
BEG PAKLAR & D. IVANKOVIĆ. 2006. Surface
fluxes and termohaline variability over the
ADRICOSM polygon Pelješac-Vis-Drvenik.
Acta Adriat., 47 (Suppl.): 97-111.
GREZIO, A. & N. PINARDI. 2006. Data assimilation
of temperature and salinity profiles in the
Adriatic Sea regional model. Acta Adriat.,
47 (Suppl.): 149-168.
LARDNER, R. W., G. ZODIATIS, L. LOIZIDES &
A. DEMETROPOULOS. 1998. An operational
oil spill model in the Levantine Basin
(Eastern Mediterranean Sea). International
symposium on Marine Pollution, Monaco,
5-9 October 1998.
LYONS, D. M., I. JANEKOVIĆ, R. PRECALI & N. SUPIĆ.
2006. Northern Adriatic Sea hydrographic
conditions from October 2002 to September
2003, including the climatic heating anomaly
of summer 2003. Acta Adriat., 47 (Suppl.):
81-96.
MALAČIČ, V. & B. PETELIN. 2006. Numerical
modeling of the winter circulation of the
Gulf of Trieste (northern Adriatic). Acta
Adriat., 47 (Suppl.): 207-217.
MANZELLA, G. M. R., F. RESEGHETTI, A. BALDI, G.
MONTANARI, S. SERRA, M. BENZI, V. DADIĆ, B.
GRBEC, M. MOROVIĆ, F. MATIĆ, M. GAČIĆ, G.
SPAGGIARI, G. GELSI, M. CELIO, A. BUSSANI, C.
COMICI,V.MALAČIČ,T.MAKOVEC,B.ČERMELJ,
D. M. LYONS, R. PRECALI, N. SMODLAKA & E.
BÖHM. (in press). Operational RealTime Data
Management System for the Mediterranean
13. 17CASTELLARI, PINARDI & COLUCCELLI: The ADRICOSM Pilot Project: a coastal and river basin prediction system
large and coastal scales monitoring: a tool
to forecast and assess marine variability. J.
Geophys. Res., Adriatic Special Issue.
MANZELLA, G. M. R, E. SCOCCIMARRO, N. PINARDI
& M. TONANI. 2003. Improved near real
time data management procedures for the
Mediterranean ocean Forecasting System-
Voluntary Observing Ship program. Ann.
Geophys., 21: 49-62.
MOROVIĆ, M., F. MATIĆ, B. GRBEC, V. DADIĆ & D.
IVANKOVIĆ. 2006. South Adriatic phenomena
observable through VOS XBT and other
ADRICOSM data. Acta Adriat., 47 (Suppl.):
33-49.
ODDO, P., N. PINARDI, M. ZAVATARELLI & A.
COLUCCELLI. 2006. The Adriatic Basin
forecasting system.ActaAdriat., 47 (Suppl.):
169-184.
ODDO, P. 2005. Numerical predictions of the
Adriatic Sea circulations and its coastal areas
regimes. Dottorato di Ricerca in Scienze
Ambientali: tutela e gestione delle risorse
naturali XVII ciclo, Università degli Studi di
Bologna, Ravenna.
ODDO, P., N. PINARDI & M. ZAVATARELLI. 2005. A
numerical study of the interannual variability
of the Adriatic Sea (2000-2002). Sci.Total
Environ., 353: 39-56.
ORLIĆ, M., G. B. PAKLAR,, Z. PASARIĆ, B. GRBEC
& M. PASARIĆ. 2006. Nested modeling of the
East Adriatic coastal waters. Acta Adriat., 47
(Suppl.): 219-245.
PINARDI, N., I. ALLEN, E. DEMIROV, P. DE MEY, A.
LASCARATOS, P-Y LE TRAON, C. MAILLARD,
G. MANZELLA & C. TZIAVOS. 2003. The
Mediterranean Ocean Forecasting System
first phase of implementation (1998-2001).
Ann. Geophys., 21: 1-20.
SCIARRA, R., E. BÖHM, E. D’ACUNZO & R.
SANTOLERI. 2006. The large scale observing
system component of ADRICOSM: the
satellite system. Acta Adriat., 47 (Suppl.):
51-64.
ZAVATARELLI, M. & N. PINARDI. 2003. The Adriatic
Sea modeling system: a nested approach.
Ann. Geophys., 21: 345-364.
ZODIATIS, G., R. LARDNER, E. DEMIROV, G.
GEORGIOU & N. PINARDI. 2003. Cyprus
coastal ocean forecasting and observing
system. Building the European Capacity
in Operational Oceanography, Elsevier
Oceanogr. Ser., 69: 36-45.
14. 18 ACTAADRIATICA, 47 (Suppl.): 5-18, 2006
ADRICOSM pilot projekt: Sustav predviđanja u obalnim područjima i
riječnim bazenima Jadranskog mora
Sergio CASTELLARI 1
, Nadia PINARDI 2
i Alessandro COLUCCELLI 1
1
Nacionalni institut za geofiziku i vulkanologiju (INGV) – Odsjek u Bolonji,
Via Donato Creti 12, 40129 Bolonja, Italija
2
Sveučilište u Bolonji, Odsjek za očuvanje okoliša,
Via S. Alberto 169, 48100 Ravena, Italija
SAŽETAK
Projekt ADRICOSM započeo je u listopadu 2001. i završio u ožujku 2005. godine. Glavni je
cilj projekta bio pokazati mogućnosti operacionalizacije monitoringa i prognoze u skoro realnom
vremenu na šelfu te u obalnim područjima koja su povezana s riječnim bazenima i gradskim otpadnim
vodama. Sustav je bio opremljen efikasnom mrežom sakupljanja podataka izmjerenih u moru kao što
su profili temperature i saliniteta te satelitske površinske temperature mora, regionalnim jadranskim
modelom (AREG) i modelom na skali šelfa, sustavom asimilacije podataka te konačno, obalnim
modelom. Svaki tjedan AREG je izrađivao 7-dnevnu oceanografsku prognozu na horizontalnoj
skali od 5 km koja je upotrebljavana za gniježđenje drugih hidrodinamičkih modela duž obale.
Dva modela na šelfu (ASHELF-1 i ASHELF-2) horizontalne rezolucije od 1.5 km ugniježđeni su u
jadranskiAREG model s ciljem simuliranja (te u budućnosti i prognoziranja) oceanografskih osobina
šelfa. Drugi važan aspekt ADRICOSM projekta bio je integracija monitoringa i modeliranja dotoka
rijekom Cetinom i sustavom otpadnih voda s oceanografskim modelom šelfa. Ovaj je integracijski
sustav upotrebljen za simuliranje disperzije urbanih otpadnih voda u obalnom području. Projekt
ADRICOSM je jedan od prvih integracijskih sustava kojim se za potrebe operativne oceanografije
i prognoze ujedinjuju obalne vode s dotocima s kopna s ciljem efikasnog upravljanja obalnim
područjima.
Ključne riječi: ADRICOSM, predviđanje, Jadransko more