SlideShare a Scribd company logo
1 of 41
Download to read offline
World Bank & Government of The Netherlands funded
Training module # WQ - 35
Emission Spectroscopy and
Nephelometry
New Delhi, February 2000
CSMRS Building, 4th Floor, Olof Palme Marg, Hauz Khas,
New Delhi – 11 00 16 India
Tel: 68 61 681 / 84 Fax: (+ 91 11) 68 61 685
E-Mail: dhvdelft@del2.vsnl.net.in
DHV Consultants BV & DELFT HYDRAULICS
with
HALCROW, TAHAL, CES, ORG & JPS
Hydrology Project Training Module File: “ 35 Emission Spectroscopy and Nephelometry.doc” Version 23/02/00 Page 1
Table of contents
Page
1. Module context 2
2. Module profile 3
3. Session plan 4
4. Overhead/flipchart master 5
5. Evaluation sheets 25
6. Handout 27
7. Additional handout 32
8. Main text 34
Hydrology Project Training Module File: “ 35 Emission Spectroscopy and Nephelometry.doc” Version 23/02/00 Page 2
1. Module context
This module introduces the principles of emission spectroscopy and nephelometry, and the
instruments which are used for these analyses. Some other related modules are listed
below.
While designing a training course, the relationship between this module and the others,
would be maintained by keeping them close together in the syllabus and place them in a
logical sequence. The actual selection of the topics and the depth of training would, of
course, depend on the training needs of the participants, i.e. their knowledge level and skills
performance upon the start of the course.
No. Module title Code Objectives
1. Basic water quality concepts WQ - 01 • water pollutants
• ambient water quality standards
• monitoring water quality
2. How to measure pH WQ - 07 • pH meter and electrodes
• precautions
3. Use of Ion selective probes WQ - 33 • precautions required in use of ion
selective probes.
4. Absorption Spectroscopy WQ - 34 • understand the principle of absorption
spectroscopy
• explain the use of absorption
spectroscopy for chemical analyses
Hydrology Project Training Module File: “ 35 Emission Spectroscopy and Nephelometry.doc” Version 23/02/00 Page 3
2. Module profile
Title : Emission Spectroscopy and Nephelometry
Target group : HIS function(s): Q2, Q3, Q5, Q6
Duration : One session of 60 min.
Objectives : After the training the participants will be able to:
• understand the principles of emission spectroscopy and
nephelometry
• explain how emission spectroscopy and nephelometry are used
for specific laboratory analyses
Key concepts : • emission spectroscopy
• flame photometers
• nephelometry and turbidimetry
• turbidimeters
• applications
Training methods : Lecture, exercises, discussion, demonstration of equipment
Training tools
required
: Board, flipchart, OHS
Handouts : As provided in this module
Further reading
and references
: • Chemistry for environmental engineers – C.N.Sawyer,
P.L.McCarty & G.F.Parkin, McGraw – Hill, Inc, 1994
• Standard methods for the examination of water and
wastewaters, AWWA, 19th edition, 1995
Hydrology Project Training Module File: “ 35 Emission Spectroscopy and Nephelometry.doc” Version 23/02/00 Page 4
3. Session plan
No Activities Time Tools
1 Preparations
2 Introduction:
• Ask participants to state different instruments for water
quality analysis
• Explain reasons to use emission spectroscopy and
nephelometry
10 min OHS
3 Flame photometers, theoretical concepts and definitions:
• Basic instrument
• Means of producing emission
• Filter, photocell, galvanometer
• Principle of sodium analysis
20 min OHS
4 Turbidimeter and nephelometer:
• Difference between analyses, and instruments
• significance of turbidity
• instrument components
• Principle of sulphate analysis
20 min OHS
5 Maintenance 5 min
6 Exercise
7 Wrap up and evaluation 5 min
Hydrology Project Training Module File: “ 35 Emission Spectroscopy and Nephelometry.doc” Version 23/02/00 Page 5
4. Overhead/flipchart master
OHS format guidelines
Type of text Style Setting
Headings: OHS-Title Arial 30-36, with bottom border line (not:
underline)
Text: OHS-lev1
OHS-lev2
Arial 24-26, maximum two levels
Case: Sentence case. Avoid full text in UPPERCASE.
Italics: Use occasionally and in a consistent way
Listings: OHS-lev1
OHS-lev1-Numbered
Big bullets.
Numbers for definite series of steps. Avoid
roman numbers and letters.
Colours: None, as these get lost in photocopying and
some colours do not reproduce at all.
Formulas/Equat
ions
OHS-Equation Use of a table will ease horizontal alignment
over more lines (columns)
Use equation editor for advanced formatting
only
Hydrology Project Training Module File: “ 35 Emission Spectroscopy and Nephelometry.doc” Version 23/02/00 Page 6
Emission spectroscopy and nephelometry
• Emission spectroscopy and Nephelometry are 2 common
analytical methods
• Both methods rely on measurement of light
• In Emission spectroscopy, the light Emitted by heated metal
atoms in vapourised water
• In Nephelometry, the light Scattered by particles in water is
measured
• Nephelometry is related to ‘Turbidimetry’
Hydrology Project Training Module File: “ 35 Emission Spectroscopy and Nephelometry.doc” Version 23/02/00 Page 7
Emission spectroscopy
• Flame emission spectroscopy:
- Also known as ‘Atomic Emission Spectroscopy’
- Also known as ‘Flame Photometry’
• Primarily used in the determination of alkali metals: K+
, Na+
• Other metals which can be measured: Ca++
, Mg++
, Sr++
Hydrology Project Training Module File: “ 35 Emission Spectroscopy and Nephelometry.doc” Version 23/02/00 Page 8
Emission spectroscopy: Principle (1)
• Many metallic elements will emit a characteristic radiation,
when subjected to suitable excitation (e.g. flame)
• The Intensity of emitted radiation, at some particular
wavelength, can be correlated to the amount of element
present
Hydrology Project Training Module File: “ 35 Emission Spectroscopy and Nephelometry.doc” Version 23/02/00 Page 9
Emission spectroscopy: Principle (2)
- Liquid sample is sucked into instrument
- Metal salts get vaporised (‘atomized’)
- Metals atoms are excited by energy of the flame
- Excited atoms emit radiation characteristic of the metal
- Intensity of radiation increases with concentration of element
- Linear relation between intensity & concentration
Hydrology Project Training Module File: “ 35 Emission Spectroscopy and Nephelometry.doc” Version 23/02/00 Page 10
Emission spectroscopy: Principle (3)
• Emitted radiation is measured:
- Emitted radiation passes through lens and optical filter
- Photocell reads the characteristic radiation
- Amplifier & digital read-out of radiation intensity
Hydrology Project Training Module File: “ 35 Emission Spectroscopy and Nephelometry.doc” Version 23/02/00 Page 11
Emission spectroscopy: Instrument (1)
Mixing Chamber Atomiser
Sample
GAS
AIR
DRAIN
LENS FILTER PhotocellFLAME
BURNER
Amplifier
and
Read-out
Hydrology Project Training Module File: “ 35 Emission Spectroscopy and Nephelometry.doc” Version 23/02/00 Page 12
Emission spectroscopy: Instrument (2)
• The Atomiser:
- stream of air is blown across the opening to the sample inlet jet,
creates suction in central tube
- sample is drawn to the air stream and a fine mist is formed
• The Flame:
- Typically acetylene gas together with air
• Sensor:
- Lens, slit, filter, photocell, amplifier and read-out
Hydrology Project Training Module File: “ 35 Emission Spectroscopy and Nephelometry.doc” Version 23/02/00 Page 13
Emission spectroscopy: Measurement (1)
• For Na+
and K+
the spectra are simple, consisting of a few
wavelengths
• Na+
produce a characteristic yellow emission at 589 nm,
• Concentrations can be measured to ± 1 mg/l
• K+
produce a characteristic emission at 766.5 nm
• Concentrations can be measured to ± 0.1 mg/l
Hydrology Project Training Module File: “ 35 Emission Spectroscopy and Nephelometry.doc” Version 23/02/00 Page 14
Emission Spectroscopy: Measurement (2)
• Make series of standard solutions, known concentrations
• Set flame photometer to correct λ
• Measure emission intensity of standards
• Plot calibration curve: Intensity vs. Concentration
Hydrology Project Training Module File: “ 35 Emission Spectroscopy and Nephelometry.doc” Version 23/02/00 Page 15
Emission spectroscopy: Measurement (3)
• Calibration curve: Linear relation between Intensity &
Concentration
0
25
50
75
100
Concentration
RelativeIntensity
Hydrology Project Training Module File: “ 35 Emission Spectroscopy and Nephelometry.doc” Version 23/02/00 Page 16
Emission spectroscopy: Measurement (4)
• Measure Intensity (I) of unknown, read Concentration (C)
0
25
50
75
100
Concentration (C)
RelativeIntensity(I)
Hydrology Project Training Module File: “ 35 Emission Spectroscopy and Nephelometry.doc” Version 23/02/00 Page 17
Nephelometry & Turbidity (1)
• Turbidity is one of the basic measurements of water quality
• Turbid water looks dark or ‘dirty’
• Turbidity is an important consideration for many uses of water:
- potability of water
- use in industry
- ecology
Hydrology Project Training Module File: “ 35 Emission Spectroscopy and Nephelometry.doc” Version 23/02/00 Page 18
Nephelometry & Turbidity (2)
• Turbidity caused by suspended and colloidal particles in water
• Particles can be inorganic and organic:
- clay, silt, mud, silica, rust, calcium carbonate, algae, bacteria,
organic material
• Particles absorb and scatter light
• Turbidimetry and Nephelometry are two (similar) methods to
measure turbidity
Hydrology Project Training Module File: “ 35 Emission Spectroscopy and Nephelometry.doc” Version 23/02/00 Page 19
Nephelometry & Turbidity (3)
• In Turbidimetry, light passing through a sample is measured
- Instrument used is a ‘Turbidimeter’
- A spectrophotometer or photometer can be used as a
turbidimeter to measure light transmission/absorbance at
λ = 420 nm
Hydrology Project Training Module File: “ 35 Emission Spectroscopy and Nephelometry.doc” Version 23/02/00 Page 20
Nephelometry & Turbidity (4)
• In Nephelometry, the light Scattered by the suspended
particles in a sample is measured
- Instrument used is a ‘Nephelometer’ or ‘Nephelometric
Turbidimeter’
- Nephelometry is more sensitive for very dilute suspentions
Hydrology Project Training Module File: “ 35 Emission Spectroscopy and Nephelometry.doc” Version 23/02/00 Page 21
Nephelometry & Turbidity (5)
Light Source
Slit
Sample
Phototube Measuring
Transmitted Light
Turbidimeter Nephelometer
Phototube
Measuring
Scattered Light
Hydrology Project Training Module File: “ 35 Emission Spectroscopy and Nephelometry.doc” Version 23/02/00 Page 22
Nephelometry & Turbidity: Units
• Basic unit of turbidity is Nephelometric Turbidity Unit (NTU)
• NTU has replaced previous unit of ‘Jackson candle turbidity
units’ (JTU)
• Formazin suspensions are used as a standard for calibration
• Formazin particles have uniform size and shape
Hydrology Project Training Module File: “ 35 Emission Spectroscopy and Nephelometry.doc” Version 23/02/00 Page 23
Nephelometry & Turbidity: Typical Values
Water Type NTU
Surface Water (Rainy season) 1000 and above
Treated tap water 1 to 2
De-mineralised water 0.1 to 0.5
Water filtered through membrane
filter
0.05 or less
Hydrology Project Training Module File: “ 35 Emission Spectroscopy and Nephelometry.doc” Version 23/02/00 Page 24
Nephelometry: Interferences
• All dust, dirt, scratches or finger marks on the instrument will
interfere with the measurements
• Instrument components and sample tubes must be kept dry
and clean
Hydrology Project Training Module File: “ 35 Emission Spectroscopy and Nephelometry.doc” Version 23/02/00 Page 25
5. Evaluation sheets
Hydrology Project Training Module File: “ 35 Emission Spectroscopy and Nephelometry.doc” Version 23/02/00 Page 26
Hydrology Project Training Module File: “ 35 Emission Spectroscopy and Nephelometry.doc” Version 23/02/00 Page 27
6. Handout
Hydrology Project Training Module File: “ 35 Emission Spectroscopy and Nephelometry.doc” Version 23/02/00 Page 28
Emission spectroscopy and nephelometry
• Emission spectroscopy and Nephelometry are 2 common analytical methods
• Both methods rely on measurement of light
• In Emission spectroscopy, the light Emitted by heated metal atoms in vapourised
water
• In Nephelometry, the light Scattered by particles in water is measured
• Nephelometry is related to ‘Turbidimetry’
Emission spectroscopy
• Flame emission spectroscopy:
- Also known as ‘Atomic Emission Spectroscopy’
- Also known as ‘Flame Photometry’
• Primarily used in the determination of alkali metals: K+
, Na+
• Other metals which can be measured: Ca++
, Mg++
, Sr++
Emission spectroscopy: Principle (1)
• Many metallic elements will emit a characteristic radiation, when subjected to
suitable excitation (e.g. flame)
• The Intensity of emitted radiation, at some particular wavelength, can be
correlated to the amount of element present
Emission spectroscopy: Principle (2)
- Liquid sample is sucked into instrument
- Metal salts get vaporised (‘atomized’)
- Metals atoms are excited by energy of the flame
- Excited atoms emit radiation characteristic of the metal
- Intensity of radiation increases with concentration of element
- Linear relation between intensity & concentration
Emission spectroscopy: Principle (3)
• Emitted radiation is measured:
- Emitted radiation passes through lens and optical filter
- Photocell reads the characteristic radiation
- Amplifier & digital read-out of radiation intensity
Hydrology Project Training Module File: “ 35 Emission Spectroscopy and Nephelometry.doc” Version 23/02/00 Page 29
Emission spectroscopy: Instrument (2)
• The Atomiser:
- stream of air is blown across the opening to the sample inlet jet, creates
suction in central tube
- sample is drawn to the air stream and a fine mist is formed
• The Flame:
- Typically acetylene gas together with air
• Sensor:
- Lens, slit, filter, photocell, amplifier and read-out
Emission spectroscopy: Measurement (1)
• For Na+
and K+
the spectra are simple, consisting of a few wavelengths
• Na+
produce a characteristic yellow emission at 589 nm,
• Concentrations can be measured to ± 1 mg/l
• K+
produce a characteristic emission at 766.5 nm
• Concentrations can be measured to ± 0.1 mg/l
Emission Spectroscopy: Measurement (2)
• Make series of standard solutions, known concentrations
• Set flame photometer to correct λ
• Measure emission intensity of standards
• Plot calibration curve: Intensity vs. Concentration
Emission spectroscopy: Measurement (3)
• Calibration curve: Linear relation between Intensity & Concentration
Emission spectroscopy: Measurement (4)
• Measure Intensity (I) of unknown, read Concentration (C)
Nephelometry & Turbidity (1)
• Turbidity is one of the basic measurements of water quality
• Turbid water looks dark or ‘dirty’
• Turbidity is an important consideration for many uses of water:
- potability of water
- use in industry
- ecology
Nephelometry & Turbidity (2)
• Turbidity caused by suspended and colloidal particles in water
• Particles can be inorganic and organic:
- clay, silt, mud, silica, rust, calcium carbonate, algae, bacteria, organic
material
• Particles absorb and scatter light
• Turbidimetry and Nephelometry are two (similar) methods to measure turbidity
Hydrology Project Training Module File: “ 35 Emission Spectroscopy and Nephelometry.doc” Version 23/02/00 Page 30
Nephelometry & Turbidity (3)
• In Turbidimetry, light passing through a sample is measured
- Instrument used is a ‘Turbidimeter’
- A spectrophotometer or photometer can be used as a turbidimeter to
measure light transmission/absorbance at
λ = 420 nm
Nephelometry & Turbidity (4)
• In Nephelometry, the light Scattered by the suspended particles in a sample is
measured
- Instrument used is a ‘Nephelometer’ or ‘Nephelometric Turbidimeter’
- Nephelometry is more sensitive for very dilute suspentions
Nephelometry & Turbidity: Units
• Basic unit of turbidity is Nephelometric Turbidity Unit (NTU)
• NTU has replaced previous unit of ‘Jackson candle turbidity units’ (JTU)
• Formazin suspensions are used as a standard for calibration
• Formazin particles have uniform size and shape
Nephelometry & Turbidity: Typical Values
Water Type NTU
Surface Water (Rainy season) 1000 and above
Treated tap water 1 to 2
De-mineralised water 0.1 to 0.5
Water filtered through membrane filter 0.05 or less
Nephelometry: Interferences
• All dust, dirt, scratches or finger marks on the instrument will interfere with the
measurements
• Instrument components and sample tubes must be kept dry and clean
Hydrology Project Training Module File: “ 35 Emission Spectroscopy and Nephelometry.doc” Version 23/02/00 Page 31
Add copy of Main text in chapter 8, for all participants.
Hydrology Project Training Module File: “ 35 Emission Spectroscopy and Nephelometry.doc” Version 23/02/00 Page 32
7. Additional handout
These handouts are distributed during delivery and contain test questions, answers to
questions, special worksheets, optional information, and other matters you would not like to
be seen in the regular handouts.
It is a good practice to pre-punch these additional handouts, so the participants can easily
insert them in the main handout folder.
Hydrology Project Training Module File: “ 35 Emission Spectroscopy and Nephelometry.doc” Version 23/02/00 Page 33
Hydrology Project Training Module File: “ 35 Emission Spectroscopy and Nephelometry.doc” Version 23/02/00 Page 34
8. Main text
Contents
1. Introduction 1
2. Atomic emission spectroscopy 1
3. Nephelometry & Turbidimetry 3
Hydrology Project Training Module File: “ 35 Emission Spectroscopy and Nephelometry.doc” Version 23/02/00 Page 1
Emission Spectroscopy and Nephelometry
1. Introduction
Atomic emission spectroscopy and nephelometry are two different methods which can be
used to measure chemical substances in water samples. Both methods rely on the
measurement of light.
Atomic emission spectroscopy
In emission spectroscopy, the light radiation emitted by metal atoms when heated in a flame
is measured. If a solution containing a metallic salt (or some other metallic compound) is
aspirated into a flame (e.g. of acetylene burning in air), a vapour which contains atoms of the
metal may be formed. Some of these gaseous metal atoms may be raised to an energy
level which is sufficiently high to permit the emission of radiation characteristic of the metal,
e.g. the characteristic yellow colour imparted to flames by compounds of sodium. This is the
basis of atomic flame emission spectroscopy, which is also referred to as flame emission
spectroscopy (FES) or flame photometry.
Atomic emission spectroscopy is used in the determination of alkali metals as they are
excited by the relatively low excitation energy of the flame. Sodium and Potassium are more
frequently determined because of their importance in aquatic and biological systems.
Turbidimetery and Nephelometry
In Nephelometry, the light scattered by particles in water is measured. Suspension of
particles in water interfering with passage of light is called turbidity. The turbidity of a sample
may be measured either by its effect on the scattering of light, which is termed
‘Nephelometery’, or by its effect on transmission of light, which is termed ‘Turbidimetery’.
These methods use common electric photometers to measure light intensity. Nephelometric
measurement is more sensitive for very dilute solutions, but for moderately heavy turbidity,
either this or turbidimetric measurements can be made.
In turbidimetry, the amount of light passing through a solution is measured. The higher the
turbidity, the smaller the quantity of light transmitted.
In nephelometry, on the other hand, the detecting cell is placed at right angles to the light
source to measure light scattered by the turbidity particles.
2. Atomic emission spectroscopy
Atomic emission spectroscopy is also known as ‘Flame Emission Spectroscopy’ or ‘Flame
Photometry’. The instrument used for analysis is commonly known as the ‘Flame
Photometer’. The method is used primarily for analysis of alkali metals (K+
and Na+
). Other
metals can be measured with emission spectroscopy, such as Ca+2
, Mg+2
, Sr+2
, though
alternative methods may be better.
Although flame spectroscopy was first studied by in 1860, it was established in 1930 as an
important analytical method for the determination of alkali metals.
It is known that many elements under suitable excitation emit radiations of characteristic
wavelength. This fact is utilised in the familiar qualitative flame test for the alkali and alkaline
earth elements. For these elements, such as sodium and potassium, the spectra are simple,
consisting of only a few wavelengths.
Hydrology Project Training Module File: “ 35 Emission Spectroscopy and Nephelometry.doc” Version 23/02/00 Page 2
General Principle
The general principle of the analysis is that many metallic elements will emit a characteristic
radiation when subjected to a suitable excitation (e.g. flame).
Quantitative analysis with the spectrograph is based on an empirical relation between the
intensity (power) of the emitted radiation of some particular wavelength and the quantity of
the corresponding elements in the sample.
General Method of Analysis
The basic diagram of a flame photometer is shown in Figure1. In this method of analysis,
first an emission radiation is created:
• the solution being tested is first sucked into the instrument
• In the atomiser, air at a certain pressure is blown in. Two types of atomisers are
available: Right angle type, and Concentric type. In both atomisers, a stream of air is
blown across the opening of the sample inlet jet, creating a suction. The sample is
drawn into the air stream, where it forms a fine mist. The sample is broken into fine
particles and the metal salts get vaporised ( atomised )
• Particles get carried with the compressed air towards to the mixing chamber. Here the
compressed air carrying metal particles is mixed with the fuel gas. Fuel gas is typically
acetylene. Ordinary cooking gas may also be used.
• The fuel gas mixture is fed into the burner for producing the flame.
• In the flame the metal particles emit radiation, producing a colour whose wavelength is
characteristic of the element present in the sample. The intensity of the radiation varies
with the concentration of the metallic ions in the solution.
After the radiation is emitted, it must then be measured:
• Radiation from the flame passes through a lens, a slit, a optical filter and falls on the
photocell. The lens and filter isolate the particular wavelength characteristic of the metal
ions being measured.
• The photocell measures the characteristic radiation.
• Amplifier and digital read-out give the radiation intensity
Specific Analysis: Na+
and K+
Sodium and Potassium are routinely analysed with Emission Spectroscopy. For these
elements, the emission spectra are simple, consisting of a few wavelengths:
• Na is determined at λ = 589 nm; concentrations can be measured to ± 1 mg/l.
• K is determined at λ =766.5 nm; concentrations can be measured to ± 0.1 mg/l.
Procedure:
1. Make a series of standard solutions, of known concentrations.
2. Set Flame Photometer to correct λ
3. Measure the emission intensity of the standards
4. Plot a standard curve: Intensity vs. Concentration
5. Measure intensity of unknowns, then read concentration from standard curve (Figure 2)
Hydrology Project Training Module File: “ 35 Emission Spectroscopy and Nephelometry.doc” Version 23/02/00 Page 3
Figure 1: The main components of the Flame Photometer
(a) (b)
Figure 2: (a): a standard curve showing linear relation of emitted light intensity (I)
with sample concentration (C)
(b): Reading the concentrations of an unknown using the standard curve
after measuring the intensity
Interferences
At high concentrations of solutes, the analysis can be influenced by the composition of
sample solutions. The concomitant elements may act upon the intensity of emission of test
elements. It is seen that the emission intensity of any alkali metal increases in the presence
of other alkali metals. Specifically, high concentrations of calcium and potassium can
interfere with sodium analyses. High concentrations of calcium, magnesium and sodium can
interfere with potassium analyses. Normally such interferences are not a problem. If such
high concentrations of interfering ions are present, special analytical procedures can be
followed, such as adding a “Radiation Buffer”.
3. Nephelometry & Turbidimetry
Turbidity is one of the basic measurements of water quality, such as colour, odour, and
temperature. Turbid water looks dark, and ‘dirty’. This is caused by the presence of
suspended and colloidal substances of various origin like clay, silt, mud, silica, rust, calcium
carbonate as well as microscopic aquatic organisms like algae, and bacteria.
Mixing Chamber Atomiser
Sample
AIR
DRAIN
LEN FILTER PHOTOCELLFLAME
BURNER
Amplifier
and
Read-out
0
25
50
75
100
Concentration
RelativeIntensity
0
25
50
75
100
Concentration
RelativeIntensity
Hydrology Project Training Module File: “ 35 Emission Spectroscopy and Nephelometry.doc” Version 23/02/00 Page 4
Analysis of Turbidity
Turbidity is caused by suspension of particles in water, interfering with passage of light. The
turbidity of a sample may be measured either by its effect on the transmission of light, which
is termed turbidimetery, or by its effect on the scattering of light, which is termed
Nephelometery.
The analytical methods employ common electric photometers that can measure light
intensity (Figure 3). The turbidimeter or nephelometer mainly consists of four parts – light
source, optical components (e.g. slit), sample compartment and a photocell for the
measurement of light either transmitted through the sample or scattered from the suspended
particles in the sample. The photocell detects light and an electronic amplifier measures the
light intensities.
In Turbidimetry, the amount of light passing through a solution is measured. The higher the
turbidity, the smaller the quantity of light transmitted (i.e. more light is absorbed). Any
spectrophotometer or photometer can be used as a turbidimeter, without modification. Since
property concerns visible light the measurement is commonly carried out at 420 nm.
In nephelometry, on the other hand, the detecting cell is placed at right angles to the light
source, to measure light scattered by particles. The intensity of the scattered light serves as
a measure of the turbidity. The instrument is called a ‘Nephelometer’ or a ‘Nephelometric
Turbidimeter’. A spectrophotometer can be used, however, a special attachment is required
for nephelometry.
Nephelometric measurement is more sensitive for very dilute suspensions and low turbidity
caused by fine particles (colloidal solutions). For moderately heavy turbidity, either this or
turbidimetric measurements can be made.
Figure 3 Diagram of Turbidity analysis by ‘Turbidimetry’ or ‘Nephelometry’
Measurement of turbidity based on visual methods, such as Jackson's candle turbidimeter,
although simple and cheaper, is not sensitive for low turbidities. The accuracy of visual
instruments is also limited and depends upon the skill of the user’s eye.
Light Source
Slit
Sample
Phototube Measuring
Transmitted Light
Turbidimeter Nephelometer
Phototube
Measuring
Scattered Light
Hydrology Project Training Module File: “ 35 Emission Spectroscopy and Nephelometry.doc” Version 23/02/00 Page 5
Significance of Turbidity Measurements
Turbidity is an important factor for many uses of water:
• potability: The turbidity is connected with potability of water directly, indirectly or
aesthetically. High turbidity is generally associated with polluted water. Turbidity
measurement is very important in deciding the quality of water samples. In fact, the
turbidity is taken as an indicator for efficiency and performance of coagulation,
flocculation, sedimentation and filtration processes of water treatment plants.
• use in industry: The turbidity of water being used in industry is also an important
consideration in quality control for industries manufacturing chemicals, cosmetics, food
products, beverages, etc.
• ecology: many aquatic animals and plants need clear water to survive. Turbidity is
therefore damaging to ecology.
Turbidity Units
The standard Turbidity unit is called Nephelometric Turbidity Unit (NTU) because of the use
of nephelometric method of measurement. The NTU has generally replaced the previous
unit of ‘Jackson candle turbidity units (JTU).
Typical turbidity values for different waters are given in Table 1
Table 1 Typical Turbidity Values for different waters
Type of water NTU
Surface Water (Rainy season) 1000 and above
Treated tap water 1 to 2
De-mineralised water 0.1 to 0.5
Water filtered through membrane filter 0.05 or less
Calibration of Instrument and Measurement of Turbidity
Formazine is used as turbidity standard for calibration because it possesses the desired
properties which other standards do not have. Formazin particles have uniform size and
shape. Formazin can be synthesised and has reproducibility of one percent. Formazin stock
solution has good stability (up to 1 year), thus making it an ideal turbidity standard.
Calibration is made in NTU, the standard units of measurement.
Procedures for preparation of formazin stock standard, 4000 NTU, are in the Guidelines for
Standard Analytical Procedures for Water Analysis. For each use, the dilute standards are
prepared from stock solution, and the nephelometer must be calibrated according to
manufacturer’s operating instructions.
Interferences in Nephelometry:
Nephelometry is based on measuring light intensity. Several factors can interfere with the
measurements:
• Dirty glassware
• Air bubbles in the sample
• Vibration that disturbs the surface visibility
• Colour of the sample
Hydrology Project Training Module File: “ 35 Emission Spectroscopy and Nephelometry.doc” Version 23/02/00 Page 6
Maintenance :
Cleanliness is of utmost importance in all turbidity measurements. All the glass and optical
parts must be protected from dust and scratches. Even the finger marks on the sample tube
bottoms, mirror, source lamps and reflectors may disturb the measurement, accuracy and
calibration. To prevent the polish bottoms of the sample tubes and plungers from scratching,
it is advisable to keep these items on a soft cloth or tissue paper when not in use.
The sample tubes and condensing lenses etc may be washed with mild detergent and rinsed
with distilled water. The filters and mirrors may be cleaned using a soft tissue paper or air
syringe and may be wiped occasionally with a soft tissue soaked with distilled water or mild
detergent. Never immerse these items in water or cleaning solutions. Also wipe the outside
of the sample tube before placing into the housing; otherwise it may keep the mirror wet for
long time and damage it permanently.

More Related Content

Similar to Download-manuals-water quality-wq-manuals-35emissionspectroscopyandnephelometry

Download-manuals-water quality-wq-manuals-33useofionselectiveprobes
 Download-manuals-water quality-wq-manuals-33useofionselectiveprobes Download-manuals-water quality-wq-manuals-33useofionselectiveprobes
Download-manuals-water quality-wq-manuals-33useofionselectiveprobeshydrologyproject0
 
Download-manuals-water quality-wq-manuals-32potentiometricanalysisofwaterqua...
 Download-manuals-water quality-wq-manuals-32potentiometricanalysisofwaterqua... Download-manuals-water quality-wq-manuals-32potentiometricanalysisofwaterqua...
Download-manuals-water quality-wq-manuals-32potentiometricanalysisofwaterqua...hydrologyproject0
 
Download-manuals-water quality-wq-training-37measurementofoxidisednitrogen
 Download-manuals-water quality-wq-training-37measurementofoxidisednitrogen Download-manuals-water quality-wq-training-37measurementofoxidisednitrogen
Download-manuals-water quality-wq-training-37measurementofoxidisednitrogenhydrologyproject0
 
Download-manuals-water quality-wq-training-39howtomeasureammonianirogen
 Download-manuals-water quality-wq-training-39howtomeasureammonianirogen Download-manuals-water quality-wq-training-39howtomeasureammonianirogen
Download-manuals-water quality-wq-training-39howtomeasureammonianirogenhydrologyproject0
 
Download-manuals-water quality-wq-training-38measurementofammoniaandorganicn...
 Download-manuals-water quality-wq-training-38measurementofammoniaandorganicn... Download-manuals-water quality-wq-training-38measurementofammoniaandorganicn...
Download-manuals-water quality-wq-training-38measurementofammoniaandorganicn...hydrologyproject0
 
Download-manuals-water quality-wq-training-40measurementofchlorophyll-a
 Download-manuals-water quality-wq-training-40measurementofchlorophyll-a Download-manuals-water quality-wq-training-40measurementofchlorophyll-a
Download-manuals-water quality-wq-training-40measurementofchlorophyll-ahydrologyproject0
 
Download-manuals-water quality-wq-training-08understandingec
 Download-manuals-water quality-wq-training-08understandingec Download-manuals-water quality-wq-training-08understandingec
Download-manuals-water quality-wq-training-08understandingechydrologyproject0
 
Download-manuals-water quality-wq-training-30advancedaquaticchemistry
 Download-manuals-water quality-wq-training-30advancedaquaticchemistry Download-manuals-water quality-wq-training-30advancedaquaticchemistry
Download-manuals-water quality-wq-training-30advancedaquaticchemistryhydrologyproject0
 
Download-manuals-water quality-wq-training-41measurementofphosphorus
 Download-manuals-water quality-wq-training-41measurementofphosphorus Download-manuals-water quality-wq-training-41measurementofphosphorus
Download-manuals-water quality-wq-training-41measurementofphosphorushydrologyproject0
 
Download-manuals-water quality-wq-training-02basicchemistryconcepts
 Download-manuals-water quality-wq-training-02basicchemistryconcepts Download-manuals-water quality-wq-training-02basicchemistryconcepts
Download-manuals-water quality-wq-training-02basicchemistryconceptshydrologyproject0
 
Download-manuals-water quality-wq-training-44howtomeasuresodium
 Download-manuals-water quality-wq-training-44howtomeasuresodium Download-manuals-water quality-wq-training-44howtomeasuresodium
Download-manuals-water quality-wq-training-44howtomeasuresodiumhydrologyproject0
 
Download-manuals-water quality-wq-manuals-11chemistryofdomeasurement
 Download-manuals-water quality-wq-manuals-11chemistryofdomeasurement Download-manuals-water quality-wq-manuals-11chemistryofdomeasurement
Download-manuals-water quality-wq-manuals-11chemistryofdomeasurementhydrologyproject0
 
Analytical Chemistry - Principles and Practice.pdf
Analytical Chemistry - Principles and Practice.pdfAnalytical Chemistry - Principles and Practice.pdf
Analytical Chemistry - Principles and Practice.pdfANAYNALLELYLAPON
 
Download-manuals-water quality-wq-training-18understandingcodtest
 Download-manuals-water quality-wq-training-18understandingcodtest Download-manuals-water quality-wq-training-18understandingcodtest
Download-manuals-water quality-wq-training-18understandingcodtesthydrologyproject0
 
Download-manuals-surface water-waterlevel-41howtoanalysedischargedata
 Download-manuals-surface water-waterlevel-41howtoanalysedischargedata Download-manuals-surface water-waterlevel-41howtoanalysedischargedata
Download-manuals-surface water-waterlevel-41howtoanalysedischargedatahydrologyproject001
 
Download-manuals-water quality-wq-training-25oxygenbalanceinsurfacewaters
 Download-manuals-water quality-wq-training-25oxygenbalanceinsurfacewaters Download-manuals-water quality-wq-training-25oxygenbalanceinsurfacewaters
Download-manuals-water quality-wq-training-25oxygenbalanceinsurfacewatershydrologyproject0
 
Download-manuals-water quality-wq-training-19howtomeasurecod
 Download-manuals-water quality-wq-training-19howtomeasurecod Download-manuals-water quality-wq-training-19howtomeasurecod
Download-manuals-water quality-wq-training-19howtomeasurecodhydrologyproject0
 
Download-manuals-water quality-wq-training-36measurementoffluoride
 Download-manuals-water quality-wq-training-36measurementoffluoride Download-manuals-water quality-wq-training-36measurementoffluoride
Download-manuals-water quality-wq-training-36measurementoffluoridehydrologyproject0
 
Download-manuals-water quality-wq-training-50inter-laboratoryaqcexercise
 Download-manuals-water quality-wq-training-50inter-laboratoryaqcexercise Download-manuals-water quality-wq-training-50inter-laboratoryaqcexercise
Download-manuals-water quality-wq-training-50inter-laboratoryaqcexercisehydrologyproject0
 

Similar to Download-manuals-water quality-wq-manuals-35emissionspectroscopyandnephelometry (20)

Download-manuals-water quality-wq-manuals-33useofionselectiveprobes
 Download-manuals-water quality-wq-manuals-33useofionselectiveprobes Download-manuals-water quality-wq-manuals-33useofionselectiveprobes
Download-manuals-water quality-wq-manuals-33useofionselectiveprobes
 
Download-manuals-water quality-wq-manuals-32potentiometricanalysisofwaterqua...
 Download-manuals-water quality-wq-manuals-32potentiometricanalysisofwaterqua... Download-manuals-water quality-wq-manuals-32potentiometricanalysisofwaterqua...
Download-manuals-water quality-wq-manuals-32potentiometricanalysisofwaterqua...
 
Download-manuals-water quality-wq-training-37measurementofoxidisednitrogen
 Download-manuals-water quality-wq-training-37measurementofoxidisednitrogen Download-manuals-water quality-wq-training-37measurementofoxidisednitrogen
Download-manuals-water quality-wq-training-37measurementofoxidisednitrogen
 
Download-manuals-water quality-wq-training-37measurementofoxidisednitrogen
 Download-manuals-water quality-wq-training-37measurementofoxidisednitrogen Download-manuals-water quality-wq-training-37measurementofoxidisednitrogen
Download-manuals-water quality-wq-training-37measurementofoxidisednitrogen
 
Download-manuals-water quality-wq-training-39howtomeasureammonianirogen
 Download-manuals-water quality-wq-training-39howtomeasureammonianirogen Download-manuals-water quality-wq-training-39howtomeasureammonianirogen
Download-manuals-water quality-wq-training-39howtomeasureammonianirogen
 
Download-manuals-water quality-wq-training-38measurementofammoniaandorganicn...
 Download-manuals-water quality-wq-training-38measurementofammoniaandorganicn... Download-manuals-water quality-wq-training-38measurementofammoniaandorganicn...
Download-manuals-water quality-wq-training-38measurementofammoniaandorganicn...
 
Download-manuals-water quality-wq-training-40measurementofchlorophyll-a
 Download-manuals-water quality-wq-training-40measurementofchlorophyll-a Download-manuals-water quality-wq-training-40measurementofchlorophyll-a
Download-manuals-water quality-wq-training-40measurementofchlorophyll-a
 
Download-manuals-water quality-wq-training-08understandingec
 Download-manuals-water quality-wq-training-08understandingec Download-manuals-water quality-wq-training-08understandingec
Download-manuals-water quality-wq-training-08understandingec
 
Download-manuals-water quality-wq-training-30advancedaquaticchemistry
 Download-manuals-water quality-wq-training-30advancedaquaticchemistry Download-manuals-water quality-wq-training-30advancedaquaticchemistry
Download-manuals-water quality-wq-training-30advancedaquaticchemistry
 
Download-manuals-water quality-wq-training-41measurementofphosphorus
 Download-manuals-water quality-wq-training-41measurementofphosphorus Download-manuals-water quality-wq-training-41measurementofphosphorus
Download-manuals-water quality-wq-training-41measurementofphosphorus
 
Download-manuals-water quality-wq-training-02basicchemistryconcepts
 Download-manuals-water quality-wq-training-02basicchemistryconcepts Download-manuals-water quality-wq-training-02basicchemistryconcepts
Download-manuals-water quality-wq-training-02basicchemistryconcepts
 
Download-manuals-water quality-wq-training-44howtomeasuresodium
 Download-manuals-water quality-wq-training-44howtomeasuresodium Download-manuals-water quality-wq-training-44howtomeasuresodium
Download-manuals-water quality-wq-training-44howtomeasuresodium
 
Download-manuals-water quality-wq-manuals-11chemistryofdomeasurement
 Download-manuals-water quality-wq-manuals-11chemistryofdomeasurement Download-manuals-water quality-wq-manuals-11chemistryofdomeasurement
Download-manuals-water quality-wq-manuals-11chemistryofdomeasurement
 
Analytical Chemistry - Principles and Practice.pdf
Analytical Chemistry - Principles and Practice.pdfAnalytical Chemistry - Principles and Practice.pdf
Analytical Chemistry - Principles and Practice.pdf
 
Download-manuals-water quality-wq-training-18understandingcodtest
 Download-manuals-water quality-wq-training-18understandingcodtest Download-manuals-water quality-wq-training-18understandingcodtest
Download-manuals-water quality-wq-training-18understandingcodtest
 
Download-manuals-surface water-waterlevel-41howtoanalysedischargedata
 Download-manuals-surface water-waterlevel-41howtoanalysedischargedata Download-manuals-surface water-waterlevel-41howtoanalysedischargedata
Download-manuals-surface water-waterlevel-41howtoanalysedischargedata
 
Download-manuals-water quality-wq-training-25oxygenbalanceinsurfacewaters
 Download-manuals-water quality-wq-training-25oxygenbalanceinsurfacewaters Download-manuals-water quality-wq-training-25oxygenbalanceinsurfacewaters
Download-manuals-water quality-wq-training-25oxygenbalanceinsurfacewaters
 
Download-manuals-water quality-wq-training-19howtomeasurecod
 Download-manuals-water quality-wq-training-19howtomeasurecod Download-manuals-water quality-wq-training-19howtomeasurecod
Download-manuals-water quality-wq-training-19howtomeasurecod
 
Download-manuals-water quality-wq-training-36measurementoffluoride
 Download-manuals-water quality-wq-training-36measurementoffluoride Download-manuals-water quality-wq-training-36measurementoffluoride
Download-manuals-water quality-wq-training-36measurementoffluoride
 
Download-manuals-water quality-wq-training-50inter-laboratoryaqcexercise
 Download-manuals-water quality-wq-training-50inter-laboratoryaqcexercise Download-manuals-water quality-wq-training-50inter-laboratoryaqcexercise
Download-manuals-water quality-wq-training-50inter-laboratoryaqcexercise
 

More from hydrologyproject0

More from hydrologyproject0 (20)

Specification purewater
Specification purewaterSpecification purewater
Specification purewater
 
Water purifier ion exchange resin column
Water purifier ion exchange resin columnWater purifier ion exchange resin column
Water purifier ion exchange resin column
 
Water purifier, double distillation unit
Water purifier, double distillation unitWater purifier, double distillation unit
Water purifier, double distillation unit
 
Water purifier, distillation unit (automatic)
Water purifier, distillation unit (automatic)Water purifier, distillation unit (automatic)
Water purifier, distillation unit (automatic)
 
Water geyser (heater)
Water geyser (heater)Water geyser (heater)
Water geyser (heater)
 
Water bath, general purpose
Water bath, general purposeWater bath, general purpose
Water bath, general purpose
 
Water bath, bacteriological
Water bath, bacteriologicalWater bath, bacteriological
Water bath, bacteriological
 
Wash bottle
Wash bottleWash bottle
Wash bottle
 
Volumetric flask
Volumetric flaskVolumetric flask
Volumetric flask
 
Visual accumulation tube
Visual accumulation tubeVisual accumulation tube
Visual accumulation tube
 
Vacuum pump
Vacuum pumpVacuum pump
Vacuum pump
 
Turbidity meter (nephelometer)
Turbidity meter (nephelometer)Turbidity meter (nephelometer)
Turbidity meter (nephelometer)
 
Tool kit
Tool kitTool kit
Tool kit
 
Toc analyser, microprocessor controlled
Toc analyser, microprocessor controlledToc analyser, microprocessor controlled
Toc analyser, microprocessor controlled
 
Tissue grinder
Tissue grinderTissue grinder
Tissue grinder
 
Thermometers, set of
Thermometers, set ofThermometers, set of
Thermometers, set of
 
Test tubes
Test tubesTest tubes
Test tubes
 
Test sieves with shaker
Test sieves with shakerTest sieves with shaker
Test sieves with shaker
 
Stirrer, magnetic (with hot plate)
Stirrer, magnetic (with hot plate)Stirrer, magnetic (with hot plate)
Stirrer, magnetic (with hot plate)
 
Sterliser, autoclave
Sterliser, autoclaveSterliser, autoclave
Sterliser, autoclave
 

Recently uploaded

Dev Dives: Streamline document processing with UiPath Studio Web
Dev Dives: Streamline document processing with UiPath Studio WebDev Dives: Streamline document processing with UiPath Studio Web
Dev Dives: Streamline document processing with UiPath Studio WebUiPathCommunity
 
"Subclassing and Composition – A Pythonic Tour of Trade-Offs", Hynek Schlawack
"Subclassing and Composition – A Pythonic Tour of Trade-Offs", Hynek Schlawack"Subclassing and Composition – A Pythonic Tour of Trade-Offs", Hynek Schlawack
"Subclassing and Composition – A Pythonic Tour of Trade-Offs", Hynek SchlawackFwdays
 
Designing IA for AI - Information Architecture Conference 2024
Designing IA for AI - Information Architecture Conference 2024Designing IA for AI - Information Architecture Conference 2024
Designing IA for AI - Information Architecture Conference 2024Enterprise Knowledge
 
Scanning the Internet for External Cloud Exposures via SSL Certs
Scanning the Internet for External Cloud Exposures via SSL CertsScanning the Internet for External Cloud Exposures via SSL Certs
Scanning the Internet for External Cloud Exposures via SSL CertsRizwan Syed
 
"Federated learning: out of reach no matter how close",Oleksandr Lapshyn
"Federated learning: out of reach no matter how close",Oleksandr Lapshyn"Federated learning: out of reach no matter how close",Oleksandr Lapshyn
"Federated learning: out of reach no matter how close",Oleksandr LapshynFwdays
 
My Hashitalk Indonesia April 2024 Presentation
My Hashitalk Indonesia April 2024 PresentationMy Hashitalk Indonesia April 2024 Presentation
My Hashitalk Indonesia April 2024 PresentationRidwan Fadjar
 
Tampa BSides - Chef's Tour of Microsoft Security Adoption Framework (SAF)
Tampa BSides - Chef's Tour of Microsoft Security Adoption Framework (SAF)Tampa BSides - Chef's Tour of Microsoft Security Adoption Framework (SAF)
Tampa BSides - Chef's Tour of Microsoft Security Adoption Framework (SAF)Mark Simos
 
My INSURER PTE LTD - Insurtech Innovation Award 2024
My INSURER PTE LTD - Insurtech Innovation Award 2024My INSURER PTE LTD - Insurtech Innovation Award 2024
My INSURER PTE LTD - Insurtech Innovation Award 2024The Digital Insurer
 
Developer Data Modeling Mistakes: From Postgres to NoSQL
Developer Data Modeling Mistakes: From Postgres to NoSQLDeveloper Data Modeling Mistakes: From Postgres to NoSQL
Developer Data Modeling Mistakes: From Postgres to NoSQLScyllaDB
 
AI as an Interface for Commercial Buildings
AI as an Interface for Commercial BuildingsAI as an Interface for Commercial Buildings
AI as an Interface for Commercial BuildingsMemoori
 
Advanced Test Driven-Development @ php[tek] 2024
Advanced Test Driven-Development @ php[tek] 2024Advanced Test Driven-Development @ php[tek] 2024
Advanced Test Driven-Development @ php[tek] 2024Scott Keck-Warren
 
Transcript: New from BookNet Canada for 2024: BNC CataList - Tech Forum 2024
Transcript: New from BookNet Canada for 2024: BNC CataList - Tech Forum 2024Transcript: New from BookNet Canada for 2024: BNC CataList - Tech Forum 2024
Transcript: New from BookNet Canada for 2024: BNC CataList - Tech Forum 2024BookNet Canada
 
Connect Wave/ connectwave Pitch Deck Presentation
Connect Wave/ connectwave Pitch Deck PresentationConnect Wave/ connectwave Pitch Deck Presentation
Connect Wave/ connectwave Pitch Deck PresentationSlibray Presentation
 
Powerpoint exploring the locations used in television show Time Clash
Powerpoint exploring the locations used in television show Time ClashPowerpoint exploring the locations used in television show Time Clash
Powerpoint exploring the locations used in television show Time Clashcharlottematthew16
 
Kotlin Multiplatform & Compose Multiplatform - Starter kit for pragmatics
Kotlin Multiplatform & Compose Multiplatform - Starter kit for pragmaticsKotlin Multiplatform & Compose Multiplatform - Starter kit for pragmatics
Kotlin Multiplatform & Compose Multiplatform - Starter kit for pragmaticscarlostorres15106
 
Leverage Zilliz Serverless - Up to 50X Saving for Your Vector Storage Cost
Leverage Zilliz Serverless - Up to 50X Saving for Your Vector Storage CostLeverage Zilliz Serverless - Up to 50X Saving for Your Vector Storage Cost
Leverage Zilliz Serverless - Up to 50X Saving for Your Vector Storage CostZilliz
 
Unleash Your Potential - Namagunga Girls Coding Club
Unleash Your Potential - Namagunga Girls Coding ClubUnleash Your Potential - Namagunga Girls Coding Club
Unleash Your Potential - Namagunga Girls Coding ClubKalema Edgar
 
Human Factors of XR: Using Human Factors to Design XR Systems
Human Factors of XR: Using Human Factors to Design XR SystemsHuman Factors of XR: Using Human Factors to Design XR Systems
Human Factors of XR: Using Human Factors to Design XR SystemsMark Billinghurst
 
Integration and Automation in Practice: CI/CD in Mule Integration and Automat...
Integration and Automation in Practice: CI/CD in Mule Integration and Automat...Integration and Automation in Practice: CI/CD in Mule Integration and Automat...
Integration and Automation in Practice: CI/CD in Mule Integration and Automat...Patryk Bandurski
 

Recently uploaded (20)

Dev Dives: Streamline document processing with UiPath Studio Web
Dev Dives: Streamline document processing with UiPath Studio WebDev Dives: Streamline document processing with UiPath Studio Web
Dev Dives: Streamline document processing with UiPath Studio Web
 
DMCC Future of Trade Web3 - Special Edition
DMCC Future of Trade Web3 - Special EditionDMCC Future of Trade Web3 - Special Edition
DMCC Future of Trade Web3 - Special Edition
 
"Subclassing and Composition – A Pythonic Tour of Trade-Offs", Hynek Schlawack
"Subclassing and Composition – A Pythonic Tour of Trade-Offs", Hynek Schlawack"Subclassing and Composition – A Pythonic Tour of Trade-Offs", Hynek Schlawack
"Subclassing and Composition – A Pythonic Tour of Trade-Offs", Hynek Schlawack
 
Designing IA for AI - Information Architecture Conference 2024
Designing IA for AI - Information Architecture Conference 2024Designing IA for AI - Information Architecture Conference 2024
Designing IA for AI - Information Architecture Conference 2024
 
Scanning the Internet for External Cloud Exposures via SSL Certs
Scanning the Internet for External Cloud Exposures via SSL CertsScanning the Internet for External Cloud Exposures via SSL Certs
Scanning the Internet for External Cloud Exposures via SSL Certs
 
"Federated learning: out of reach no matter how close",Oleksandr Lapshyn
"Federated learning: out of reach no matter how close",Oleksandr Lapshyn"Federated learning: out of reach no matter how close",Oleksandr Lapshyn
"Federated learning: out of reach no matter how close",Oleksandr Lapshyn
 
My Hashitalk Indonesia April 2024 Presentation
My Hashitalk Indonesia April 2024 PresentationMy Hashitalk Indonesia April 2024 Presentation
My Hashitalk Indonesia April 2024 Presentation
 
Tampa BSides - Chef's Tour of Microsoft Security Adoption Framework (SAF)
Tampa BSides - Chef's Tour of Microsoft Security Adoption Framework (SAF)Tampa BSides - Chef's Tour of Microsoft Security Adoption Framework (SAF)
Tampa BSides - Chef's Tour of Microsoft Security Adoption Framework (SAF)
 
My INSURER PTE LTD - Insurtech Innovation Award 2024
My INSURER PTE LTD - Insurtech Innovation Award 2024My INSURER PTE LTD - Insurtech Innovation Award 2024
My INSURER PTE LTD - Insurtech Innovation Award 2024
 
Developer Data Modeling Mistakes: From Postgres to NoSQL
Developer Data Modeling Mistakes: From Postgres to NoSQLDeveloper Data Modeling Mistakes: From Postgres to NoSQL
Developer Data Modeling Mistakes: From Postgres to NoSQL
 
AI as an Interface for Commercial Buildings
AI as an Interface for Commercial BuildingsAI as an Interface for Commercial Buildings
AI as an Interface for Commercial Buildings
 
Advanced Test Driven-Development @ php[tek] 2024
Advanced Test Driven-Development @ php[tek] 2024Advanced Test Driven-Development @ php[tek] 2024
Advanced Test Driven-Development @ php[tek] 2024
 
Transcript: New from BookNet Canada for 2024: BNC CataList - Tech Forum 2024
Transcript: New from BookNet Canada for 2024: BNC CataList - Tech Forum 2024Transcript: New from BookNet Canada for 2024: BNC CataList - Tech Forum 2024
Transcript: New from BookNet Canada for 2024: BNC CataList - Tech Forum 2024
 
Connect Wave/ connectwave Pitch Deck Presentation
Connect Wave/ connectwave Pitch Deck PresentationConnect Wave/ connectwave Pitch Deck Presentation
Connect Wave/ connectwave Pitch Deck Presentation
 
Powerpoint exploring the locations used in television show Time Clash
Powerpoint exploring the locations used in television show Time ClashPowerpoint exploring the locations used in television show Time Clash
Powerpoint exploring the locations used in television show Time Clash
 
Kotlin Multiplatform & Compose Multiplatform - Starter kit for pragmatics
Kotlin Multiplatform & Compose Multiplatform - Starter kit for pragmaticsKotlin Multiplatform & Compose Multiplatform - Starter kit for pragmatics
Kotlin Multiplatform & Compose Multiplatform - Starter kit for pragmatics
 
Leverage Zilliz Serverless - Up to 50X Saving for Your Vector Storage Cost
Leverage Zilliz Serverless - Up to 50X Saving for Your Vector Storage CostLeverage Zilliz Serverless - Up to 50X Saving for Your Vector Storage Cost
Leverage Zilliz Serverless - Up to 50X Saving for Your Vector Storage Cost
 
Unleash Your Potential - Namagunga Girls Coding Club
Unleash Your Potential - Namagunga Girls Coding ClubUnleash Your Potential - Namagunga Girls Coding Club
Unleash Your Potential - Namagunga Girls Coding Club
 
Human Factors of XR: Using Human Factors to Design XR Systems
Human Factors of XR: Using Human Factors to Design XR SystemsHuman Factors of XR: Using Human Factors to Design XR Systems
Human Factors of XR: Using Human Factors to Design XR Systems
 
Integration and Automation in Practice: CI/CD in Mule Integration and Automat...
Integration and Automation in Practice: CI/CD in Mule Integration and Automat...Integration and Automation in Practice: CI/CD in Mule Integration and Automat...
Integration and Automation in Practice: CI/CD in Mule Integration and Automat...
 

Download-manuals-water quality-wq-manuals-35emissionspectroscopyandnephelometry

  • 1. World Bank & Government of The Netherlands funded Training module # WQ - 35 Emission Spectroscopy and Nephelometry New Delhi, February 2000 CSMRS Building, 4th Floor, Olof Palme Marg, Hauz Khas, New Delhi – 11 00 16 India Tel: 68 61 681 / 84 Fax: (+ 91 11) 68 61 685 E-Mail: dhvdelft@del2.vsnl.net.in DHV Consultants BV & DELFT HYDRAULICS with HALCROW, TAHAL, CES, ORG & JPS
  • 2. Hydrology Project Training Module File: “ 35 Emission Spectroscopy and Nephelometry.doc” Version 23/02/00 Page 1 Table of contents Page 1. Module context 2 2. Module profile 3 3. Session plan 4 4. Overhead/flipchart master 5 5. Evaluation sheets 25 6. Handout 27 7. Additional handout 32 8. Main text 34
  • 3. Hydrology Project Training Module File: “ 35 Emission Spectroscopy and Nephelometry.doc” Version 23/02/00 Page 2 1. Module context This module introduces the principles of emission spectroscopy and nephelometry, and the instruments which are used for these analyses. Some other related modules are listed below. While designing a training course, the relationship between this module and the others, would be maintained by keeping them close together in the syllabus and place them in a logical sequence. The actual selection of the topics and the depth of training would, of course, depend on the training needs of the participants, i.e. their knowledge level and skills performance upon the start of the course. No. Module title Code Objectives 1. Basic water quality concepts WQ - 01 • water pollutants • ambient water quality standards • monitoring water quality 2. How to measure pH WQ - 07 • pH meter and electrodes • precautions 3. Use of Ion selective probes WQ - 33 • precautions required in use of ion selective probes. 4. Absorption Spectroscopy WQ - 34 • understand the principle of absorption spectroscopy • explain the use of absorption spectroscopy for chemical analyses
  • 4. Hydrology Project Training Module File: “ 35 Emission Spectroscopy and Nephelometry.doc” Version 23/02/00 Page 3 2. Module profile Title : Emission Spectroscopy and Nephelometry Target group : HIS function(s): Q2, Q3, Q5, Q6 Duration : One session of 60 min. Objectives : After the training the participants will be able to: • understand the principles of emission spectroscopy and nephelometry • explain how emission spectroscopy and nephelometry are used for specific laboratory analyses Key concepts : • emission spectroscopy • flame photometers • nephelometry and turbidimetry • turbidimeters • applications Training methods : Lecture, exercises, discussion, demonstration of equipment Training tools required : Board, flipchart, OHS Handouts : As provided in this module Further reading and references : • Chemistry for environmental engineers – C.N.Sawyer, P.L.McCarty & G.F.Parkin, McGraw – Hill, Inc, 1994 • Standard methods for the examination of water and wastewaters, AWWA, 19th edition, 1995
  • 5. Hydrology Project Training Module File: “ 35 Emission Spectroscopy and Nephelometry.doc” Version 23/02/00 Page 4 3. Session plan No Activities Time Tools 1 Preparations 2 Introduction: • Ask participants to state different instruments for water quality analysis • Explain reasons to use emission spectroscopy and nephelometry 10 min OHS 3 Flame photometers, theoretical concepts and definitions: • Basic instrument • Means of producing emission • Filter, photocell, galvanometer • Principle of sodium analysis 20 min OHS 4 Turbidimeter and nephelometer: • Difference between analyses, and instruments • significance of turbidity • instrument components • Principle of sulphate analysis 20 min OHS 5 Maintenance 5 min 6 Exercise 7 Wrap up and evaluation 5 min
  • 6. Hydrology Project Training Module File: “ 35 Emission Spectroscopy and Nephelometry.doc” Version 23/02/00 Page 5 4. Overhead/flipchart master OHS format guidelines Type of text Style Setting Headings: OHS-Title Arial 30-36, with bottom border line (not: underline) Text: OHS-lev1 OHS-lev2 Arial 24-26, maximum two levels Case: Sentence case. Avoid full text in UPPERCASE. Italics: Use occasionally and in a consistent way Listings: OHS-lev1 OHS-lev1-Numbered Big bullets. Numbers for definite series of steps. Avoid roman numbers and letters. Colours: None, as these get lost in photocopying and some colours do not reproduce at all. Formulas/Equat ions OHS-Equation Use of a table will ease horizontal alignment over more lines (columns) Use equation editor for advanced formatting only
  • 7. Hydrology Project Training Module File: “ 35 Emission Spectroscopy and Nephelometry.doc” Version 23/02/00 Page 6 Emission spectroscopy and nephelometry • Emission spectroscopy and Nephelometry are 2 common analytical methods • Both methods rely on measurement of light • In Emission spectroscopy, the light Emitted by heated metal atoms in vapourised water • In Nephelometry, the light Scattered by particles in water is measured • Nephelometry is related to ‘Turbidimetry’
  • 8. Hydrology Project Training Module File: “ 35 Emission Spectroscopy and Nephelometry.doc” Version 23/02/00 Page 7 Emission spectroscopy • Flame emission spectroscopy: - Also known as ‘Atomic Emission Spectroscopy’ - Also known as ‘Flame Photometry’ • Primarily used in the determination of alkali metals: K+ , Na+ • Other metals which can be measured: Ca++ , Mg++ , Sr++
  • 9. Hydrology Project Training Module File: “ 35 Emission Spectroscopy and Nephelometry.doc” Version 23/02/00 Page 8 Emission spectroscopy: Principle (1) • Many metallic elements will emit a characteristic radiation, when subjected to suitable excitation (e.g. flame) • The Intensity of emitted radiation, at some particular wavelength, can be correlated to the amount of element present
  • 10. Hydrology Project Training Module File: “ 35 Emission Spectroscopy and Nephelometry.doc” Version 23/02/00 Page 9 Emission spectroscopy: Principle (2) - Liquid sample is sucked into instrument - Metal salts get vaporised (‘atomized’) - Metals atoms are excited by energy of the flame - Excited atoms emit radiation characteristic of the metal - Intensity of radiation increases with concentration of element - Linear relation between intensity & concentration
  • 11. Hydrology Project Training Module File: “ 35 Emission Spectroscopy and Nephelometry.doc” Version 23/02/00 Page 10 Emission spectroscopy: Principle (3) • Emitted radiation is measured: - Emitted radiation passes through lens and optical filter - Photocell reads the characteristic radiation - Amplifier & digital read-out of radiation intensity
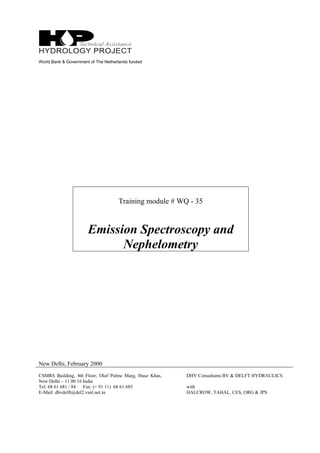
  • 12. Hydrology Project Training Module File: “ 35 Emission Spectroscopy and Nephelometry.doc” Version 23/02/00 Page 11 Emission spectroscopy: Instrument (1) Mixing Chamber Atomiser Sample GAS AIR DRAIN LENS FILTER PhotocellFLAME BURNER Amplifier and Read-out
  • 13. Hydrology Project Training Module File: “ 35 Emission Spectroscopy and Nephelometry.doc” Version 23/02/00 Page 12 Emission spectroscopy: Instrument (2) • The Atomiser: - stream of air is blown across the opening to the sample inlet jet, creates suction in central tube - sample is drawn to the air stream and a fine mist is formed • The Flame: - Typically acetylene gas together with air • Sensor: - Lens, slit, filter, photocell, amplifier and read-out
  • 14. Hydrology Project Training Module File: “ 35 Emission Spectroscopy and Nephelometry.doc” Version 23/02/00 Page 13 Emission spectroscopy: Measurement (1) • For Na+ and K+ the spectra are simple, consisting of a few wavelengths • Na+ produce a characteristic yellow emission at 589 nm, • Concentrations can be measured to ± 1 mg/l • K+ produce a characteristic emission at 766.5 nm • Concentrations can be measured to ± 0.1 mg/l
  • 15. Hydrology Project Training Module File: “ 35 Emission Spectroscopy and Nephelometry.doc” Version 23/02/00 Page 14 Emission Spectroscopy: Measurement (2) • Make series of standard solutions, known concentrations • Set flame photometer to correct λ • Measure emission intensity of standards • Plot calibration curve: Intensity vs. Concentration
  • 16. Hydrology Project Training Module File: “ 35 Emission Spectroscopy and Nephelometry.doc” Version 23/02/00 Page 15 Emission spectroscopy: Measurement (3) • Calibration curve: Linear relation between Intensity & Concentration 0 25 50 75 100 Concentration RelativeIntensity
  • 17. Hydrology Project Training Module File: “ 35 Emission Spectroscopy and Nephelometry.doc” Version 23/02/00 Page 16 Emission spectroscopy: Measurement (4) • Measure Intensity (I) of unknown, read Concentration (C) 0 25 50 75 100 Concentration (C) RelativeIntensity(I)
  • 18. Hydrology Project Training Module File: “ 35 Emission Spectroscopy and Nephelometry.doc” Version 23/02/00 Page 17 Nephelometry & Turbidity (1) • Turbidity is one of the basic measurements of water quality • Turbid water looks dark or ‘dirty’ • Turbidity is an important consideration for many uses of water: - potability of water - use in industry - ecology
  • 19. Hydrology Project Training Module File: “ 35 Emission Spectroscopy and Nephelometry.doc” Version 23/02/00 Page 18 Nephelometry & Turbidity (2) • Turbidity caused by suspended and colloidal particles in water • Particles can be inorganic and organic: - clay, silt, mud, silica, rust, calcium carbonate, algae, bacteria, organic material • Particles absorb and scatter light • Turbidimetry and Nephelometry are two (similar) methods to measure turbidity
  • 20. Hydrology Project Training Module File: “ 35 Emission Spectroscopy and Nephelometry.doc” Version 23/02/00 Page 19 Nephelometry & Turbidity (3) • In Turbidimetry, light passing through a sample is measured - Instrument used is a ‘Turbidimeter’ - A spectrophotometer or photometer can be used as a turbidimeter to measure light transmission/absorbance at λ = 420 nm
  • 21. Hydrology Project Training Module File: “ 35 Emission Spectroscopy and Nephelometry.doc” Version 23/02/00 Page 20 Nephelometry & Turbidity (4) • In Nephelometry, the light Scattered by the suspended particles in a sample is measured - Instrument used is a ‘Nephelometer’ or ‘Nephelometric Turbidimeter’ - Nephelometry is more sensitive for very dilute suspentions
  • 22. Hydrology Project Training Module File: “ 35 Emission Spectroscopy and Nephelometry.doc” Version 23/02/00 Page 21 Nephelometry & Turbidity (5) Light Source Slit Sample Phototube Measuring Transmitted Light Turbidimeter Nephelometer Phototube Measuring Scattered Light
  • 23. Hydrology Project Training Module File: “ 35 Emission Spectroscopy and Nephelometry.doc” Version 23/02/00 Page 22 Nephelometry & Turbidity: Units • Basic unit of turbidity is Nephelometric Turbidity Unit (NTU) • NTU has replaced previous unit of ‘Jackson candle turbidity units’ (JTU) • Formazin suspensions are used as a standard for calibration • Formazin particles have uniform size and shape
  • 24. Hydrology Project Training Module File: “ 35 Emission Spectroscopy and Nephelometry.doc” Version 23/02/00 Page 23 Nephelometry & Turbidity: Typical Values Water Type NTU Surface Water (Rainy season) 1000 and above Treated tap water 1 to 2 De-mineralised water 0.1 to 0.5 Water filtered through membrane filter 0.05 or less
  • 25. Hydrology Project Training Module File: “ 35 Emission Spectroscopy and Nephelometry.doc” Version 23/02/00 Page 24 Nephelometry: Interferences • All dust, dirt, scratches or finger marks on the instrument will interfere with the measurements • Instrument components and sample tubes must be kept dry and clean
  • 26. Hydrology Project Training Module File: “ 35 Emission Spectroscopy and Nephelometry.doc” Version 23/02/00 Page 25 5. Evaluation sheets
  • 27. Hydrology Project Training Module File: “ 35 Emission Spectroscopy and Nephelometry.doc” Version 23/02/00 Page 26
  • 28. Hydrology Project Training Module File: “ 35 Emission Spectroscopy and Nephelometry.doc” Version 23/02/00 Page 27 6. Handout
  • 29. Hydrology Project Training Module File: “ 35 Emission Spectroscopy and Nephelometry.doc” Version 23/02/00 Page 28 Emission spectroscopy and nephelometry • Emission spectroscopy and Nephelometry are 2 common analytical methods • Both methods rely on measurement of light • In Emission spectroscopy, the light Emitted by heated metal atoms in vapourised water • In Nephelometry, the light Scattered by particles in water is measured • Nephelometry is related to ‘Turbidimetry’ Emission spectroscopy • Flame emission spectroscopy: - Also known as ‘Atomic Emission Spectroscopy’ - Also known as ‘Flame Photometry’ • Primarily used in the determination of alkali metals: K+ , Na+ • Other metals which can be measured: Ca++ , Mg++ , Sr++ Emission spectroscopy: Principle (1) • Many metallic elements will emit a characteristic radiation, when subjected to suitable excitation (e.g. flame) • The Intensity of emitted radiation, at some particular wavelength, can be correlated to the amount of element present Emission spectroscopy: Principle (2) - Liquid sample is sucked into instrument - Metal salts get vaporised (‘atomized’) - Metals atoms are excited by energy of the flame - Excited atoms emit radiation characteristic of the metal - Intensity of radiation increases with concentration of element - Linear relation between intensity & concentration Emission spectroscopy: Principle (3) • Emitted radiation is measured: - Emitted radiation passes through lens and optical filter - Photocell reads the characteristic radiation - Amplifier & digital read-out of radiation intensity
  • 30. Hydrology Project Training Module File: “ 35 Emission Spectroscopy and Nephelometry.doc” Version 23/02/00 Page 29 Emission spectroscopy: Instrument (2) • The Atomiser: - stream of air is blown across the opening to the sample inlet jet, creates suction in central tube - sample is drawn to the air stream and a fine mist is formed • The Flame: - Typically acetylene gas together with air • Sensor: - Lens, slit, filter, photocell, amplifier and read-out Emission spectroscopy: Measurement (1) • For Na+ and K+ the spectra are simple, consisting of a few wavelengths • Na+ produce a characteristic yellow emission at 589 nm, • Concentrations can be measured to ± 1 mg/l • K+ produce a characteristic emission at 766.5 nm • Concentrations can be measured to ± 0.1 mg/l Emission Spectroscopy: Measurement (2) • Make series of standard solutions, known concentrations • Set flame photometer to correct λ • Measure emission intensity of standards • Plot calibration curve: Intensity vs. Concentration Emission spectroscopy: Measurement (3) • Calibration curve: Linear relation between Intensity & Concentration Emission spectroscopy: Measurement (4) • Measure Intensity (I) of unknown, read Concentration (C) Nephelometry & Turbidity (1) • Turbidity is one of the basic measurements of water quality • Turbid water looks dark or ‘dirty’ • Turbidity is an important consideration for many uses of water: - potability of water - use in industry - ecology Nephelometry & Turbidity (2) • Turbidity caused by suspended and colloidal particles in water • Particles can be inorganic and organic: - clay, silt, mud, silica, rust, calcium carbonate, algae, bacteria, organic material • Particles absorb and scatter light • Turbidimetry and Nephelometry are two (similar) methods to measure turbidity
  • 31. Hydrology Project Training Module File: “ 35 Emission Spectroscopy and Nephelometry.doc” Version 23/02/00 Page 30 Nephelometry & Turbidity (3) • In Turbidimetry, light passing through a sample is measured - Instrument used is a ‘Turbidimeter’ - A spectrophotometer or photometer can be used as a turbidimeter to measure light transmission/absorbance at λ = 420 nm Nephelometry & Turbidity (4) • In Nephelometry, the light Scattered by the suspended particles in a sample is measured - Instrument used is a ‘Nephelometer’ or ‘Nephelometric Turbidimeter’ - Nephelometry is more sensitive for very dilute suspentions Nephelometry & Turbidity: Units • Basic unit of turbidity is Nephelometric Turbidity Unit (NTU) • NTU has replaced previous unit of ‘Jackson candle turbidity units’ (JTU) • Formazin suspensions are used as a standard for calibration • Formazin particles have uniform size and shape Nephelometry & Turbidity: Typical Values Water Type NTU Surface Water (Rainy season) 1000 and above Treated tap water 1 to 2 De-mineralised water 0.1 to 0.5 Water filtered through membrane filter 0.05 or less Nephelometry: Interferences • All dust, dirt, scratches or finger marks on the instrument will interfere with the measurements • Instrument components and sample tubes must be kept dry and clean
  • 32. Hydrology Project Training Module File: “ 35 Emission Spectroscopy and Nephelometry.doc” Version 23/02/00 Page 31 Add copy of Main text in chapter 8, for all participants.
  • 33. Hydrology Project Training Module File: “ 35 Emission Spectroscopy and Nephelometry.doc” Version 23/02/00 Page 32 7. Additional handout These handouts are distributed during delivery and contain test questions, answers to questions, special worksheets, optional information, and other matters you would not like to be seen in the regular handouts. It is a good practice to pre-punch these additional handouts, so the participants can easily insert them in the main handout folder.
  • 34. Hydrology Project Training Module File: “ 35 Emission Spectroscopy and Nephelometry.doc” Version 23/02/00 Page 33
  • 35. Hydrology Project Training Module File: “ 35 Emission Spectroscopy and Nephelometry.doc” Version 23/02/00 Page 34 8. Main text Contents 1. Introduction 1 2. Atomic emission spectroscopy 1 3. Nephelometry & Turbidimetry 3
  • 36. Hydrology Project Training Module File: “ 35 Emission Spectroscopy and Nephelometry.doc” Version 23/02/00 Page 1 Emission Spectroscopy and Nephelometry 1. Introduction Atomic emission spectroscopy and nephelometry are two different methods which can be used to measure chemical substances in water samples. Both methods rely on the measurement of light. Atomic emission spectroscopy In emission spectroscopy, the light radiation emitted by metal atoms when heated in a flame is measured. If a solution containing a metallic salt (or some other metallic compound) is aspirated into a flame (e.g. of acetylene burning in air), a vapour which contains atoms of the metal may be formed. Some of these gaseous metal atoms may be raised to an energy level which is sufficiently high to permit the emission of radiation characteristic of the metal, e.g. the characteristic yellow colour imparted to flames by compounds of sodium. This is the basis of atomic flame emission spectroscopy, which is also referred to as flame emission spectroscopy (FES) or flame photometry. Atomic emission spectroscopy is used in the determination of alkali metals as they are excited by the relatively low excitation energy of the flame. Sodium and Potassium are more frequently determined because of their importance in aquatic and biological systems. Turbidimetery and Nephelometry In Nephelometry, the light scattered by particles in water is measured. Suspension of particles in water interfering with passage of light is called turbidity. The turbidity of a sample may be measured either by its effect on the scattering of light, which is termed ‘Nephelometery’, or by its effect on transmission of light, which is termed ‘Turbidimetery’. These methods use common electric photometers to measure light intensity. Nephelometric measurement is more sensitive for very dilute solutions, but for moderately heavy turbidity, either this or turbidimetric measurements can be made. In turbidimetry, the amount of light passing through a solution is measured. The higher the turbidity, the smaller the quantity of light transmitted. In nephelometry, on the other hand, the detecting cell is placed at right angles to the light source to measure light scattered by the turbidity particles. 2. Atomic emission spectroscopy Atomic emission spectroscopy is also known as ‘Flame Emission Spectroscopy’ or ‘Flame Photometry’. The instrument used for analysis is commonly known as the ‘Flame Photometer’. The method is used primarily for analysis of alkali metals (K+ and Na+ ). Other metals can be measured with emission spectroscopy, such as Ca+2 , Mg+2 , Sr+2 , though alternative methods may be better. Although flame spectroscopy was first studied by in 1860, it was established in 1930 as an important analytical method for the determination of alkali metals. It is known that many elements under suitable excitation emit radiations of characteristic wavelength. This fact is utilised in the familiar qualitative flame test for the alkali and alkaline earth elements. For these elements, such as sodium and potassium, the spectra are simple, consisting of only a few wavelengths.
  • 37. Hydrology Project Training Module File: “ 35 Emission Spectroscopy and Nephelometry.doc” Version 23/02/00 Page 2 General Principle The general principle of the analysis is that many metallic elements will emit a characteristic radiation when subjected to a suitable excitation (e.g. flame). Quantitative analysis with the spectrograph is based on an empirical relation between the intensity (power) of the emitted radiation of some particular wavelength and the quantity of the corresponding elements in the sample. General Method of Analysis The basic diagram of a flame photometer is shown in Figure1. In this method of analysis, first an emission radiation is created: • the solution being tested is first sucked into the instrument • In the atomiser, air at a certain pressure is blown in. Two types of atomisers are available: Right angle type, and Concentric type. In both atomisers, a stream of air is blown across the opening of the sample inlet jet, creating a suction. The sample is drawn into the air stream, where it forms a fine mist. The sample is broken into fine particles and the metal salts get vaporised ( atomised ) • Particles get carried with the compressed air towards to the mixing chamber. Here the compressed air carrying metal particles is mixed with the fuel gas. Fuel gas is typically acetylene. Ordinary cooking gas may also be used. • The fuel gas mixture is fed into the burner for producing the flame. • In the flame the metal particles emit radiation, producing a colour whose wavelength is characteristic of the element present in the sample. The intensity of the radiation varies with the concentration of the metallic ions in the solution. After the radiation is emitted, it must then be measured: • Radiation from the flame passes through a lens, a slit, a optical filter and falls on the photocell. The lens and filter isolate the particular wavelength characteristic of the metal ions being measured. • The photocell measures the characteristic radiation. • Amplifier and digital read-out give the radiation intensity Specific Analysis: Na+ and K+ Sodium and Potassium are routinely analysed with Emission Spectroscopy. For these elements, the emission spectra are simple, consisting of a few wavelengths: • Na is determined at λ = 589 nm; concentrations can be measured to ± 1 mg/l. • K is determined at λ =766.5 nm; concentrations can be measured to ± 0.1 mg/l. Procedure: 1. Make a series of standard solutions, of known concentrations. 2. Set Flame Photometer to correct λ 3. Measure the emission intensity of the standards 4. Plot a standard curve: Intensity vs. Concentration 5. Measure intensity of unknowns, then read concentration from standard curve (Figure 2)
  • 38. Hydrology Project Training Module File: “ 35 Emission Spectroscopy and Nephelometry.doc” Version 23/02/00 Page 3 Figure 1: The main components of the Flame Photometer (a) (b) Figure 2: (a): a standard curve showing linear relation of emitted light intensity (I) with sample concentration (C) (b): Reading the concentrations of an unknown using the standard curve after measuring the intensity Interferences At high concentrations of solutes, the analysis can be influenced by the composition of sample solutions. The concomitant elements may act upon the intensity of emission of test elements. It is seen that the emission intensity of any alkali metal increases in the presence of other alkali metals. Specifically, high concentrations of calcium and potassium can interfere with sodium analyses. High concentrations of calcium, magnesium and sodium can interfere with potassium analyses. Normally such interferences are not a problem. If such high concentrations of interfering ions are present, special analytical procedures can be followed, such as adding a “Radiation Buffer”. 3. Nephelometry & Turbidimetry Turbidity is one of the basic measurements of water quality, such as colour, odour, and temperature. Turbid water looks dark, and ‘dirty’. This is caused by the presence of suspended and colloidal substances of various origin like clay, silt, mud, silica, rust, calcium carbonate as well as microscopic aquatic organisms like algae, and bacteria. Mixing Chamber Atomiser Sample AIR DRAIN LEN FILTER PHOTOCELLFLAME BURNER Amplifier and Read-out 0 25 50 75 100 Concentration RelativeIntensity 0 25 50 75 100 Concentration RelativeIntensity
  • 39. Hydrology Project Training Module File: “ 35 Emission Spectroscopy and Nephelometry.doc” Version 23/02/00 Page 4 Analysis of Turbidity Turbidity is caused by suspension of particles in water, interfering with passage of light. The turbidity of a sample may be measured either by its effect on the transmission of light, which is termed turbidimetery, or by its effect on the scattering of light, which is termed Nephelometery. The analytical methods employ common electric photometers that can measure light intensity (Figure 3). The turbidimeter or nephelometer mainly consists of four parts – light source, optical components (e.g. slit), sample compartment and a photocell for the measurement of light either transmitted through the sample or scattered from the suspended particles in the sample. The photocell detects light and an electronic amplifier measures the light intensities. In Turbidimetry, the amount of light passing through a solution is measured. The higher the turbidity, the smaller the quantity of light transmitted (i.e. more light is absorbed). Any spectrophotometer or photometer can be used as a turbidimeter, without modification. Since property concerns visible light the measurement is commonly carried out at 420 nm. In nephelometry, on the other hand, the detecting cell is placed at right angles to the light source, to measure light scattered by particles. The intensity of the scattered light serves as a measure of the turbidity. The instrument is called a ‘Nephelometer’ or a ‘Nephelometric Turbidimeter’. A spectrophotometer can be used, however, a special attachment is required for nephelometry. Nephelometric measurement is more sensitive for very dilute suspensions and low turbidity caused by fine particles (colloidal solutions). For moderately heavy turbidity, either this or turbidimetric measurements can be made. Figure 3 Diagram of Turbidity analysis by ‘Turbidimetry’ or ‘Nephelometry’ Measurement of turbidity based on visual methods, such as Jackson's candle turbidimeter, although simple and cheaper, is not sensitive for low turbidities. The accuracy of visual instruments is also limited and depends upon the skill of the user’s eye. Light Source Slit Sample Phototube Measuring Transmitted Light Turbidimeter Nephelometer Phototube Measuring Scattered Light
  • 40. Hydrology Project Training Module File: “ 35 Emission Spectroscopy and Nephelometry.doc” Version 23/02/00 Page 5 Significance of Turbidity Measurements Turbidity is an important factor for many uses of water: • potability: The turbidity is connected with potability of water directly, indirectly or aesthetically. High turbidity is generally associated with polluted water. Turbidity measurement is very important in deciding the quality of water samples. In fact, the turbidity is taken as an indicator for efficiency and performance of coagulation, flocculation, sedimentation and filtration processes of water treatment plants. • use in industry: The turbidity of water being used in industry is also an important consideration in quality control for industries manufacturing chemicals, cosmetics, food products, beverages, etc. • ecology: many aquatic animals and plants need clear water to survive. Turbidity is therefore damaging to ecology. Turbidity Units The standard Turbidity unit is called Nephelometric Turbidity Unit (NTU) because of the use of nephelometric method of measurement. The NTU has generally replaced the previous unit of ‘Jackson candle turbidity units (JTU). Typical turbidity values for different waters are given in Table 1 Table 1 Typical Turbidity Values for different waters Type of water NTU Surface Water (Rainy season) 1000 and above Treated tap water 1 to 2 De-mineralised water 0.1 to 0.5 Water filtered through membrane filter 0.05 or less Calibration of Instrument and Measurement of Turbidity Formazine is used as turbidity standard for calibration because it possesses the desired properties which other standards do not have. Formazin particles have uniform size and shape. Formazin can be synthesised and has reproducibility of one percent. Formazin stock solution has good stability (up to 1 year), thus making it an ideal turbidity standard. Calibration is made in NTU, the standard units of measurement. Procedures for preparation of formazin stock standard, 4000 NTU, are in the Guidelines for Standard Analytical Procedures for Water Analysis. For each use, the dilute standards are prepared from stock solution, and the nephelometer must be calibrated according to manufacturer’s operating instructions. Interferences in Nephelometry: Nephelometry is based on measuring light intensity. Several factors can interfere with the measurements: • Dirty glassware • Air bubbles in the sample • Vibration that disturbs the surface visibility • Colour of the sample
  • 41. Hydrology Project Training Module File: “ 35 Emission Spectroscopy and Nephelometry.doc” Version 23/02/00 Page 6 Maintenance : Cleanliness is of utmost importance in all turbidity measurements. All the glass and optical parts must be protected from dust and scratches. Even the finger marks on the sample tube bottoms, mirror, source lamps and reflectors may disturb the measurement, accuracy and calibration. To prevent the polish bottoms of the sample tubes and plungers from scratching, it is advisable to keep these items on a soft cloth or tissue paper when not in use. The sample tubes and condensing lenses etc may be washed with mild detergent and rinsed with distilled water. The filters and mirrors may be cleaned using a soft tissue paper or air syringe and may be wiped occasionally with a soft tissue soaked with distilled water or mild detergent. Never immerse these items in water or cleaning solutions. Also wipe the outside of the sample tube before placing into the housing; otherwise it may keep the mirror wet for long time and damage it permanently.