
Recommended
More Related Content
Viewers also liked
Viewers also liked (11)
More from guest20ee0
Recently uploaded
Recently uploaded (20)
Tmd12302008 Update
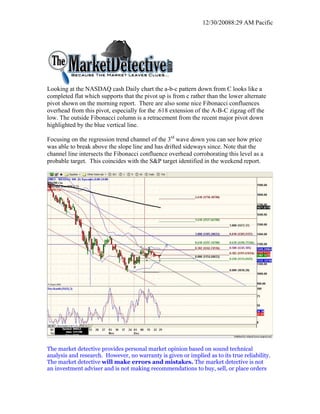
- 1. 12/30/20088:29 AM Pacific Looking at the NASDAQ cash Daily chart the a-b-c pattern down from C looks like a completed flat which supports that the pivot up is from c rather than the lower alternate pivot shown on the morning report. There are also some nice Fibonacci confluences overhead from this pivot, especially for the .618 extension of the A-B-C zigzag off the low. The outside Fibonacci column is a retracement from the recent major pivot down highlighted by the blue vertical line. Focusing on the regression trend channel of the 3rd wave down you can see how price was able to break above the slope line and has drifted sideways since. Note that the channel line intersects the Fibonacci confluence overhead corroborating this level as a probable target. This coincides with the S&P target identified in the weekend report. The market detective provides personal market opinion based on sound technical analysis and research. However, no warranty is given or implied as to its true reliability. The market detective will make errors and mistakes. The market detective is not an investment adviser and is not making recommendations to buy, sell, or place orders
- 2. 12/30/20088:29 AM Pacific relating to the futures contracts, ETFs, or stocks that he writes about. The responsibility for decisions made from information contained in this service are solely that of the individual subscriber. The individual must fully research and make his/her own decisions before acting on any information provided by the market detective. The market detective assumes no responsibility for subscriber investment or trading results