SlideShare a Scribd company logo
1 of 3
Download to read offline
162


      Table 1         Total number of reported disasters,1 by continent and by year (1999 to 2008)

                                      1999        2000        2001        2002        2003        2004        2005        2006        2007        2008               Total
      Africa                            144          202         183         197         169         164         170         198         178         159         1,764
      Americas                          140          150         134         156         126         135         139         103         133         138         1,354
      Asia                              256          303         295         310         292         314         359         299         255         226         2,909
      Europe                              92         130          96         115          96          98         127          92         103          52         1,001
      Oceania                             16          13          18          19          20          22          16          18          11          10              163
      High human
                                        194          248         200         230         197         207         215         170         187         138         1,986
      development 2
      Medium human
                                        381          425         402         459         414         435         477         417         387         363         4,160
      development
      Low human
                                          73         125         124         108          92          91         119         123         106          84         1,045
      development
      Total                             648         798         726         797         703         733         811       710       680        585          7,191
                                                                                                                   Source: EM-DAT, CRED, University of Louvain, Belgium

      1
          In Tables 1–13, ‘disasters’ refer to those with a natural and/or technological trigger only, and do not include wars, conflict-related famines, diseases
          or epidemics.
      2
          See note on UNDP’s Human Development Index country status in the section on disaster definitions in the introduction to this annex.
      With 585 disasters, 2008 is the year with the lowest number of disasters of the decade, far below the peaks of 2000, 2002 and 2005
      In 2008, disaster numbers were the lowest of the decade in Asia, Europe and Oceania as well as in high and medium human development countries.
      With, respectively, 27 per cent and 24 per cent of all disasters, Africa and the Americas are above their decade’s averages of 25 per cent and 19 per cent.
164


      Table 3         Total number of people reported affected, by continent and by year (1999 to 2008), in thousands

                                      1999        2000       2001        2002        2003        2004        2005        2006        2007        2008          Total 2
      Africa                         37,634     46,000      45,445      44,601      29,213      36,902      22,856      22,892      12,526      18,220       316,289
      Americas                       17,277         975     10,913        2,517       3,995      9,478       8,308       1,450       8,940      19,684        83,537
      Asia                         241,095     206,644     186,203     663,070     234,974     132,289     129,716    118,356     190,886     175,732     2,278,965
      Europe                          6,311       2,929         787       1,493       1,546         538         527        260       1,646         268        16,304
      Oceania                           151            7         31          41          38         119          28          38        172           92           718
      High human
                                     19,351       1,550       8,942       2,914       2,849      6,568       7,364         828       5,980      16,816        73,163
      development 1
      Medium human
                                   262,389     225,821     212,343     687,582     248,008     155,809     136,039    122,275     199,723     184,070     2,434,060
      development
      Low human
                                     20,727     29,184      22,095      21,226      18,909      16,948      18,033      19,893       8,467      13,110       188,590
      development
      Total                        302,467     256,556     243,380     711,722     269,765     179,325     161,436     142,995     214,170    213,996      2,695,813
                                                                                                                    Source: EM-DAT, CRED, University of Louvain, Belgium

      1
          See note on UNDP’s Human Development Index country status in the section on disaster definitions in the introduction to this annex.
      2
          Since slow-onset disasters can affect the same people for a number of years, it is best to use figures on total numbers affected to calculate annual averages
          over a decade rather than as absolute totals.

      On the basis of available data, an average of around 270 million people were affected annually by disasters from 1999 to 2008, 85 per cent of them in Asia.

      In the Americas, the number of people affected was the highest of the decade. In the United States, a major flood affected 11 million people; in the Caribbean
      and the United States, Hurricane Gustav affected 2.1 million people; and in Brazil and Colombia, two floods affected a total of 2.5 million people.

      In 2008, the number of people affected by disaster living in Africa and Europe was the second lowest of the decade.
166


      Table 5          Total number of reported disasters, by type of phenomenon and by year (1999 to 2008)

                                  1999        2000       2001        2002        2003       2004        2005       2006        2007        2008          Total
      Droughts/food insecurity        31          42         42          40         23          19          28         19          13         15           272
      Earthquakes/tsunamis            33          31         25          37         40          42          25         24          20         21           298
      Extreme temperatures             8          31         23          15         25          16          29         24          25           8          204
      Floods1                        122        158         157        171         159         129        195         227        219         158         1,695
      Forest/scrub fires              22          30         14          22         14           8          13           9         18           4          154
      Insect infestation             ndr           2           2        ndr         ndr         12         ndr         ndr        ndr         ndr           16
      Mass movement: dry2            ndr           1         ndr          1         ndr          1         ndr           1        ndr           3             7
      Mass movement: wet3             18          28         24          20         21          15          12         20          10         12           180
      Volcanic eruptions               5           5           6          7           2          5           8         12           6           6           62
      Windstorms                     106        102         108        124          85         127        130          76        105          99         1,062
      Subtotal climato-, hydro-
                                     307        393         370        392         327         326        407         375        390         296         3,583
      meteorological disasters
      Subtotal geophysical
                                      38          37         31          45         42          48          33         37          26         30           367
      disasters
      Total natural disasters       345         430         401        437         369        374         440         412        416         326         3,950
      Industrial accidents            37          51         54          48         52          81          76         61          52         38           550
      Miscellaneous accidents         52          58         50          52         45          62          66         32          42         30           489
      Transport accidents            214        259         221        260         237         216        229         205        170         191         2,202
      Total technological
                                    303         368        325         360         334        359         371         298        264         259         3,241
      disasters
      Total                         648         798         726        797         703        733         811       710       680        585          7,191
                                                                                                             Source: EM-DAT, CRED, University of Louvain, Belgium
      1
        Includes waves and surges. 2 Landslides, rockfalls, subsidence of geophysical origin. 3 Mud/landslides, avalanches, subsidence of hydrological origin.
      Note: ndr signifies no disaster reported. For more information, see section on caveats in introductory text.
      In 2008, the numbers of both natural and technological disasters were the lowest of the decade, as were the numbers of forest/scrub fires and of miscellaneous
      accidents. In 2008, the most frequent disasters were transport accidents (33 per cent), floods (27 per cent) and windstorms (17 per cent), near their average
      for the decade.

More Related Content

Viewers also liked

Deepwater Horizon Oil Spill Overview Presentation
Deepwater Horizon Oil Spill Overview PresentationDeepwater Horizon Oil Spill Overview Presentation
Deepwater Horizon Oil Spill Overview PresentationRichard Allaway
 
Ethiopian Drought 2010
Ethiopian Drought 2010Ethiopian Drought 2010
Ethiopian Drought 2010Tom McLean
 
Key Stage 3 Geography: Plate Boundaries
Key Stage 3 Geography: Plate BoundariesKey Stage 3 Geography: Plate Boundaries
Key Stage 3 Geography: Plate BoundariesRichard Allaway
 
IB Geography - What Is Development?
IB Geography - What Is Development?IB Geography - What Is Development?
IB Geography - What Is Development?Richard Allaway
 
IB Geography Population, Resources and Development Revision - Essay Questions...
IB Geography Population, Resources and Development Revision - Essay Questions...IB Geography Population, Resources and Development Revision - Essay Questions...
IB Geography Population, Resources and Development Revision - Essay Questions...Richard Allaway
 
IB Geography: Possible Stimulus Material
IB Geography: Possible Stimulus MaterialIB Geography: Possible Stimulus Material
IB Geography: Possible Stimulus MaterialRichard Allaway
 
geographyalltheway.com - IB DP Geography - Global Interactions: KOF Index of ...
geographyalltheway.com - IB DP Geography - Global Interactions: KOF Index of ...geographyalltheway.com - IB DP Geography - Global Interactions: KOF Index of ...
geographyalltheway.com - IB DP Geography - Global Interactions: KOF Index of ...Richard Allaway
 
US drought vs. Ethiopian drought
US drought vs. Ethiopian droughtUS drought vs. Ethiopian drought
US drought vs. Ethiopian droughtTom McLean
 
Chernobyl disaster
Chernobyl disasterChernobyl disaster
Chernobyl disasterSteven Heath
 
Evaluating Vulnerability in the 2011 Japan Earthquake and the 2010 Haiti Eart...
Evaluating Vulnerability in the 2011 Japan Earthquake and the 2010 Haiti Eart...Evaluating Vulnerability in the 2011 Japan Earthquake and the 2010 Haiti Eart...
Evaluating Vulnerability in the 2011 Japan Earthquake and the 2010 Haiti Eart...Tom McLean
 
Hurricane Katrina vs Cyclone Nargis
Hurricane Katrina vs Cyclone NargisHurricane Katrina vs Cyclone Nargis
Hurricane Katrina vs Cyclone NargisTom McLean
 

Viewers also liked (14)

Deepwater Horizon Oil Spill Overview Presentation
Deepwater Horizon Oil Spill Overview PresentationDeepwater Horizon Oil Spill Overview Presentation
Deepwater Horizon Oil Spill Overview Presentation
 
Ethiopian Drought 2010
Ethiopian Drought 2010Ethiopian Drought 2010
Ethiopian Drought 2010
 
Key Stage 3 Geography: Plate Boundaries
Key Stage 3 Geography: Plate BoundariesKey Stage 3 Geography: Plate Boundaries
Key Stage 3 Geography: Plate Boundaries
 
IB Geography - What Is Development?
IB Geography - What Is Development?IB Geography - What Is Development?
IB Geography - What Is Development?
 
IB Geography Population, Resources and Development Revision - Essay Questions...
IB Geography Population, Resources and Development Revision - Essay Questions...IB Geography Population, Resources and Development Revision - Essay Questions...
IB Geography Population, Resources and Development Revision - Essay Questions...
 
IB Geography: Possible Stimulus Material
IB Geography: Possible Stimulus MaterialIB Geography: Possible Stimulus Material
IB Geography: Possible Stimulus Material
 
geographyalltheway.com - IB DP Geography - Global Interactions: KOF Index of ...
geographyalltheway.com - IB DP Geography - Global Interactions: KOF Index of ...geographyalltheway.com - IB DP Geography - Global Interactions: KOF Index of ...
geographyalltheway.com - IB DP Geography - Global Interactions: KOF Index of ...
 
US drought vs. Ethiopian drought
US drought vs. Ethiopian droughtUS drought vs. Ethiopian drought
US drought vs. Ethiopian drought
 
Vulnerability
VulnerabilityVulnerability
Vulnerability
 
Chernobyl disaster
Chernobyl disasterChernobyl disaster
Chernobyl disaster
 
Hurricane Katrina
Hurricane KatrinaHurricane Katrina
Hurricane Katrina
 
Evaluating Vulnerability in the 2011 Japan Earthquake and the 2010 Haiti Eart...
Evaluating Vulnerability in the 2011 Japan Earthquake and the 2010 Haiti Eart...Evaluating Vulnerability in the 2011 Japan Earthquake and the 2010 Haiti Eart...
Evaluating Vulnerability in the 2011 Japan Earthquake and the 2010 Haiti Eart...
 
Hurricane Katrina vs Cyclone Nargis
Hurricane Katrina vs Cyclone NargisHurricane Katrina vs Cyclone Nargis
Hurricane Katrina vs Cyclone Nargis
 
LISTA DOS POLICIAS QUE SAÍRAM DO ARTIGO 14-PMPE 2017
LISTA DOS POLICIAS QUE SAÍRAM DO ARTIGO 14-PMPE 2017LISTA DOS POLICIAS QUE SAÍRAM DO ARTIGO 14-PMPE 2017
LISTA DOS POLICIAS QUE SAÍRAM DO ARTIGO 14-PMPE 2017
 

Similar to Red Cross and Red Crescent World Disaster Report - Selected Data Tables

Similar to Red Cross and Red Crescent World Disaster Report - Selected Data Tables (13)

Mining Poverty 04
Mining Poverty 04Mining Poverty 04
Mining Poverty 04
 
Clean up diesel pollution
Clean up diesel pollutionClean up diesel pollution
Clean up diesel pollution
 
Clean up diesel pollution
Clean up diesel pollutionClean up diesel pollution
Clean up diesel pollution
 
Border patrol statistics 5 20-2011
Border patrol statistics 5 20-2011Border patrol statistics 5 20-2011
Border patrol statistics 5 20-2011
 
【東京医科歯科大学】平成21年環境報告書
【東京医科歯科大学】平成21年環境報告書【東京医科歯科大学】平成21年環境報告書
【東京医科歯科大学】平成21年環境報告書
 
【東京医科歯科大学】平成20年環境報告書
【東京医科歯科大学】平成20年環境報告書【東京医科歯科大学】平成20年環境報告書
【東京医科歯科大学】平成20年環境報告書
 
Introduction to Sahana Eden - EMAG - May 2012
Introduction to Sahana Eden - EMAG - May 2012Introduction to Sahana Eden - EMAG - May 2012
Introduction to Sahana Eden - EMAG - May 2012
 
Eco dev final
Eco dev finalEco dev final
Eco dev final
 
April 2011
April 2011April 2011
April 2011
 
Korepatentistaitsitkleri
KorepatentistaitsitkleriKorepatentistaitsitkleri
Korepatentistaitsitkleri
 
Keynote technicals intraday future levels for 110213
Keynote technicals intraday future levels for 110213Keynote technicals intraday future levels for 110213
Keynote technicals intraday future levels for 110213
 
Producción petrolera 2012
Producción petrolera 2012Producción petrolera 2012
Producción petrolera 2012
 
DOW
DOWDOW
DOW
 

More from Richard Allaway

IB Geography - Population Trends and Patterns Graphs
IB Geography - Population Trends and Patterns GraphsIB Geography - Population Trends and Patterns Graphs
IB Geography - Population Trends and Patterns GraphsRichard Allaway
 
Geographical Association Conference 2012 - 5 Countries ... All you need for I...
Geographical Association Conference 2012 - 5 Countries ... All you need for I...Geographical Association Conference 2012 - 5 Countries ... All you need for I...
Geographical Association Conference 2012 - 5 Countries ... All you need for I...Richard Allaway
 
IB Geography - Food and Health Concept Squares
IB Geography - Food and Health Concept SquaresIB Geography - Food and Health Concept Squares
IB Geography - Food and Health Concept SquaresRichard Allaway
 
IB Geography - Global Interactions Concept Mapping
IB Geography - Global Interactions Concept MappingIB Geography - Global Interactions Concept Mapping
IB Geography - Global Interactions Concept MappingRichard Allaway
 
IB Geography - Global Interactions - Glocalization
IB Geography - Global Interactions - GlocalizationIB Geography - Global Interactions - Glocalization
IB Geography - Global Interactions - GlocalizationRichard Allaway
 
geographyalltheway.com - IB Geography - Food and Health - Prevention or Trea...
geographyalltheway.com - IB Geography - Food and Health -  Prevention or Trea...geographyalltheway.com - IB Geography - Food and Health -  Prevention or Trea...
geographyalltheway.com - IB Geography - Food and Health - Prevention or Trea...Richard Allaway
 
geographyalltheway.com - IB Geography - The Bradshaw Model
geographyalltheway.com - IB Geography - The Bradshaw Modelgeographyalltheway.com - IB Geography - The Bradshaw Model
geographyalltheway.com - IB Geography - The Bradshaw ModelRichard Allaway
 
IB Geography: Extreme Environments: Hot, Arid Environment Resource Developmen...
IB Geography: Extreme Environments: Hot, Arid Environment Resource Developmen...IB Geography: Extreme Environments: Hot, Arid Environment Resource Developmen...
IB Geography: Extreme Environments: Hot, Arid Environment Resource Developmen...Richard Allaway
 
geographyalltheway.com - IB Geography - Patterns and Change Mega Mind Mapping
geographyalltheway.com - IB Geography - Patterns and Change Mega Mind Mappinggeographyalltheway.com - IB Geography - Patterns and Change Mega Mind Mapping
geographyalltheway.com - IB Geography - Patterns and Change Mega Mind MappingRichard Allaway
 
Geographical Conference 2011 - A teacher’s perspective of IB Geography
Geographical Conference 2011 - A teacher’s perspective of IB GeographyGeographical Conference 2011 - A teacher’s perspective of IB Geography
Geographical Conference 2011 - A teacher’s perspective of IB GeographyRichard Allaway
 
geographyalltheway.com - Demographic Transition Model
geographyalltheway.com - Demographic Transition Modelgeographyalltheway.com - Demographic Transition Model
geographyalltheway.com - Demographic Transition ModelRichard Allaway
 
geographyalltheway.com - IB Geography: Neo-Malthusian and anti-Malthusian
geographyalltheway.com - IB Geography: Neo-Malthusian and anti-Malthusiangeographyalltheway.com - IB Geography: Neo-Malthusian and anti-Malthusian
geographyalltheway.com - IB Geography: Neo-Malthusian and anti-MalthusianRichard Allaway
 
Geography's Place in the IB - Part II
Geography's Place in the IB - Part IIGeography's Place in the IB - Part II
Geography's Place in the IB - Part IIRichard Allaway
 
Geography's Place in the IB - Part I
Geography's Place in the IB - Part IGeography's Place in the IB - Part I
Geography's Place in the IB - Part IRichard Allaway
 
Geographical Association Conference 2011 - geographyalltheway.com - Resourcin...
Geographical Association Conference 2011 - geographyalltheway.com - Resourcin...Geographical Association Conference 2011 - geographyalltheway.com - Resourcin...
Geographical Association Conference 2011 - geographyalltheway.com - Resourcin...Richard Allaway
 
Demographics of Japan Presentation
Demographics of Japan PresentationDemographics of Japan Presentation
Demographics of Japan PresentationRichard Allaway
 
IB Geography: Patterns and Change > Ravenstein's Laws
IB Geography: Patterns and Change > Ravenstein's LawsIB Geography: Patterns and Change > Ravenstein's Laws
IB Geography: Patterns and Change > Ravenstein's LawsRichard Allaway
 
IB Geography - Patterns and Change - China's Internal Migration
IB Geography - Patterns and Change - China's Internal MigrationIB Geography - Patterns and Change - China's Internal Migration
IB Geography - Patterns and Change - China's Internal MigrationRichard Allaway
 
Living in Hazardous Locations
Living in Hazardous LocationsLiving in Hazardous Locations
Living in Hazardous LocationsRichard Allaway
 

More from Richard Allaway (20)

IB Geography - Population Trends and Patterns Graphs
IB Geography - Population Trends and Patterns GraphsIB Geography - Population Trends and Patterns Graphs
IB Geography - Population Trends and Patterns Graphs
 
Geographical Association Conference 2012 - 5 Countries ... All you need for I...
Geographical Association Conference 2012 - 5 Countries ... All you need for I...Geographical Association Conference 2012 - 5 Countries ... All you need for I...
Geographical Association Conference 2012 - 5 Countries ... All you need for I...
 
IB Geography - Food and Health Concept Squares
IB Geography - Food and Health Concept SquaresIB Geography - Food and Health Concept Squares
IB Geography - Food and Health Concept Squares
 
IB Geography - Global Interactions Concept Mapping
IB Geography - Global Interactions Concept MappingIB Geography - Global Interactions Concept Mapping
IB Geography - Global Interactions Concept Mapping
 
IB Geography - Global Interactions - Glocalization
IB Geography - Global Interactions - GlocalizationIB Geography - Global Interactions - Glocalization
IB Geography - Global Interactions - Glocalization
 
geographyalltheway.com - IB Geography - Food and Health - Prevention or Trea...
geographyalltheway.com - IB Geography - Food and Health -  Prevention or Trea...geographyalltheway.com - IB Geography - Food and Health -  Prevention or Trea...
geographyalltheway.com - IB Geography - Food and Health - Prevention or Trea...
 
geographyalltheway.com - IB Geography - The Bradshaw Model
geographyalltheway.com - IB Geography - The Bradshaw Modelgeographyalltheway.com - IB Geography - The Bradshaw Model
geographyalltheway.com - IB Geography - The Bradshaw Model
 
IB Geography: Extreme Environments: Hot, Arid Environment Resource Developmen...
IB Geography: Extreme Environments: Hot, Arid Environment Resource Developmen...IB Geography: Extreme Environments: Hot, Arid Environment Resource Developmen...
IB Geography: Extreme Environments: Hot, Arid Environment Resource Developmen...
 
geographyalltheway.com - IB Geography - Patterns and Change Mega Mind Mapping
geographyalltheway.com - IB Geography - Patterns and Change Mega Mind Mappinggeographyalltheway.com - IB Geography - Patterns and Change Mega Mind Mapping
geographyalltheway.com - IB Geography - Patterns and Change Mega Mind Mapping
 
Geographical Conference 2011 - A teacher’s perspective of IB Geography
Geographical Conference 2011 - A teacher’s perspective of IB GeographyGeographical Conference 2011 - A teacher’s perspective of IB Geography
Geographical Conference 2011 - A teacher’s perspective of IB Geography
 
geographyalltheway.com - Demographic Transition Model
geographyalltheway.com - Demographic Transition Modelgeographyalltheway.com - Demographic Transition Model
geographyalltheway.com - Demographic Transition Model
 
geographyalltheway.com - IB Geography: Neo-Malthusian and anti-Malthusian
geographyalltheway.com - IB Geography: Neo-Malthusian and anti-Malthusiangeographyalltheway.com - IB Geography: Neo-Malthusian and anti-Malthusian
geographyalltheway.com - IB Geography: Neo-Malthusian and anti-Malthusian
 
Geography's Place in the IB - Part II
Geography's Place in the IB - Part IIGeography's Place in the IB - Part II
Geography's Place in the IB - Part II
 
Geography's Place in the IB - Part I
Geography's Place in the IB - Part IGeography's Place in the IB - Part I
Geography's Place in the IB - Part I
 
Geographical Association Conference 2011 - geographyalltheway.com - Resourcin...
Geographical Association Conference 2011 - geographyalltheway.com - Resourcin...Geographical Association Conference 2011 - geographyalltheway.com - Resourcin...
Geographical Association Conference 2011 - geographyalltheway.com - Resourcin...
 
Demographics of Japan Presentation
Demographics of Japan PresentationDemographics of Japan Presentation
Demographics of Japan Presentation
 
IB Geography: Patterns and Change > Ravenstein's Laws
IB Geography: Patterns and Change > Ravenstein's LawsIB Geography: Patterns and Change > Ravenstein's Laws
IB Geography: Patterns and Change > Ravenstein's Laws
 
IB Geography - Patterns and Change - China's Internal Migration
IB Geography - Patterns and Change - China's Internal MigrationIB Geography - Patterns and Change - China's Internal Migration
IB Geography - Patterns and Change - China's Internal Migration
 
Lee's Migration Model
Lee's Migration ModelLee's Migration Model
Lee's Migration Model
 
Living in Hazardous Locations
Living in Hazardous LocationsLiving in Hazardous Locations
Living in Hazardous Locations
 

Recently uploaded

AUDIENCE THEORY -CULTIVATION THEORY - GERBNER.pptx
AUDIENCE THEORY -CULTIVATION THEORY -  GERBNER.pptxAUDIENCE THEORY -CULTIVATION THEORY -  GERBNER.pptx
AUDIENCE THEORY -CULTIVATION THEORY - GERBNER.pptxiammrhaywood
 
GRADE 4 - SUMMATIVE TEST QUARTER 4 ALL SUBJECTS
GRADE 4 - SUMMATIVE TEST QUARTER 4 ALL SUBJECTSGRADE 4 - SUMMATIVE TEST QUARTER 4 ALL SUBJECTS
GRADE 4 - SUMMATIVE TEST QUARTER 4 ALL SUBJECTSJoshuaGantuangco2
 
Visit to a blind student's school🧑‍🦯🧑‍🦯(community medicine)
Visit to a blind student's school🧑‍🦯🧑‍🦯(community medicine)Visit to a blind student's school🧑‍🦯🧑‍🦯(community medicine)
Visit to a blind student's school🧑‍🦯🧑‍🦯(community medicine)lakshayb543
 
Daily Lesson Plan in Mathematics Quarter 4
Daily Lesson Plan in Mathematics Quarter 4Daily Lesson Plan in Mathematics Quarter 4
Daily Lesson Plan in Mathematics Quarter 4JOYLYNSAMANIEGO
 
Full Stack Web Development Course for Beginners
Full Stack Web Development Course  for BeginnersFull Stack Web Development Course  for Beginners
Full Stack Web Development Course for BeginnersSabitha Banu
 
Field Attribute Index Feature in Odoo 17
Field Attribute Index Feature in Odoo 17Field Attribute Index Feature in Odoo 17
Field Attribute Index Feature in Odoo 17Celine George
 
ROLES IN A STAGE PRODUCTION in arts.pptx
ROLES IN A STAGE PRODUCTION in arts.pptxROLES IN A STAGE PRODUCTION in arts.pptx
ROLES IN A STAGE PRODUCTION in arts.pptxVanesaIglesias10
 
Influencing policy (training slides from Fast Track Impact)
Influencing policy (training slides from Fast Track Impact)Influencing policy (training slides from Fast Track Impact)
Influencing policy (training slides from Fast Track Impact)Mark Reed
 
Choosing the Right CBSE School A Comprehensive Guide for Parents
Choosing the Right CBSE School A Comprehensive Guide for ParentsChoosing the Right CBSE School A Comprehensive Guide for Parents
Choosing the Right CBSE School A Comprehensive Guide for Parentsnavabharathschool99
 
Virtual-Orientation-on-the-Administration-of-NATG12-NATG6-and-ELLNA.pdf
Virtual-Orientation-on-the-Administration-of-NATG12-NATG6-and-ELLNA.pdfVirtual-Orientation-on-the-Administration-of-NATG12-NATG6-and-ELLNA.pdf
Virtual-Orientation-on-the-Administration-of-NATG12-NATG6-and-ELLNA.pdfErwinPantujan2
 
USPS® Forced Meter Migration - How to Know if Your Postage Meter Will Soon be...
USPS® Forced Meter Migration - How to Know if Your Postage Meter Will Soon be...USPS® Forced Meter Migration - How to Know if Your Postage Meter Will Soon be...
USPS® Forced Meter Migration - How to Know if Your Postage Meter Will Soon be...Postal Advocate Inc.
 
Activity 2-unit 2-update 2024. English translation
Activity 2-unit 2-update 2024. English translationActivity 2-unit 2-update 2024. English translation
Activity 2-unit 2-update 2024. English translationRosabel UA
 
4.16.24 Poverty and Precarity--Desmond.pptx
4.16.24 Poverty and Precarity--Desmond.pptx4.16.24 Poverty and Precarity--Desmond.pptx
4.16.24 Poverty and Precarity--Desmond.pptxmary850239
 
How to Add Barcode on PDF Report in Odoo 17
How to Add Barcode on PDF Report in Odoo 17How to Add Barcode on PDF Report in Odoo 17
How to Add Barcode on PDF Report in Odoo 17Celine George
 
Incoming and Outgoing Shipments in 3 STEPS Using Odoo 17
Incoming and Outgoing Shipments in 3 STEPS Using Odoo 17Incoming and Outgoing Shipments in 3 STEPS Using Odoo 17
Incoming and Outgoing Shipments in 3 STEPS Using Odoo 17Celine George
 
INTRODUCTION TO CATHOLIC CHRISTOLOGY.pptx
INTRODUCTION TO CATHOLIC CHRISTOLOGY.pptxINTRODUCTION TO CATHOLIC CHRISTOLOGY.pptx
INTRODUCTION TO CATHOLIC CHRISTOLOGY.pptxHumphrey A Beña
 
Transaction Management in Database Management System
Transaction Management in Database Management SystemTransaction Management in Database Management System
Transaction Management in Database Management SystemChristalin Nelson
 
MULTIDISCIPLINRY NATURE OF THE ENVIRONMENTAL STUDIES.pptx
MULTIDISCIPLINRY NATURE OF THE ENVIRONMENTAL STUDIES.pptxMULTIDISCIPLINRY NATURE OF THE ENVIRONMENTAL STUDIES.pptx
MULTIDISCIPLINRY NATURE OF THE ENVIRONMENTAL STUDIES.pptxAnupkumar Sharma
 
Q4-PPT-Music9_Lesson-1-Romantic-Opera.pptx
Q4-PPT-Music9_Lesson-1-Romantic-Opera.pptxQ4-PPT-Music9_Lesson-1-Romantic-Opera.pptx
Q4-PPT-Music9_Lesson-1-Romantic-Opera.pptxlancelewisportillo
 

Recently uploaded (20)

AUDIENCE THEORY -CULTIVATION THEORY - GERBNER.pptx
AUDIENCE THEORY -CULTIVATION THEORY -  GERBNER.pptxAUDIENCE THEORY -CULTIVATION THEORY -  GERBNER.pptx
AUDIENCE THEORY -CULTIVATION THEORY - GERBNER.pptx
 
GRADE 4 - SUMMATIVE TEST QUARTER 4 ALL SUBJECTS
GRADE 4 - SUMMATIVE TEST QUARTER 4 ALL SUBJECTSGRADE 4 - SUMMATIVE TEST QUARTER 4 ALL SUBJECTS
GRADE 4 - SUMMATIVE TEST QUARTER 4 ALL SUBJECTS
 
Visit to a blind student's school🧑‍🦯🧑‍🦯(community medicine)
Visit to a blind student's school🧑‍🦯🧑‍🦯(community medicine)Visit to a blind student's school🧑‍🦯🧑‍🦯(community medicine)
Visit to a blind student's school🧑‍🦯🧑‍🦯(community medicine)
 
Daily Lesson Plan in Mathematics Quarter 4
Daily Lesson Plan in Mathematics Quarter 4Daily Lesson Plan in Mathematics Quarter 4
Daily Lesson Plan in Mathematics Quarter 4
 
Full Stack Web Development Course for Beginners
Full Stack Web Development Course  for BeginnersFull Stack Web Development Course  for Beginners
Full Stack Web Development Course for Beginners
 
Field Attribute Index Feature in Odoo 17
Field Attribute Index Feature in Odoo 17Field Attribute Index Feature in Odoo 17
Field Attribute Index Feature in Odoo 17
 
ROLES IN A STAGE PRODUCTION in arts.pptx
ROLES IN A STAGE PRODUCTION in arts.pptxROLES IN A STAGE PRODUCTION in arts.pptx
ROLES IN A STAGE PRODUCTION in arts.pptx
 
Influencing policy (training slides from Fast Track Impact)
Influencing policy (training slides from Fast Track Impact)Influencing policy (training slides from Fast Track Impact)
Influencing policy (training slides from Fast Track Impact)
 
Choosing the Right CBSE School A Comprehensive Guide for Parents
Choosing the Right CBSE School A Comprehensive Guide for ParentsChoosing the Right CBSE School A Comprehensive Guide for Parents
Choosing the Right CBSE School A Comprehensive Guide for Parents
 
FINALS_OF_LEFT_ON_C'N_EL_DORADO_2024.pptx
FINALS_OF_LEFT_ON_C'N_EL_DORADO_2024.pptxFINALS_OF_LEFT_ON_C'N_EL_DORADO_2024.pptx
FINALS_OF_LEFT_ON_C'N_EL_DORADO_2024.pptx
 
Virtual-Orientation-on-the-Administration-of-NATG12-NATG6-and-ELLNA.pdf
Virtual-Orientation-on-the-Administration-of-NATG12-NATG6-and-ELLNA.pdfVirtual-Orientation-on-the-Administration-of-NATG12-NATG6-and-ELLNA.pdf
Virtual-Orientation-on-the-Administration-of-NATG12-NATG6-and-ELLNA.pdf
 
USPS® Forced Meter Migration - How to Know if Your Postage Meter Will Soon be...
USPS® Forced Meter Migration - How to Know if Your Postage Meter Will Soon be...USPS® Forced Meter Migration - How to Know if Your Postage Meter Will Soon be...
USPS® Forced Meter Migration - How to Know if Your Postage Meter Will Soon be...
 
Activity 2-unit 2-update 2024. English translation
Activity 2-unit 2-update 2024. English translationActivity 2-unit 2-update 2024. English translation
Activity 2-unit 2-update 2024. English translation
 
4.16.24 Poverty and Precarity--Desmond.pptx
4.16.24 Poverty and Precarity--Desmond.pptx4.16.24 Poverty and Precarity--Desmond.pptx
4.16.24 Poverty and Precarity--Desmond.pptx
 
How to Add Barcode on PDF Report in Odoo 17
How to Add Barcode on PDF Report in Odoo 17How to Add Barcode on PDF Report in Odoo 17
How to Add Barcode on PDF Report in Odoo 17
 
Incoming and Outgoing Shipments in 3 STEPS Using Odoo 17
Incoming and Outgoing Shipments in 3 STEPS Using Odoo 17Incoming and Outgoing Shipments in 3 STEPS Using Odoo 17
Incoming and Outgoing Shipments in 3 STEPS Using Odoo 17
 
INTRODUCTION TO CATHOLIC CHRISTOLOGY.pptx
INTRODUCTION TO CATHOLIC CHRISTOLOGY.pptxINTRODUCTION TO CATHOLIC CHRISTOLOGY.pptx
INTRODUCTION TO CATHOLIC CHRISTOLOGY.pptx
 
Transaction Management in Database Management System
Transaction Management in Database Management SystemTransaction Management in Database Management System
Transaction Management in Database Management System
 
MULTIDISCIPLINRY NATURE OF THE ENVIRONMENTAL STUDIES.pptx
MULTIDISCIPLINRY NATURE OF THE ENVIRONMENTAL STUDIES.pptxMULTIDISCIPLINRY NATURE OF THE ENVIRONMENTAL STUDIES.pptx
MULTIDISCIPLINRY NATURE OF THE ENVIRONMENTAL STUDIES.pptx
 
Q4-PPT-Music9_Lesson-1-Romantic-Opera.pptx
Q4-PPT-Music9_Lesson-1-Romantic-Opera.pptxQ4-PPT-Music9_Lesson-1-Romantic-Opera.pptx
Q4-PPT-Music9_Lesson-1-Romantic-Opera.pptx
 

Red Cross and Red Crescent World Disaster Report - Selected Data Tables

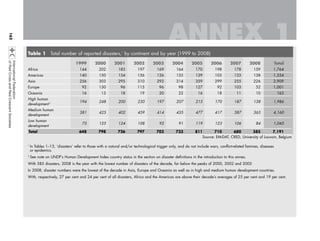
  • 1. 162 Table 1 Total number of reported disasters,1 by continent and by year (1999 to 2008) 1999 2000 2001 2002 2003 2004 2005 2006 2007 2008 Total Africa 144 202 183 197 169 164 170 198 178 159 1,764 Americas 140 150 134 156 126 135 139 103 133 138 1,354 Asia 256 303 295 310 292 314 359 299 255 226 2,909 Europe 92 130 96 115 96 98 127 92 103 52 1,001 Oceania 16 13 18 19 20 22 16 18 11 10 163 High human 194 248 200 230 197 207 215 170 187 138 1,986 development 2 Medium human 381 425 402 459 414 435 477 417 387 363 4,160 development Low human 73 125 124 108 92 91 119 123 106 84 1,045 development Total 648 798 726 797 703 733 811 710 680 585 7,191 Source: EM-DAT, CRED, University of Louvain, Belgium 1 In Tables 1–13, ‘disasters’ refer to those with a natural and/or technological trigger only, and do not include wars, conflict-related famines, diseases or epidemics. 2 See note on UNDP’s Human Development Index country status in the section on disaster definitions in the introduction to this annex. With 585 disasters, 2008 is the year with the lowest number of disasters of the decade, far below the peaks of 2000, 2002 and 2005 In 2008, disaster numbers were the lowest of the decade in Asia, Europe and Oceania as well as in high and medium human development countries. With, respectively, 27 per cent and 24 per cent of all disasters, Africa and the Americas are above their decade’s averages of 25 per cent and 19 per cent.
  • 2. 164 Table 3 Total number of people reported affected, by continent and by year (1999 to 2008), in thousands 1999 2000 2001 2002 2003 2004 2005 2006 2007 2008 Total 2 Africa 37,634 46,000 45,445 44,601 29,213 36,902 22,856 22,892 12,526 18,220 316,289 Americas 17,277 975 10,913 2,517 3,995 9,478 8,308 1,450 8,940 19,684 83,537 Asia 241,095 206,644 186,203 663,070 234,974 132,289 129,716 118,356 190,886 175,732 2,278,965 Europe 6,311 2,929 787 1,493 1,546 538 527 260 1,646 268 16,304 Oceania 151 7 31 41 38 119 28 38 172 92 718 High human 19,351 1,550 8,942 2,914 2,849 6,568 7,364 828 5,980 16,816 73,163 development 1 Medium human 262,389 225,821 212,343 687,582 248,008 155,809 136,039 122,275 199,723 184,070 2,434,060 development Low human 20,727 29,184 22,095 21,226 18,909 16,948 18,033 19,893 8,467 13,110 188,590 development Total 302,467 256,556 243,380 711,722 269,765 179,325 161,436 142,995 214,170 213,996 2,695,813 Source: EM-DAT, CRED, University of Louvain, Belgium 1 See note on UNDP’s Human Development Index country status in the section on disaster definitions in the introduction to this annex. 2 Since slow-onset disasters can affect the same people for a number of years, it is best to use figures on total numbers affected to calculate annual averages over a decade rather than as absolute totals. On the basis of available data, an average of around 270 million people were affected annually by disasters from 1999 to 2008, 85 per cent of them in Asia. In the Americas, the number of people affected was the highest of the decade. In the United States, a major flood affected 11 million people; in the Caribbean and the United States, Hurricane Gustav affected 2.1 million people; and in Brazil and Colombia, two floods affected a total of 2.5 million people. In 2008, the number of people affected by disaster living in Africa and Europe was the second lowest of the decade.
  • 3. 166 Table 5 Total number of reported disasters, by type of phenomenon and by year (1999 to 2008) 1999 2000 2001 2002 2003 2004 2005 2006 2007 2008 Total Droughts/food insecurity 31 42 42 40 23 19 28 19 13 15 272 Earthquakes/tsunamis 33 31 25 37 40 42 25 24 20 21 298 Extreme temperatures 8 31 23 15 25 16 29 24 25 8 204 Floods1 122 158 157 171 159 129 195 227 219 158 1,695 Forest/scrub fires 22 30 14 22 14 8 13 9 18 4 154 Insect infestation ndr 2 2 ndr ndr 12 ndr ndr ndr ndr 16 Mass movement: dry2 ndr 1 ndr 1 ndr 1 ndr 1 ndr 3 7 Mass movement: wet3 18 28 24 20 21 15 12 20 10 12 180 Volcanic eruptions 5 5 6 7 2 5 8 12 6 6 62 Windstorms 106 102 108 124 85 127 130 76 105 99 1,062 Subtotal climato-, hydro- 307 393 370 392 327 326 407 375 390 296 3,583 meteorological disasters Subtotal geophysical 38 37 31 45 42 48 33 37 26 30 367 disasters Total natural disasters 345 430 401 437 369 374 440 412 416 326 3,950 Industrial accidents 37 51 54 48 52 81 76 61 52 38 550 Miscellaneous accidents 52 58 50 52 45 62 66 32 42 30 489 Transport accidents 214 259 221 260 237 216 229 205 170 191 2,202 Total technological 303 368 325 360 334 359 371 298 264 259 3,241 disasters Total 648 798 726 797 703 733 811 710 680 585 7,191 Source: EM-DAT, CRED, University of Louvain, Belgium 1 Includes waves and surges. 2 Landslides, rockfalls, subsidence of geophysical origin. 3 Mud/landslides, avalanches, subsidence of hydrological origin. Note: ndr signifies no disaster reported. For more information, see section on caveats in introductory text. In 2008, the numbers of both natural and technological disasters were the lowest of the decade, as were the numbers of forest/scrub fires and of miscellaneous accidents. In 2008, the most frequent disasters were transport accidents (33 per cent), floods (27 per cent) and windstorms (17 per cent), near their average for the decade.