SlideShare a Scribd company logo
1 of 11
Download to read offline
1
How Do You Do?
Measuring Enterprise GIS Performance
For the King County GIS Center
2007 Washington GIS Conference
April 24, 2007
Greg Babinski, GISP
Finance & Marketing Manager
King County GIS Center
“Putting GIS to Work for King County”
King County, Washington
Microsoft
Boeing
Paccar
Nordstrom's
Amazon.Com
Starbucks
Port of Seattle
Weyerhaeuser
Washington Mutual
Univ. of Washington
Population (2006 USCB est.): 1,826,000 (14th most populous US county)
Area: 2130 square miles (sea level to 8,000’)
39 incorporated cities
Viable agricultural and private forestry areas
Remote wilderness & watershed lands
2
What Are Typical GIS-Related
Performance Measures?
www.metrokc.gov/gis
GIS staff performance appraisals
Technical system performance tests
Data accuracy analysis
Data currency standards/backlog status
Project close-out reports/lessons-learned
Input-oriented
Others?
Why Study Enterprise GIS
Performance Measures?
www.metrokc.gov/gis
GIS is an integrated system – focus on integrated
system performance
Customers rely on the integrated system
Objective validation of program success
Program/project return on investment results
Results oriented
Performance measures can drive future direction
Elected officials, State Auditors & Citizens expect
accountability
Others?
3
King County GIS
The King County Geographic Information System (KCGIS) is a
consolidated and coordinated regional geographic information
resource, organized to meet the business needs of King County,
local agencies, and the general public.
KCGIS is comprised of both the King County GIS Center (an internal
service fund, responsible for core GIS resources and enterprise GIS
services for the entire County) and business specific activity in
various GIS programs distributed across other County agencies.
KCGIS is managed by the Director of DNRP, supported by a
management level GIS Oversight Committee and an operational
level GIS Technical Committee.
www.metrokc.gov/gis
How is GIS Used for King County Business?
Mapping
Public information delivery
Growth management & planning
Property assessment
Land development permitting
Site selection
Simulating environmental conditions
Emergency response planning
Crime analysis
Transportation planning
Bus & van routing
Road maintenance management
Public health service delivery
E911 operations
Airport sound abatement
Boundary management (legislative
districts, voter precincts, tax unit
boundaries, etc.)
And the list goes on…..
www.metrokc.gov/gis
4
King County GIS Internal Service Fund
What is an internal service fund?
Full financial and operational responsibility for
providing designated services
Agencies receiving services or benefit are
required to budget for internal service fund costs
Chartered to operate on an entrepreneurial basis
– both within the county and externally
www.metrokc.gov/gis
Enterprise Operations:
GIS Data Warehouse Management
GIS Systems Administration
Enterprise GIS Data Coordination
Core GIS User Applications
Matrixed GIS Staffing Services
On-Demand GIS Client Services:
GIS Consulting
Application Development
Training
Mapping & Analysis
KCGIS Center Business Lines
5
King County Policy Goals:
Drive Agency Vision, Mission & Program Goals
County Executive 2007 Budget Priorities:
Services mandated by state law will be prioritized over services that
are not mandated.
Services provided on a regional basis will be prioritized over local
services.
Local services provided to unincorporated areas will be prioritized
over local services in cities.
Direct services to the public will be prioritized over administrative
functions, except where the county has a legal obligation to
maintain adequate financial and administrative oversight to assure
appropriate monitoring and control over public funds.
Fees will fully cover the cost of providing the services where
possible.
Contracts for services with cities or others will provide for full cost
recovery.
www.metrokc.gov/gis
King County GIS Center
Vision, Mission & Program Goals
MISSION:
To work in partnership with county agencies to provide accurate,
consistent, accessible, affordable, and comprehensive GIS data, GIS
infrastructure and GIS services to support the unique business needs
of King County and the communities we serve.
VISION:
The King County GIS Center is the premier regional provider of spatial
information & GIS services.
PROGRAM GOALS:
Increase efficiencies & effectiveness of spatial data & GIS applications.
Provide a valued regional resource of spatial information & GIS
expertise.
Increase ability of county agencies to meet their business needs.
Increase ability of citizens to access useful information about King
County.
www.metrokc.gov/gis
6
Program Goals Drive Core Business Operations:
Increase efficiencies and effectiveness of spatial data and GIS
applications:
GIS Enterprise Operations
Provide a valued regional resource of spatial information and
GIS expertise:
GIS Enterprise Operations
GIS Client Services
Increase ability of county agencies to meet their business needs:
GIS Matrix Staff Services
GIS Client Services
Increase ability of citizens to access useful information about
King County:
GIS Enterprise Operations
www.metrokc.gov/gis
Program Goals Drive Performance Measures
Performance Goal - Core Business – Performance Measure
Increase efficiencies and effectiveness of spatial data and GIS
applications:
GIS Enterprise Operations:
Performance Measure: Percent of data issues resolved through
efforts of data coordination program
2006 Target: 90%
2007 Target: 90%
Performance Data:
2003: N/A
2004: 89%
2005: 98%
Context:
There were 280 data issues logged by the KCGIS Center data
coordinator in 2005. Of these 275 (98%) were satisfactorily resolved.
www.metrokc.gov/gis
Program Goals Drive Performance Measures
7
Performance Goal - Core Business – Performance Measure
Provide a valued regional resource of spatial information and
GIS expertise:
GIS Enterprise Operations:
Performance Measure: Percent change in user sessions for Web
mapping services over previous year
2006 Target: 10%
2007 Target: 10%
Performance Data:
2003: 75%
2004: 46%
2005: 28%
Context:
There were 1,582,199 user sessions in 2004 and 2,028,013 user
sessions in 2005 for an increase of 445,814 (28%).
www.metrokc.gov/gis
Program Goals Drive Performance Measures
Performance Goal - Core Business – Performance Measure
Provide a valued regional resource of spatial information and
GIS expertise:
GIS Client Services:
Performance Measure: Percent of contacts at local jurisdictions
that view the KCGIS Center as a valued resource for spatial data
and services
2006 Target: 75%
2007 Target: 75%
Performance Data:
2003: NA
2004: 62%
2005: 75%
Context:
Based on survey of contacts at King County cities and tribes conducted
in 2005 & 2006.
www.metrokc.gov/gis
Program Goals Drive Performance Measures
8
Performance Goal - Core Business – Performance Measure
Increase the Ability of County Agencies to Meet Their Business
Needs
GIS Matrix Staff Services:
Percent of GIS Oversight Committee and GIS Technical Committee
members rating KCGIS Center services as satisfactory or better
2006 Target: 90%
2007 Target: 90%
Performance Data:
2003: NA
2005: 100%
2006: 100%
Context:
Based on survey of members of Technical and Oversight committees
conducted in 2005 & 2006.
www.metrokc.gov/gis
Program Goals Drive Performance Measures
Performance Goal - Core Business – Performance Measure
Increase the Ability of County Agencies to Meet Their Business
Needs
GIS Client Services:
Performance Measure: Percent increase in client services
customers over previous year
2006 Target: 10%
2007 Target: 10%
Performance Data:
2003: 19%
2004: 70%
2005: 6%
Context:
Client Services had 107 unique customers in 2004 and 113 unique
customers in 2005, an increase of 6%
www.metrokc.gov/gis
Program Goals Drive Performance Measures
9
Performance Goal - Core Business – Performance Measure
Increase the Ability of County Agencies to Meet Their Business
Needs
GIS Client Services:
Performance Measure: Percent retention rate of client services
customers from previous year
2006 Target: 40%
2007 Target: 40%
Performance Data:
2003: 42%
2004: 71%
2005: 33%
Context:
35 of 107 Client Services customers from 2004 returned for business in
2005 for a retention rate of 33%
www.metrokc.gov/gis
Program Goals Drive Performance Measures
Performance Goal - Core Business – Performance Measure
Increase ability of citizens to access useful information about
King County:
GIS Enterprise Operations:
Performance Measure: Percent of users rating ease of use of
KCGIS Web mapping services as easy to very easy.
2006 Target: 80%
2007 Target: 80%
Performance Data:
2003: NA
2004: 83%
2005: NA
Context:
An online user satisfaction survey was conducted in June 2006.
Beginning in 2006 surveys will be conducted annually.
www.metrokc.gov/gis
Program Goals Drive Performance Measures
10
Performance Goal - Core Business – Performance Measure
Increase ability of citizens to access useful information about
King County:
GIS Enterprise Operations:
Performance Measure: Percent of availability of KCGIS Web
mapping services during normal business hours
2006 Target: 98%
2007 Target: 98%
Performance Data:
2003: 99%
2004: 96%
2005: 99.5%
Context:
Web mapping services were available for 2,070 of 2,080 business
hours in 2005 (99.5%). Total up time in 2005 was 8,748 hours of
8,760 (99.9%).
www.metrokc.gov/gis
Program Goals Drive Performance Measures
King County GIS Center
Performance Measurements
www.metrokc.gov/gis
Benefits and Results
Validates program viability
Customer focussed results
Program-wide snapshot
Results (output focus) vs input focus
Useful management tool
Trace program issues to source
Identify resource allocation issues & opportunities
Useful CRM/marketing tool
Identifies customer service issues
Establishes credibility/quality
Useful budgeting tool
Feedback loop into budget process
Identifies needs and develops support for new programs
11
Conclusions & Questions
www.metrokc.gov/gis
Value of GIS Program Performance Measures:
GIS Program Management Tool
Customer Relationship Development Tool
Can Support Effective Budget Development
Can Help Meet Auditor & Taxpayer Expectations
Questions?
Greg Babinski, GISP
Finance & Marketing Manager
King County GIS Center
201 South Jackson Street
Seattle, WA 98104
Greg.babinski@metrokc.gov

More Related Content

What's hot

Managing a County GIS for Results
Managing a County GIS for ResultsManaging a County GIS for Results
Managing a County GIS for ResultsGreg Babinski
 
CGMap and Ongoing Research: Putting CGIAR Research on the Map
CGMap and Ongoing Research: Putting CGIAR Research on the MapCGMap and Ongoing Research: Putting CGIAR Research on the Map
CGMap and Ongoing Research: Putting CGIAR Research on the Mapcgxchange
 
E govt Strategy in aspect of Cloud Computing
E govt Strategy in aspect of Cloud ComputingE govt Strategy in aspect of Cloud Computing
E govt Strategy in aspect of Cloud ComputingKhurram Shehzad
 
CGIAR ICT Roadmap
CGIAR ICT RoadmapCGIAR ICT Roadmap
CGIAR ICT Roadmapcgxchange
 
Introduction to e-Gov Competency Framework (e-GCF) for Digital India Amit S...
Introduction to e-Gov Competency Framework (e-GCF) for Digital India   Amit S...Introduction to e-Gov Competency Framework (e-GCF) for Digital India   Amit S...
Introduction to e-Gov Competency Framework (e-GCF) for Digital India Amit S...Amit Srivastava
 
2010 ISAP Conference 2010 Using Internet and Social Media in Immigrant Settle...
2010 ISAP Conference 2010 Using Internet and Social Media in Immigrant Settle...2010 ISAP Conference 2010 Using Internet and Social Media in Immigrant Settle...
2010 ISAP Conference 2010 Using Internet and Social Media in Immigrant Settle...settlementatwork
 

What's hot (8)

Managing a County GIS for Results
Managing a County GIS for ResultsManaging a County GIS for Results
Managing a County GIS for Results
 
APR Workshop 2010-Participatory Monitoring & Evaluation-Susan Perez
APR Workshop 2010-Participatory Monitoring & Evaluation-Susan PerezAPR Workshop 2010-Participatory Monitoring & Evaluation-Susan Perez
APR Workshop 2010-Participatory Monitoring & Evaluation-Susan Perez
 
APR Workshop 2010-Monitoring and Evaluation (2)- Susan Perez
APR Workshop 2010-Monitoring and Evaluation (2)- Susan PerezAPR Workshop 2010-Monitoring and Evaluation (2)- Susan Perez
APR Workshop 2010-Monitoring and Evaluation (2)- Susan Perez
 
CGMap and Ongoing Research: Putting CGIAR Research on the Map
CGMap and Ongoing Research: Putting CGIAR Research on the MapCGMap and Ongoing Research: Putting CGIAR Research on the Map
CGMap and Ongoing Research: Putting CGIAR Research on the Map
 
E govt Strategy in aspect of Cloud Computing
E govt Strategy in aspect of Cloud ComputingE govt Strategy in aspect of Cloud Computing
E govt Strategy in aspect of Cloud Computing
 
CGIAR ICT Roadmap
CGIAR ICT RoadmapCGIAR ICT Roadmap
CGIAR ICT Roadmap
 
Introduction to e-Gov Competency Framework (e-GCF) for Digital India Amit S...
Introduction to e-Gov Competency Framework (e-GCF) for Digital India   Amit S...Introduction to e-Gov Competency Framework (e-GCF) for Digital India   Amit S...
Introduction to e-Gov Competency Framework (e-GCF) for Digital India Amit S...
 
2010 ISAP Conference 2010 Using Internet and Social Media in Immigrant Settle...
2010 ISAP Conference 2010 Using Internet and Social Media in Immigrant Settle...2010 ISAP Conference 2010 Using Internet and Social Media in Immigrant Settle...
2010 ISAP Conference 2010 Using Internet and Social Media in Immigrant Settle...
 

Similar to Measuring Enterprise GIS Performance For the King County GIS Center

Analyzing GIS Staff Usage and Allocation for Improved GIS Operations
Analyzing GIS Staff Usage and Allocation for Improved GIS OperationsAnalyzing GIS Staff Usage and Allocation for Improved GIS Operations
Analyzing GIS Staff Usage and Allocation for Improved GIS OperationsGreg Babinski
 
THE ROLE OF REGIONAL GEOSPATIAL COORDINATION FOR EFFECTIVE CITY MANAGEMENT
THE ROLE OF REGIONAL GEOSPATIAL COORDINATION FOR EFFECTIVE CITY MANAGEMENTTHE ROLE OF REGIONAL GEOSPATIAL COORDINATION FOR EFFECTIVE CITY MANAGEMENT
THE ROLE OF REGIONAL GEOSPATIAL COORDINATION FOR EFFECTIVE CITY MANAGEMENTGreg Babinski
 
URISA GIS Management Institute® The GIS Capability Maturity Model and the GMI...
URISA GIS Management Institute® The GIS Capability Maturity Model and the GMI...URISA GIS Management Institute® The GIS Capability Maturity Model and the GMI...
URISA GIS Management Institute® The GIS Capability Maturity Model and the GMI...Greg Babinski
 
You Can’t Manage What you Don’t Measure URISA’s Proposed Municipal GIS Capab...
You Can’t Manage What you Don’t Measure  URISA’s Proposed Municipal GIS Capab...You Can’t Manage What you Don’t Measure  URISA’s Proposed Municipal GIS Capab...
You Can’t Manage What you Don’t Measure URISA’s Proposed Municipal GIS Capab...Greg Babinski
 
Using ROI Methodology to Document the Benefits of King County GIS
Using ROI Methodology to Document the Benefits of King County GISUsing ROI Methodology to Document the Benefits of King County GIS
Using ROI Methodology to Document the Benefits of King County GISGreg Babinski
 
The State of GIS in Washington & Oregon The 2014 GMI Metric Survey
The State of GIS in Washington & Oregon  The 2014 GMI Metric SurveyThe State of GIS in Washington & Oregon  The 2014 GMI Metric Survey
The State of GIS in Washington & Oregon The 2014 GMI Metric SurveyGreg Babinski
 
GIS Return on Investment
GIS Return on InvestmentGIS Return on Investment
GIS Return on InvestmentGreg Babinski
 
King County GIS ROI Study
King County GIS ROI StudyKing County GIS ROI Study
King County GIS ROI StudyGreg Babinski
 
Leveraging ArcGIS Platform & CityEngine for GIS based Master Plans
Leveraging ArcGIS Platform & CityEngine for GIS based Master PlansLeveraging ArcGIS Platform & CityEngine for GIS based Master Plans
Leveraging ArcGIS Platform & CityEngine for GIS based Master PlansEsri India
 
King County Information Technology
King County Information TechnologyKing County Information Technology
King County Information TechnologyJamie Holter
 
Defining the Cost and Determining the Value of Enterprise GIS
Defining the Cost and Determining the Value of Enterprise GISDefining the Cost and Determining the Value of Enterprise GIS
Defining the Cost and Determining the Value of Enterprise GISGreg Babinski
 
URISA, the Geospatial Revolution, and the GIS Management Institute
URISA, the Geospatial Revolution, and the GIS Management InstituteURISA, the Geospatial Revolution, and the GIS Management Institute
URISA, the Geospatial Revolution, and the GIS Management InstituteGreg Babinski
 
GIS Needs Assessment & Planning for Community & Human Services
GIS Needs Assessment & Planning for Community & Human ServicesGIS Needs Assessment & Planning for Community & Human Services
GIS Needs Assessment & Planning for Community & Human ServicesGreg Babinski
 
TechM GIS Utilities
TechM GIS UtilitiesTechM GIS Utilities
TechM GIS UtilitiesTechM-GIS
 
How to successfully implement sap ami
How to successfully implement sap amiHow to successfully implement sap ami
How to successfully implement sap amirobgirvan
 
Full planning support system at your fingertips mvopc p&z_120712
Full planning support system at your fingertips mvopc p&z_120712Full planning support system at your fingertips mvopc p&z_120712
Full planning support system at your fingertips mvopc p&z_120712MVRPC
 

Similar to Measuring Enterprise GIS Performance For the King County GIS Center (20)

Analyzing GIS Staff Usage and Allocation for Improved GIS Operations
Analyzing GIS Staff Usage and Allocation for Improved GIS OperationsAnalyzing GIS Staff Usage and Allocation for Improved GIS Operations
Analyzing GIS Staff Usage and Allocation for Improved GIS Operations
 
THE ROLE OF REGIONAL GEOSPATIAL COORDINATION FOR EFFECTIVE CITY MANAGEMENT
THE ROLE OF REGIONAL GEOSPATIAL COORDINATION FOR EFFECTIVE CITY MANAGEMENTTHE ROLE OF REGIONAL GEOSPATIAL COORDINATION FOR EFFECTIVE CITY MANAGEMENT
THE ROLE OF REGIONAL GEOSPATIAL COORDINATION FOR EFFECTIVE CITY MANAGEMENT
 
URISA GIS Management Institute® The GIS Capability Maturity Model and the GMI...
URISA GIS Management Institute® The GIS Capability Maturity Model and the GMI...URISA GIS Management Institute® The GIS Capability Maturity Model and the GMI...
URISA GIS Management Institute® The GIS Capability Maturity Model and the GMI...
 
You Can’t Manage What you Don’t Measure URISA’s Proposed Municipal GIS Capab...
You Can’t Manage What you Don’t Measure  URISA’s Proposed Municipal GIS Capab...You Can’t Manage What you Don’t Measure  URISA’s Proposed Municipal GIS Capab...
You Can’t Manage What you Don’t Measure URISA’s Proposed Municipal GIS Capab...
 
Using ROI Methodology to Document the Benefits of King County GIS
Using ROI Methodology to Document the Benefits of King County GISUsing ROI Methodology to Document the Benefits of King County GIS
Using ROI Methodology to Document the Benefits of King County GIS
 
The State of GIS in Washington & Oregon The 2014 GMI Metric Survey
The State of GIS in Washington & Oregon  The 2014 GMI Metric SurveyThe State of GIS in Washington & Oregon  The 2014 GMI Metric Survey
The State of GIS in Washington & Oregon The 2014 GMI Metric Survey
 
GIS Return on Investment
GIS Return on InvestmentGIS Return on Investment
GIS Return on Investment
 
King County GIS ROI Study
King County GIS ROI StudyKing County GIS ROI Study
King County GIS ROI Study
 
Leveraging ArcGIS Platform & CityEngine for GIS based Master Plans
Leveraging ArcGIS Platform & CityEngine for GIS based Master PlansLeveraging ArcGIS Platform & CityEngine for GIS based Master Plans
Leveraging ArcGIS Platform & CityEngine for GIS based Master Plans
 
Utah Reorganizes its GIS Around Web Services
Utah Reorganizes its GIS Around Web ServicesUtah Reorganizes its GIS Around Web Services
Utah Reorganizes its GIS Around Web Services
 
GIS in Utah
GIS in UtahGIS in Utah
GIS in Utah
 
DC GIS Strategic Plan
DC GIS Strategic PlanDC GIS Strategic Plan
DC GIS Strategic Plan
 
King County Information Technology
King County Information TechnologyKing County Information Technology
King County Information Technology
 
Enterprise GIS Planning and Framework
Enterprise GIS Planning and FrameworkEnterprise GIS Planning and Framework
Enterprise GIS Planning and Framework
 
Defining the Cost and Determining the Value of Enterprise GIS
Defining the Cost and Determining the Value of Enterprise GISDefining the Cost and Determining the Value of Enterprise GIS
Defining the Cost and Determining the Value of Enterprise GIS
 
URISA, the Geospatial Revolution, and the GIS Management Institute
URISA, the Geospatial Revolution, and the GIS Management InstituteURISA, the Geospatial Revolution, and the GIS Management Institute
URISA, the Geospatial Revolution, and the GIS Management Institute
 
GIS Needs Assessment & Planning for Community & Human Services
GIS Needs Assessment & Planning for Community & Human ServicesGIS Needs Assessment & Planning for Community & Human Services
GIS Needs Assessment & Planning for Community & Human Services
 
TechM GIS Utilities
TechM GIS UtilitiesTechM GIS Utilities
TechM GIS Utilities
 
How to successfully implement sap ami
How to successfully implement sap amiHow to successfully implement sap ami
How to successfully implement sap ami
 
Full planning support system at your fingertips mvopc p&z_120712
Full planning support system at your fingertips mvopc p&z_120712Full planning support system at your fingertips mvopc p&z_120712
Full planning support system at your fingertips mvopc p&z_120712
 

More from Greg Babinski

GMA GIS Return on Investment (ROI) Template
GMA GIS Return on Investment (ROI) TemplateGMA GIS Return on Investment (ROI) Template
GMA GIS Return on Investment (ROI) TemplateGreg Babinski
 
GMI-GMCM Assessment Scale.pdf
GMI-GMCM Assessment Scale.pdfGMI-GMCM Assessment Scale.pdf
GMI-GMCM Assessment Scale.pdfGreg Babinski
 
IMPROVING ENTERPRISE GIS OPERATIONS VIA STAFF USAGE ANALYSIS AND SURVEYS
IMPROVING ENTERPRISE GIS OPERATIONS VIA STAFF USAGE ANALYSIS AND SURVEYSIMPROVING ENTERPRISE GIS OPERATIONS VIA STAFF USAGE ANALYSIS AND SURVEYS
IMPROVING ENTERPRISE GIS OPERATIONS VIA STAFF USAGE ANALYSIS AND SURVEYSGreg Babinski
 
BURISA News Issue 192
BURISA News Issue 192BURISA News Issue 192
BURISA News Issue 192Greg Babinski
 
URISA Newsletter Issue 193
URISA Newsletter Issue 193URISA Newsletter Issue 193
URISA Newsletter Issue 193Greg Babinski
 
BURISA Newsletter Issue 194 (Final Issue)
BURISA Newsletter Issue 194 (Final Issue)BURISA Newsletter Issue 194 (Final Issue)
BURISA Newsletter Issue 194 (Final Issue)Greg Babinski
 
King County GIS Funding and Billing Procedures 2015-2016
King County GIS Funding and Billing Procedures 2015-2016King County GIS Funding and Billing Procedures 2015-2016
King County GIS Funding and Billing Procedures 2015-2016Greg Babinski
 
GIS for Equity & Social Justice Best Practices
GIS for Equity & Social Justice Best PracticesGIS for Equity & Social Justice Best Practices
GIS for Equity & Social Justice Best PracticesGreg Babinski
 
GIS v. IT - One of these things is not like the other
GIS v. IT - One of these things is not like the otherGIS v. IT - One of these things is not like the other
GIS v. IT - One of these things is not like the otherGreg Babinski
 
Babinski geography as human ecology wsu19720614
Babinski geography as human ecology wsu19720614Babinski geography as human ecology wsu19720614
Babinski geography as human ecology wsu19720614Greg Babinski
 
Examining the meaning of confederate civil war monuments
Examining the meaning of confederate civil war monumentsExamining the meaning of confederate civil war monuments
Examining the meaning of confederate civil war monumentsGreg Babinski
 
Martin Luther King, William Bunge, URISA, and GIS for Equity and Social Justi...
Martin Luther King, William Bunge, URISA, and GIS for Equity and Social Justi...Martin Luther King, William Bunge, URISA, and GIS for Equity and Social Justi...
Martin Luther King, William Bunge, URISA, and GIS for Equity and Social Justi...Greg Babinski
 
The future of urisa as an international organization
The future of urisa as an international organizationThe future of urisa as an international organization
The future of urisa as an international organizationGreg Babinski
 
URISA’s GIS Management Institute
URISA’s GIS Management InstituteURISA’s GIS Management Institute
URISA’s GIS Management InstituteGreg Babinski
 
2002 KCGIS O&M Issue Status Report #4: Status of Original GIS Capital Project...
2002 KCGIS O&M Issue Status Report #4: Status of Original GIS Capital Project...2002 KCGIS O&M Issue Status Report #4: Status of Original GIS Capital Project...
2002 KCGIS O&M Issue Status Report #4: Status of Original GIS Capital Project...Greg Babinski
 
A Day in the Life of King County GIS
A Day in the Life of King County GISA Day in the Life of King County GIS
A Day in the Life of King County GISGreg Babinski
 
URISA Geospatial Management Competency Model - Strawman Draft
URISA Geospatial Management Competency Model - Strawman DraftURISA Geospatial Management Competency Model - Strawman Draft
URISA Geospatial Management Competency Model - Strawman DraftGreg Babinski
 
Draft Municipal GIS Capability Maturity Model
Draft Municipal GIS Capability Maturity ModelDraft Municipal GIS Capability Maturity Model
Draft Municipal GIS Capability Maturity ModelGreg Babinski
 
Flight of the Malfunction: My 2013 Trip to Morotai & WWII 13th AAF Sites
Flight of the Malfunction: My 2013 Trip to Morotai & WWII 13th AAF SitesFlight of the Malfunction: My 2013 Trip to Morotai & WWII 13th AAF Sites
Flight of the Malfunction: My 2013 Trip to Morotai & WWII 13th AAF SitesGreg Babinski
 
A Survey and Analysis of GIS Web Mapping Applications in Washington State
A Survey and Analysis of GIS Web Mapping Applications in Washington StateA Survey and Analysis of GIS Web Mapping Applications in Washington State
A Survey and Analysis of GIS Web Mapping Applications in Washington StateGreg Babinski
 

More from Greg Babinski (20)

GMA GIS Return on Investment (ROI) Template
GMA GIS Return on Investment (ROI) TemplateGMA GIS Return on Investment (ROI) Template
GMA GIS Return on Investment (ROI) Template
 
GMI-GMCM Assessment Scale.pdf
GMI-GMCM Assessment Scale.pdfGMI-GMCM Assessment Scale.pdf
GMI-GMCM Assessment Scale.pdf
 
IMPROVING ENTERPRISE GIS OPERATIONS VIA STAFF USAGE ANALYSIS AND SURVEYS
IMPROVING ENTERPRISE GIS OPERATIONS VIA STAFF USAGE ANALYSIS AND SURVEYSIMPROVING ENTERPRISE GIS OPERATIONS VIA STAFF USAGE ANALYSIS AND SURVEYS
IMPROVING ENTERPRISE GIS OPERATIONS VIA STAFF USAGE ANALYSIS AND SURVEYS
 
BURISA News Issue 192
BURISA News Issue 192BURISA News Issue 192
BURISA News Issue 192
 
URISA Newsletter Issue 193
URISA Newsletter Issue 193URISA Newsletter Issue 193
URISA Newsletter Issue 193
 
BURISA Newsletter Issue 194 (Final Issue)
BURISA Newsletter Issue 194 (Final Issue)BURISA Newsletter Issue 194 (Final Issue)
BURISA Newsletter Issue 194 (Final Issue)
 
King County GIS Funding and Billing Procedures 2015-2016
King County GIS Funding and Billing Procedures 2015-2016King County GIS Funding and Billing Procedures 2015-2016
King County GIS Funding and Billing Procedures 2015-2016
 
GIS for Equity & Social Justice Best Practices
GIS for Equity & Social Justice Best PracticesGIS for Equity & Social Justice Best Practices
GIS for Equity & Social Justice Best Practices
 
GIS v. IT - One of these things is not like the other
GIS v. IT - One of these things is not like the otherGIS v. IT - One of these things is not like the other
GIS v. IT - One of these things is not like the other
 
Babinski geography as human ecology wsu19720614
Babinski geography as human ecology wsu19720614Babinski geography as human ecology wsu19720614
Babinski geography as human ecology wsu19720614
 
Examining the meaning of confederate civil war monuments
Examining the meaning of confederate civil war monumentsExamining the meaning of confederate civil war monuments
Examining the meaning of confederate civil war monuments
 
Martin Luther King, William Bunge, URISA, and GIS for Equity and Social Justi...
Martin Luther King, William Bunge, URISA, and GIS for Equity and Social Justi...Martin Luther King, William Bunge, URISA, and GIS for Equity and Social Justi...
Martin Luther King, William Bunge, URISA, and GIS for Equity and Social Justi...
 
The future of urisa as an international organization
The future of urisa as an international organizationThe future of urisa as an international organization
The future of urisa as an international organization
 
URISA’s GIS Management Institute
URISA’s GIS Management InstituteURISA’s GIS Management Institute
URISA’s GIS Management Institute
 
2002 KCGIS O&M Issue Status Report #4: Status of Original GIS Capital Project...
2002 KCGIS O&M Issue Status Report #4: Status of Original GIS Capital Project...2002 KCGIS O&M Issue Status Report #4: Status of Original GIS Capital Project...
2002 KCGIS O&M Issue Status Report #4: Status of Original GIS Capital Project...
 
A Day in the Life of King County GIS
A Day in the Life of King County GISA Day in the Life of King County GIS
A Day in the Life of King County GIS
 
URISA Geospatial Management Competency Model - Strawman Draft
URISA Geospatial Management Competency Model - Strawman DraftURISA Geospatial Management Competency Model - Strawman Draft
URISA Geospatial Management Competency Model - Strawman Draft
 
Draft Municipal GIS Capability Maturity Model
Draft Municipal GIS Capability Maturity ModelDraft Municipal GIS Capability Maturity Model
Draft Municipal GIS Capability Maturity Model
 
Flight of the Malfunction: My 2013 Trip to Morotai & WWII 13th AAF Sites
Flight of the Malfunction: My 2013 Trip to Morotai & WWII 13th AAF SitesFlight of the Malfunction: My 2013 Trip to Morotai & WWII 13th AAF Sites
Flight of the Malfunction: My 2013 Trip to Morotai & WWII 13th AAF Sites
 
A Survey and Analysis of GIS Web Mapping Applications in Washington State
A Survey and Analysis of GIS Web Mapping Applications in Washington StateA Survey and Analysis of GIS Web Mapping Applications in Washington State
A Survey and Analysis of GIS Web Mapping Applications in Washington State
 

Recently uploaded

From Red to Green: Enhancing Decision-Making with Traffic Light Assessment
From Red to Green: Enhancing Decision-Making with Traffic Light AssessmentFrom Red to Green: Enhancing Decision-Making with Traffic Light Assessment
From Red to Green: Enhancing Decision-Making with Traffic Light AssessmentCIToolkit
 
原版1:1复刻密西西比大学毕业证Mississippi毕业证留信学历认证
原版1:1复刻密西西比大学毕业证Mississippi毕业证留信学历认证原版1:1复刻密西西比大学毕业证Mississippi毕业证留信学历认证
原版1:1复刻密西西比大学毕业证Mississippi毕业证留信学历认证jdkhjh
 
How-How Diagram: A Practical Approach to Problem Resolution
How-How Diagram: A Practical Approach to Problem ResolutionHow-How Diagram: A Practical Approach to Problem Resolution
How-How Diagram: A Practical Approach to Problem ResolutionCIToolkit
 
Choosing the best strategy qspm matrix.pptx
Choosing the best strategy qspm matrix.pptxChoosing the best strategy qspm matrix.pptx
Choosing the best strategy qspm matrix.pptxMadan Karki
 
The Final Activity in Project Management
The Final Activity in Project ManagementThe Final Activity in Project Management
The Final Activity in Project ManagementCIToolkit
 
Paired Comparison Analysis: A Practical Tool for Evaluating Options and Prior...
Paired Comparison Analysis: A Practical Tool for Evaluating Options and Prior...Paired Comparison Analysis: A Practical Tool for Evaluating Options and Prior...
Paired Comparison Analysis: A Practical Tool for Evaluating Options and Prior...CIToolkit
 
Beyond the Five Whys: Exploring the Hierarchical Causes with the Why-Why Diagram
Beyond the Five Whys: Exploring the Hierarchical Causes with the Why-Why DiagramBeyond the Five Whys: Exploring the Hierarchical Causes with the Why-Why Diagram
Beyond the Five Whys: Exploring the Hierarchical Causes with the Why-Why DiagramCIToolkit
 
Farmer Representative Organization in Lucknow | Rashtriya Kisan Manch
Farmer Representative Organization in Lucknow | Rashtriya Kisan ManchFarmer Representative Organization in Lucknow | Rashtriya Kisan Manch
Farmer Representative Organization in Lucknow | Rashtriya Kisan ManchRashtriya Kisan Manch
 
Digital PR Summit - Leadership Lessons: Myths, Mistakes, & Toxic Traits
Digital PR Summit - Leadership Lessons: Myths, Mistakes, & Toxic TraitsDigital PR Summit - Leadership Lessons: Myths, Mistakes, & Toxic Traits
Digital PR Summit - Leadership Lessons: Myths, Mistakes, & Toxic TraitsHannah Smith
 
Measuring True Process Yield using Robust Yield Metrics
Measuring True Process Yield using Robust Yield MetricsMeasuring True Process Yield using Robust Yield Metrics
Measuring True Process Yield using Robust Yield MetricsCIToolkit
 
Mind Mapping: A Visual Approach to Organize Ideas and Thoughts
Mind Mapping: A Visual Approach to Organize Ideas and ThoughtsMind Mapping: A Visual Approach to Organize Ideas and Thoughts
Mind Mapping: A Visual Approach to Organize Ideas and ThoughtsCIToolkit
 
Simplifying Complexity: How the Four-Field Matrix Reshapes Thinking
Simplifying Complexity: How the Four-Field Matrix Reshapes ThinkingSimplifying Complexity: How the Four-Field Matrix Reshapes Thinking
Simplifying Complexity: How the Four-Field Matrix Reshapes ThinkingCIToolkit
 
From Goals to Actions: Uncovering the Key Components of Improvement Roadmaps
From Goals to Actions: Uncovering the Key Components of Improvement RoadmapsFrom Goals to Actions: Uncovering the Key Components of Improvement Roadmaps
From Goals to Actions: Uncovering the Key Components of Improvement RoadmapsCIToolkit
 
Effective learning in the Age of Hybrid Work - Agile Saturday Tallinn 2024
Effective learning in the Age of Hybrid Work - Agile Saturday Tallinn 2024Effective learning in the Age of Hybrid Work - Agile Saturday Tallinn 2024
Effective learning in the Age of Hybrid Work - Agile Saturday Tallinn 2024Giuseppe De Simone
 
THE LEADERSHIP TO CHANGE THE WOLRD THIS IS YOUR HOUR PURSUES YOUR GIFT, TALEN...
THE LEADERSHIP TO CHANGE THE WOLRD THIS IS YOUR HOUR PURSUES YOUR GIFT, TALEN...THE LEADERSHIP TO CHANGE THE WOLRD THIS IS YOUR HOUR PURSUES YOUR GIFT, TALEN...
THE LEADERSHIP TO CHANGE THE WOLRD THIS IS YOUR HOUR PURSUES YOUR GIFT, TALEN...PROF. PAUL ALLIEU KAMARA
 
Shaping Organizational Culture Beyond Wishful Thinking
Shaping Organizational Culture Beyond Wishful ThinkingShaping Organizational Culture Beyond Wishful Thinking
Shaping Organizational Culture Beyond Wishful ThinkingGiuseppe De Simone
 
Unlocking Productivity and Personal Growth through the Importance-Urgency Matrix
Unlocking Productivity and Personal Growth through the Importance-Urgency MatrixUnlocking Productivity and Personal Growth through the Importance-Urgency Matrix
Unlocking Productivity and Personal Growth through the Importance-Urgency MatrixCIToolkit
 
Chapter 1 Performance Management HRM.ppt
Chapter 1 Performance Management HRM.pptChapter 1 Performance Management HRM.ppt
Chapter 1 Performance Management HRM.ppt2020102713
 

Recently uploaded (18)

From Red to Green: Enhancing Decision-Making with Traffic Light Assessment
From Red to Green: Enhancing Decision-Making with Traffic Light AssessmentFrom Red to Green: Enhancing Decision-Making with Traffic Light Assessment
From Red to Green: Enhancing Decision-Making with Traffic Light Assessment
 
原版1:1复刻密西西比大学毕业证Mississippi毕业证留信学历认证
原版1:1复刻密西西比大学毕业证Mississippi毕业证留信学历认证原版1:1复刻密西西比大学毕业证Mississippi毕业证留信学历认证
原版1:1复刻密西西比大学毕业证Mississippi毕业证留信学历认证
 
How-How Diagram: A Practical Approach to Problem Resolution
How-How Diagram: A Practical Approach to Problem ResolutionHow-How Diagram: A Practical Approach to Problem Resolution
How-How Diagram: A Practical Approach to Problem Resolution
 
Choosing the best strategy qspm matrix.pptx
Choosing the best strategy qspm matrix.pptxChoosing the best strategy qspm matrix.pptx
Choosing the best strategy qspm matrix.pptx
 
The Final Activity in Project Management
The Final Activity in Project ManagementThe Final Activity in Project Management
The Final Activity in Project Management
 
Paired Comparison Analysis: A Practical Tool for Evaluating Options and Prior...
Paired Comparison Analysis: A Practical Tool for Evaluating Options and Prior...Paired Comparison Analysis: A Practical Tool for Evaluating Options and Prior...
Paired Comparison Analysis: A Practical Tool for Evaluating Options and Prior...
 
Beyond the Five Whys: Exploring the Hierarchical Causes with the Why-Why Diagram
Beyond the Five Whys: Exploring the Hierarchical Causes with the Why-Why DiagramBeyond the Five Whys: Exploring the Hierarchical Causes with the Why-Why Diagram
Beyond the Five Whys: Exploring the Hierarchical Causes with the Why-Why Diagram
 
Farmer Representative Organization in Lucknow | Rashtriya Kisan Manch
Farmer Representative Organization in Lucknow | Rashtriya Kisan ManchFarmer Representative Organization in Lucknow | Rashtriya Kisan Manch
Farmer Representative Organization in Lucknow | Rashtriya Kisan Manch
 
Digital PR Summit - Leadership Lessons: Myths, Mistakes, & Toxic Traits
Digital PR Summit - Leadership Lessons: Myths, Mistakes, & Toxic TraitsDigital PR Summit - Leadership Lessons: Myths, Mistakes, & Toxic Traits
Digital PR Summit - Leadership Lessons: Myths, Mistakes, & Toxic Traits
 
Measuring True Process Yield using Robust Yield Metrics
Measuring True Process Yield using Robust Yield MetricsMeasuring True Process Yield using Robust Yield Metrics
Measuring True Process Yield using Robust Yield Metrics
 
Mind Mapping: A Visual Approach to Organize Ideas and Thoughts
Mind Mapping: A Visual Approach to Organize Ideas and ThoughtsMind Mapping: A Visual Approach to Organize Ideas and Thoughts
Mind Mapping: A Visual Approach to Organize Ideas and Thoughts
 
Simplifying Complexity: How the Four-Field Matrix Reshapes Thinking
Simplifying Complexity: How the Four-Field Matrix Reshapes ThinkingSimplifying Complexity: How the Four-Field Matrix Reshapes Thinking
Simplifying Complexity: How the Four-Field Matrix Reshapes Thinking
 
From Goals to Actions: Uncovering the Key Components of Improvement Roadmaps
From Goals to Actions: Uncovering the Key Components of Improvement RoadmapsFrom Goals to Actions: Uncovering the Key Components of Improvement Roadmaps
From Goals to Actions: Uncovering the Key Components of Improvement Roadmaps
 
Effective learning in the Age of Hybrid Work - Agile Saturday Tallinn 2024
Effective learning in the Age of Hybrid Work - Agile Saturday Tallinn 2024Effective learning in the Age of Hybrid Work - Agile Saturday Tallinn 2024
Effective learning in the Age of Hybrid Work - Agile Saturday Tallinn 2024
 
THE LEADERSHIP TO CHANGE THE WOLRD THIS IS YOUR HOUR PURSUES YOUR GIFT, TALEN...
THE LEADERSHIP TO CHANGE THE WOLRD THIS IS YOUR HOUR PURSUES YOUR GIFT, TALEN...THE LEADERSHIP TO CHANGE THE WOLRD THIS IS YOUR HOUR PURSUES YOUR GIFT, TALEN...
THE LEADERSHIP TO CHANGE THE WOLRD THIS IS YOUR HOUR PURSUES YOUR GIFT, TALEN...
 
Shaping Organizational Culture Beyond Wishful Thinking
Shaping Organizational Culture Beyond Wishful ThinkingShaping Organizational Culture Beyond Wishful Thinking
Shaping Organizational Culture Beyond Wishful Thinking
 
Unlocking Productivity and Personal Growth through the Importance-Urgency Matrix
Unlocking Productivity and Personal Growth through the Importance-Urgency MatrixUnlocking Productivity and Personal Growth through the Importance-Urgency Matrix
Unlocking Productivity and Personal Growth through the Importance-Urgency Matrix
 
Chapter 1 Performance Management HRM.ppt
Chapter 1 Performance Management HRM.pptChapter 1 Performance Management HRM.ppt
Chapter 1 Performance Management HRM.ppt
 

Measuring Enterprise GIS Performance For the King County GIS Center

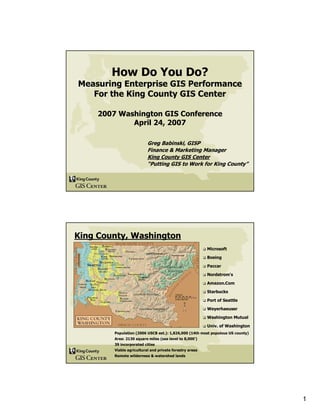
  • 1. 1 How Do You Do? Measuring Enterprise GIS Performance For the King County GIS Center 2007 Washington GIS Conference April 24, 2007 Greg Babinski, GISP Finance & Marketing Manager King County GIS Center “Putting GIS to Work for King County” King County, Washington Microsoft Boeing Paccar Nordstrom's Amazon.Com Starbucks Port of Seattle Weyerhaeuser Washington Mutual Univ. of Washington Population (2006 USCB est.): 1,826,000 (14th most populous US county) Area: 2130 square miles (sea level to 8,000’) 39 incorporated cities Viable agricultural and private forestry areas Remote wilderness & watershed lands
  • 2. 2 What Are Typical GIS-Related Performance Measures? www.metrokc.gov/gis GIS staff performance appraisals Technical system performance tests Data accuracy analysis Data currency standards/backlog status Project close-out reports/lessons-learned Input-oriented Others? Why Study Enterprise GIS Performance Measures? www.metrokc.gov/gis GIS is an integrated system – focus on integrated system performance Customers rely on the integrated system Objective validation of program success Program/project return on investment results Results oriented Performance measures can drive future direction Elected officials, State Auditors & Citizens expect accountability Others?
  • 3. 3 King County GIS The King County Geographic Information System (KCGIS) is a consolidated and coordinated regional geographic information resource, organized to meet the business needs of King County, local agencies, and the general public. KCGIS is comprised of both the King County GIS Center (an internal service fund, responsible for core GIS resources and enterprise GIS services for the entire County) and business specific activity in various GIS programs distributed across other County agencies. KCGIS is managed by the Director of DNRP, supported by a management level GIS Oversight Committee and an operational level GIS Technical Committee. www.metrokc.gov/gis How is GIS Used for King County Business? Mapping Public information delivery Growth management & planning Property assessment Land development permitting Site selection Simulating environmental conditions Emergency response planning Crime analysis Transportation planning Bus & van routing Road maintenance management Public health service delivery E911 operations Airport sound abatement Boundary management (legislative districts, voter precincts, tax unit boundaries, etc.) And the list goes on….. www.metrokc.gov/gis
  • 4. 4 King County GIS Internal Service Fund What is an internal service fund? Full financial and operational responsibility for providing designated services Agencies receiving services or benefit are required to budget for internal service fund costs Chartered to operate on an entrepreneurial basis – both within the county and externally www.metrokc.gov/gis Enterprise Operations: GIS Data Warehouse Management GIS Systems Administration Enterprise GIS Data Coordination Core GIS User Applications Matrixed GIS Staffing Services On-Demand GIS Client Services: GIS Consulting Application Development Training Mapping & Analysis KCGIS Center Business Lines
  • 5. 5 King County Policy Goals: Drive Agency Vision, Mission & Program Goals County Executive 2007 Budget Priorities: Services mandated by state law will be prioritized over services that are not mandated. Services provided on a regional basis will be prioritized over local services. Local services provided to unincorporated areas will be prioritized over local services in cities. Direct services to the public will be prioritized over administrative functions, except where the county has a legal obligation to maintain adequate financial and administrative oversight to assure appropriate monitoring and control over public funds. Fees will fully cover the cost of providing the services where possible. Contracts for services with cities or others will provide for full cost recovery. www.metrokc.gov/gis King County GIS Center Vision, Mission & Program Goals MISSION: To work in partnership with county agencies to provide accurate, consistent, accessible, affordable, and comprehensive GIS data, GIS infrastructure and GIS services to support the unique business needs of King County and the communities we serve. VISION: The King County GIS Center is the premier regional provider of spatial information & GIS services. PROGRAM GOALS: Increase efficiencies & effectiveness of spatial data & GIS applications. Provide a valued regional resource of spatial information & GIS expertise. Increase ability of county agencies to meet their business needs. Increase ability of citizens to access useful information about King County. www.metrokc.gov/gis
  • 6. 6 Program Goals Drive Core Business Operations: Increase efficiencies and effectiveness of spatial data and GIS applications: GIS Enterprise Operations Provide a valued regional resource of spatial information and GIS expertise: GIS Enterprise Operations GIS Client Services Increase ability of county agencies to meet their business needs: GIS Matrix Staff Services GIS Client Services Increase ability of citizens to access useful information about King County: GIS Enterprise Operations www.metrokc.gov/gis Program Goals Drive Performance Measures Performance Goal - Core Business – Performance Measure Increase efficiencies and effectiveness of spatial data and GIS applications: GIS Enterprise Operations: Performance Measure: Percent of data issues resolved through efforts of data coordination program 2006 Target: 90% 2007 Target: 90% Performance Data: 2003: N/A 2004: 89% 2005: 98% Context: There were 280 data issues logged by the KCGIS Center data coordinator in 2005. Of these 275 (98%) were satisfactorily resolved. www.metrokc.gov/gis Program Goals Drive Performance Measures
  • 7. 7 Performance Goal - Core Business – Performance Measure Provide a valued regional resource of spatial information and GIS expertise: GIS Enterprise Operations: Performance Measure: Percent change in user sessions for Web mapping services over previous year 2006 Target: 10% 2007 Target: 10% Performance Data: 2003: 75% 2004: 46% 2005: 28% Context: There were 1,582,199 user sessions in 2004 and 2,028,013 user sessions in 2005 for an increase of 445,814 (28%). www.metrokc.gov/gis Program Goals Drive Performance Measures Performance Goal - Core Business – Performance Measure Provide a valued regional resource of spatial information and GIS expertise: GIS Client Services: Performance Measure: Percent of contacts at local jurisdictions that view the KCGIS Center as a valued resource for spatial data and services 2006 Target: 75% 2007 Target: 75% Performance Data: 2003: NA 2004: 62% 2005: 75% Context: Based on survey of contacts at King County cities and tribes conducted in 2005 & 2006. www.metrokc.gov/gis Program Goals Drive Performance Measures
  • 8. 8 Performance Goal - Core Business – Performance Measure Increase the Ability of County Agencies to Meet Their Business Needs GIS Matrix Staff Services: Percent of GIS Oversight Committee and GIS Technical Committee members rating KCGIS Center services as satisfactory or better 2006 Target: 90% 2007 Target: 90% Performance Data: 2003: NA 2005: 100% 2006: 100% Context: Based on survey of members of Technical and Oversight committees conducted in 2005 & 2006. www.metrokc.gov/gis Program Goals Drive Performance Measures Performance Goal - Core Business – Performance Measure Increase the Ability of County Agencies to Meet Their Business Needs GIS Client Services: Performance Measure: Percent increase in client services customers over previous year 2006 Target: 10% 2007 Target: 10% Performance Data: 2003: 19% 2004: 70% 2005: 6% Context: Client Services had 107 unique customers in 2004 and 113 unique customers in 2005, an increase of 6% www.metrokc.gov/gis Program Goals Drive Performance Measures
  • 9. 9 Performance Goal - Core Business – Performance Measure Increase the Ability of County Agencies to Meet Their Business Needs GIS Client Services: Performance Measure: Percent retention rate of client services customers from previous year 2006 Target: 40% 2007 Target: 40% Performance Data: 2003: 42% 2004: 71% 2005: 33% Context: 35 of 107 Client Services customers from 2004 returned for business in 2005 for a retention rate of 33% www.metrokc.gov/gis Program Goals Drive Performance Measures Performance Goal - Core Business – Performance Measure Increase ability of citizens to access useful information about King County: GIS Enterprise Operations: Performance Measure: Percent of users rating ease of use of KCGIS Web mapping services as easy to very easy. 2006 Target: 80% 2007 Target: 80% Performance Data: 2003: NA 2004: 83% 2005: NA Context: An online user satisfaction survey was conducted in June 2006. Beginning in 2006 surveys will be conducted annually. www.metrokc.gov/gis Program Goals Drive Performance Measures
  • 10. 10 Performance Goal - Core Business – Performance Measure Increase ability of citizens to access useful information about King County: GIS Enterprise Operations: Performance Measure: Percent of availability of KCGIS Web mapping services during normal business hours 2006 Target: 98% 2007 Target: 98% Performance Data: 2003: 99% 2004: 96% 2005: 99.5% Context: Web mapping services were available for 2,070 of 2,080 business hours in 2005 (99.5%). Total up time in 2005 was 8,748 hours of 8,760 (99.9%). www.metrokc.gov/gis Program Goals Drive Performance Measures King County GIS Center Performance Measurements www.metrokc.gov/gis Benefits and Results Validates program viability Customer focussed results Program-wide snapshot Results (output focus) vs input focus Useful management tool Trace program issues to source Identify resource allocation issues & opportunities Useful CRM/marketing tool Identifies customer service issues Establishes credibility/quality Useful budgeting tool Feedback loop into budget process Identifies needs and develops support for new programs
  • 11. 11 Conclusions & Questions www.metrokc.gov/gis Value of GIS Program Performance Measures: GIS Program Management Tool Customer Relationship Development Tool Can Support Effective Budget Development Can Help Meet Auditor & Taxpayer Expectations Questions? Greg Babinski, GISP Finance & Marketing Manager King County GIS Center 201 South Jackson Street Seattle, WA 98104 Greg.babinski@metrokc.gov