coca cola Reconciliation of Q3 and YTD 2008 Non-GAAP financial measures
1. Page 1 of 4
The Company reports its financial results in accordance with U.S. generally accepted accounting principles (GAAP). However, management believes that certain non-GAAP
financial measures used in managing the business may provide users of this financial information additional meaningful comparisons between current results and results in
prior operating periods. Management believes that these non-GAAP financial measures can provide additional meaningful reflection of underlying trends of the business
because they provide a comparison of historical information that excludes certain items that impact the overall comparability. Management also uses these non-GAAP
financial measures in making financial, operating and planning decisions and in evaluating the Company's performance. See the Tables below for supplemental financial
data and corresponding reconciliations to GAAP financial measures for the three months ended September 26, 2008 and September 28, 2007. Non-GAAP financial
measures should be viewed in addition to, and not as an alternative for, the Company’s reported results prepared in accordance with GAAP.
THE COCA-COLA COMPANY AND SUBSIDIARIES
Reconciliation of GAAP and Non-GAAP Financial Measures
(UNAUDITED)
(In millions except per share data)
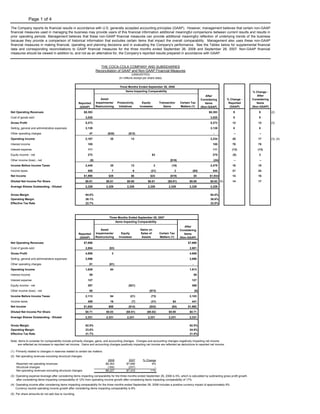
Three Months Ended September 26, 2008
Items Impacting Comparability % Change -
After
After
Asset % Change - Considering
Considering
Impairments/ Productivity Equity Transaction Certain Tax Reported Items
Reported Items
Restructuring Initiatives Investees Gains Matters (1) (GAAP) (Non-GAAP)
(GAAP) (Non-GAAP)
Net Operating Revenues $8,393 $8,393 9 9 (2)
Cost of goods sold 3,020 3,020 5 5
Gross Profit 5,373 5,373 12 12 (3)
Selling, general and administrative expenses 3,139 3,139 8 8
Other operating charges 47 ($35) ($12) - -- --
Operating Income 2,187 35 12 2,234 20 17 (3), (4)
Interest income 105 105 78 78
Interest expense 111 111 (13) (13)
Equity income - net 272 $3 275 (5) 3
Other income (loss) - net (8) ($16) (24) -- --
Income Before Income Taxes 2,445 35 12 3 (16) 2,479 16 18
Income taxes 555 7 6 (21) 3 ($5) 545 21 24
Net Income $1,890 $28 $6 $24 ($19) $5 $1,934 14 16
Diluted Net Income Per Share $0.81 $0.01 $0.00 $0.01 ($0.01) $0.00 $0.83 (5) 14 17
Average Shares Outstanding - Diluted 2,329 2,329 2,329 2,329 2,329 2,329 2,329
Gross Margin 64.0% 64.0%
Operating Margin 26.1% 26.6%
Effective Tax Rate 22.7% 22.0%
Three Months Ended September 28, 2007
Items Impacting Comparability
After
Asset Gains on Considering
Impairments/ Equity Sales of Certain Tax
Reported Items
Restructuring Investees Assets Matters (1)
(GAAP) (Non-GAAP)
Net Operating Revenues $7,690 $7,690
Cost of goods sold 2,884 ($3) 2,881
Gross Profit 4,806 3 4,809
Selling, general and administrative expenses 2,896 2,896
Other operating charges 81 (81) -
Operating Income 1,829 84 1,913
Interest income 59 59
Interest expense 127 127
Equity income - net 287 ($21) 266
Other income (loss) - net 65 ($73) (8)
Income Before Income Taxes 2,113 84 (21) (73) 2,103
Income taxes 459 16 (7) (31) $4 441
Net Income $1,654 $68 ($14) ($42) ($4) $1,662
Diluted Net Income Per Share $0.71 $0.03 ($0.01) ($0.02) $0.00 $0.71
Average Shares Outstanding - Diluted 2,331 2,331 2,331 2,331 2,331 2,331
Gross Margin 62.5% 62.5%
Operating Margin 23.8% 24.9%
Effective Tax Rate 21.7% 21.0%
Note: Items to consider for comparability include primarily charges, gains, and accounting changes. Charges and accounting changes negatively impacting net income
are reflected as increases to reported net income. Gains and accounting changes positively impacting net income are reflected as deductions to reported net income.
(1) Primarily related to changes in reserves related to certain tax matters.
(2) Net operating revenues excluding structural changes:
2008 2007 % Change
Reported net operating revenues $8,393 $7,690 9%
Structural changes (166) (257) --
Net operating revenues excluding structural changes $8,227 $7,433 11%
(3) Operating expense leverage after considering items impacting comparability for the three months ended September 26, 2008 is 5%, which is calculated by subtracting gross profit growth
after considering items impacting comparability of 12% from operating income growth after considering items impacting comparability of 17%.
(4) Operating income after considering items impacting comparability for the three months ended September 26, 2008 includes a positive currency impact of approximately 9%.
Currency neutral operating income growth after considering items impacting comparability is 8%.
(5) Per share amounts do not add due to rounding.
2. Page 2 of 4
The Company reports its financial results in accordance with U.S. generally accepted accounting principles (GAAP). However, management believes that certain non-
GAAP financial measures used in managing the business may provide users of this financial information additional meaningful comparisons between current results and
results in prior operating periods. Management believes that these non-GAAP financial measures can provide additional meaningful reflection of underlying trends of the
business because they provide a comparison of historical information that excludes certain items that impact the overall comparability. Management also uses these non-
GAAP financial measures in making financial, operating and planning decisions and in evaluating the Company's performance. See the Tables below for supplemental
financial data and corresponding reconciliations to GAAP financial measures for the nine months ended September 26, 2008 and September 28, 2007. Non-GAAP
financial measures should be viewed in addition to, and not as an alternative for, the Company’s reported results prepared in accordance with GAAP.
THE COCA-COLA COMPANY AND SUBSIDIARIES
Reconciliation of GAAP and Non-GAAP Financial Measures
(UNAUDITED)
(In millions except per share data)
Nine Months Ended September 26, 2008
Items Impacting Comparability % Change -
After
After
Asset % Change - Considering
Considering
Impairments/ Productivity Equity Transaction Certain Tax Reported Items
Reported Items
Restructuring Initiatives Investees Gains Matters (1) (GAAP) (Non-GAAP)
(GAAP) (Non-GAAP)
Net Operating Revenues $24,818 $24,818 15 15 (2)
Cost of goods sold 8,806 8,806 13 14
Gross Profit 16,012 16,012 16 16 (3)
Selling, general and administrative expenses 9,030 9,030 14 14
Other operating charges 242 ($218) ($24) - -- --
Operating Income 6,740 218 24 6,982 18 19 (3), (4)
Interest income 239 239 59 59
Interest expense 317 317 6 6
Equity income - net (434) $1,130 696 -- 9
Other income (loss) - net 61 ($118) (57) -- --
Income Before Income Taxes 6,289 218 24 1,130 (118) 7,543 1 19
Income taxes 1,477 43 9 195 (29) ($36) 1,659 0 19
Net Income $4,812 $175 $15 $935 ($89) $36 $5,884 1 19
Diluted Net Income Per Share $2.06 $0.07 $0.01 $0.40 ($0.04) $0.02 $2.51 (5) 0 18
Average Shares Outstanding - Diluted 2,341 2,341 2,341 2,341 2,341 2,341 2,341
Gross Margin 64.5% 64.5%
Operating Margin 27.2% 28.1%
Effective Tax Rate 23.5% 22.0%
Nine Months Ended September 28, 2007
Items Impacting Comparability
After
Asset Gains on Considering
Impairments/ Equity Sales of Certain Tax
Reported Items
Restructuring Investees Assets Matters (1)
(GAAP) (Non-GAAP)
Net Operating Revenues $21,526 $21,526
Cost of goods sold 7,765 ($13) 7,752
Gross Profit 13,761 13 13,774
Selling, general and administrative expenses 7,906 7,906
Other operating charges 129 (129) -
Operating Income 5,726 142 5,868
Interest income 150 150
Interest expense 300 300
Equity income - net 497 $141 638
Other income (loss) - net 177 ($209) (32)
Income Before Income Taxes 6,250 142 141 (209) 6,324
Income taxes 1,483 30 19 (104) ($37) 1,391
Net Income $4,767 $112 $122 ($105) $37 $4,933
Diluted Net Income Per Share $2.05 $0.05 $0.05 ($0.05) $0.02 $2.12
Average Shares Outstanding - Diluted 2,326 2,326 2,326 2,326 2,326 2,326
Gross Margin 63.9% 64.0%
Operating Margin 26.6% 27.3%
Effective Tax Rate 23.7% 22.0%
Note: Items to consider for comparability include primarily charges, gains, and accounting changes. Charges and accounting changes negatively impacting net income
are reflected as increases to reported net income. Gains and accounting changes positively impacting net income are reflected as deductions to reported net income.
(1) Primarily related to changes in reserves related to certain tax matters.
(2) Net operating revenues excluding structural changes:
2008 2007 % Change
Reported net operating revenues $24,818 $21,526 15%
Structural changes (912) (554) --
Net operating revenues excluding structural changes $23,906 $20,972 14%
(3) Operating expense leverage after considering items impacting comparability for the nine months ended September 26, 2008 is 3%, which is calculated by subtracting gross profit growth
after considering items impacting comparability of 16% from operating income growth after considering items impacting comparability of 19%.
(4) Operating income after considering items impacting comparability for the nine months ended September 26, 2008 includes a positive currency impact of approximately 10%.
Currency neutral operating income growth after considering items impacting comparability is 9%.
(5) Per share amounts do not add due to rounding.
3. Page 3 of 4
The Company reports its financial results in accordance with U. S. generally accepted accounting principles (GAAP). However, management believes that certain non-GAAP financial
measures used in managing the business may provide users of this financial information additional meaningful comparisons between current results and results in prior operating periods.
Management believes that these non-GAAP financial measures can provide additional meaningful reflection of underlying trends of the business because they provide a comparison of
historical information that excludes certain items that impact the overall comparability. Management also uses these non-GAAP financial measures in making financial, operating and
planning decisions and in evaluating the Company's performance. See the Table below for supplemental financial data and corresponding reconciliations to GAAP financial measures for
the three months ended September 26, 2008 and September 28, 2007. Non-GAAP financial measures should be viewed in addition to, and not as an alternative for, the Company’s
reported results prepared in accordance with GAAP.
THE COCA-COLA COMPANY AND SUBSIDIARIES
Reconciliation of GAAP and Non-GAAP Financial Measures
Operating Income (Loss) by Segment
(UNAUDITED)
(In millions)
Three Months Ended September 26, 2008 Three Months Ended September 28, 2007
Items
Impacting
Comparability
Items Impacting Comparability
% Favorable
(Unfavorable) -
% Favorable After
After After
(Unfavorable) - Considering
Considering Considering
Asset Asset
Reported
Impairments/ Productivity Impairments/ Items
Reported Items Reported Items
(GAAP)
Restructuring Initiatives Restructuring (Non-GAAP)
(GAAP) (Non-GAAP) (GAAP) (Non-GAAP)
Eurasia & Africa $180 $180 $134 $15 $149 34 21
Europe 796 796 698 7 705 14 13
Latin America 559 $1 560 430 1 431 30 30
North America 392 6 398 447 13 460 (12) (13)
Pacific 491 491 428 428 15 15
Bottling Investments 66 12 78 58 14 72 14 8
Corporate (297) 16 $12 (269) (366) 34 (332) 19 19
Consolidated $2,187 $35 $12 $2,234 $1,829 $84 $1,913 20 17
4. Page 4 of 4
The Company reports its financial results in accordance with U. S. generally accepted accounting principles (GAAP). However, management believes that certain non-GAAP financial
measures used in managing the business may provide users of this financial information additional meaningful comparisons between current results and results in prior operating periods.
Management believes that these non-GAAP financial measures can provide additional meaningful reflection of underlying trends of the business because they provide a comparison of
historical information that excludes certain items that impact the overall comparability. Management also uses these non-GAAP financial measures in making financial, operating and
planning decisions and in evaluating the Company's performance. See the Table below for supplemental financial data and corresponding reconciliations to GAAP financial measures for
the nine months ended September 26, 2008 and September 28, 2007. Non-GAAP financial measures should be viewed in addition to, and not as an alternative for, the Company’s
reported results prepared in accordance with GAAP.
THE COCA-COLA COMPANY AND SUBSIDIARIES
Reconciliation of GAAP and Non-GAAP Financial Measures
Operating Income (Loss) by Segment
(UNAUDITED)
(In millions)
Nine Months Ended September 26, 2008 Nine Months Ended September 28, 2007
Items
Impacting
Comparability
Items Impacting Comparability
% Favorable
(Unfavorable) -
% Favorable After
After After
(Unfavorable) - Considering
Considering Considering
Asset Asset
Reported
Impairments/ Productivity Impairments/ Items
Reported Items Reported Items
(GAAP)
Restructuring Initiatives Restructuring (Non-GAAP)
(GAAP) (Non-GAAP) (GAAP) (Non-GAAP)
Eurasia & Africa $676 $676 $479 $35 $514 41 32
Europe 2,547 2,547 2,226 12 2,238 14 14
Latin America 1,596 $1 1,597 1,258 3 1,261 27 27
North America 1,173 12 1,185 1,294 13 1,307 (9) (9)
Pacific 1,483 1,483 1,306 1 1,307 14 13
Bottling Investments 239 25 264 131 43 174 82 52
Corporate (974) 180 $24 (770) (968) 35 (933) (1) 17
Consolidated $6,740 $218 $24 6,982 $5,726 $142 $5,868 18 19