Economic Risk Factor Update: April 2024 [SlideShare]
CloroxAR08_FinancialStatements
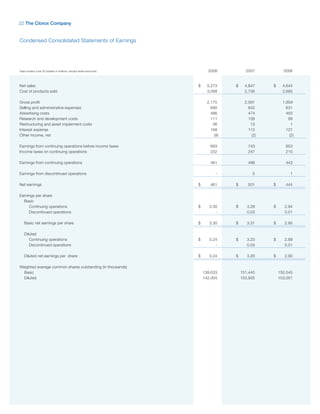
1. 22 The Clorox Company
Condensed Consolidated Statements of Earnings
2008 2007 2006
Years ended June 30 (dollars in millions, except share amounts)
Net sales $ 5,273 $ 4,847 $ 4,644
Cost of products sold 3,098 2,756 2,685
Gross profit 2,175 2,091 1,959
Selling and administrative expenses 690 642 631
Advertising costs 486 474 450
Research and development costs 111 108 99
Restructuring and asset impairment costs 36 13 1
Interest expense 168 113 127
Other income, net (9) (2) (2)
Earnings from continuing operations before income taxes 693 743 653
Income taxes on continuing operations 232 247 210
Earnings from continuing operations 461 496 443
Earnings from discontinued operations - 5 1
Net earnings $ 461 $ 501 $ 444
Earnings per share
Basic
Continuing operations $ 3.30 $ 3.28 $ 2.94
Discontinued operations - 0.03 0.01
Basic net earnings per share $ 3.30 $ 3.31 $ 2.95
Diluted
Continuing operations $ 3.24 $ 3.23 $ 2.89
Discontinued operations - 0.03 0.01
Diluted net earnings per share $ 3.24 $ 3.26 $ 2.90
Weighted average common shares outstanding (in thousands)
Basic 139,633 151,445 150,545
Diluted 142,004 153,935 153,001
2. The Clorox Company 23
Condensed Consolidated Balance Sheets
2008 2007
As of June 30 (dollars in millions, except share amounts)
Assets
Current assets
Cash and cash equivalents $ 214 $ 182
Receivables, net 505 460
Inventories 384 309
Other current assets 146 81
Total current assets 1,249 1,032
Property, plant and equipment, net 960 976
Goodwill 1,658 1,025
Trademarks, net 560 254
Other intangible assets, net 123 94
Other assets 158 200
Total assets $ 4,708 $ 3,581
Liabilities and Stockholders’ (Deficit) Equity
Current liabilities
Notes and loans payable $ 755 $ 74
Current maturities of long-term debt - 500
Accounts payable 418 329
Accrued liabilities 440 507
Income taxes payable 48 17
Total current liabilities 1,661 1,427
Long-term debt 2,720 1,462
Other liabilities 600 516
Deferred income taxes 97 5
Total liabilities 5,078 3,410
Commitments and contingencies
Stockholders’ (deficit) equity
Common stock: $1.00 par value; 750,000,000 shares authorized; 158,741,461 shares issued at June 30, 2008
and 2007; and 138,038,052 and 151,256,460 shares outstanding at June 30, 2008 and 2007, respectively 159 159
Additional paid-in capital 534 481
Retained earnings 386 185
Treasury shares, at cost: 20,703,409 and 7,485,001 shares at June 30, 2008 and 2007, respectively (1,270 ) (445)
Accumulated other comprehensive net losses (179 ) (209)
Stockholders’ (deficit) equity (370) 171
Total liabilities and stockholders’ (deficit) equity $ 4,708 $ 3,581
3. 24 The Clorox Company
Condensed Consolidated Statements of Stockholders’ (Deficit) Equity
Accumulated
Other
Additional Comprehensive Total
Common Stock Treasury Shares
Paid-in Retained Net (Losses) Unearned Comprehensive
Dollars in millions, except share amounts Shares (000) Amount Capital Earnings Shares (000) Amount Gains Compensation Income Income
249,827 $ 250 $ 328 $ 3,684 (98,144) $ (4,463) $ (336) $ (16) $ (553)
Balance at June 30, 2005
Comprehensive income
Net earnings 444 444 $ 444
Translation adjustments,
net of tax of $(0) 2 2 2
Change in valuation of derivatives,
net of tax of $(1) 1 1 1
Minimum pension liability
adjustments, net of tax of $71 118 118 118
Total comprehensive income $ 565
Dividends (174) (174)
Employee stock plans 85 (15) 2,015 71 141
Reclassification upon adoption of Statement
of Financial Accounting Standards (SFAS)
No. 123-R (16) 16 -
Treasury stock purchased (2,400) (135) (135)
249,827 250 397 3,939 (98,529) (4,527) (215) - (156)
Balance at June 30, 2006
Comprehensive income
Net earnings 501 501 $ 501
Translation adjustments,
net of tax of $3 47 47 47
Change in valuation of derivatives,
net of tax of $1 (3) (3) (3)
Minimum pension liability adjustments,
net of tax of $0 1 1 1
Total comprehensive income $ 546
Adjustment to initially apply SFAS No. 158,
net of tax of $(23) (39) (39)
Dividends (200) (200)
Employee stock plans 84 (9) 2,358 100 175
Treasury stock purchased (2,400) (155) (155)
Treasury stock retirement (91,086) (91) (4,046) 91,086 4,137 -
158,741 159 481 185 (7,485) (445) (209) - 171
Balance at June 30, 2007
Comprehensive income
Net earnings 461 461 $ 461
Translation adjustments,
net of tax of $(2) 26 26 26
Change in valuation of derivatives,
net of tax of $17 27 27 27
Unrecognized actuarial losses and prior
service benefit, net of tax of $(15) (23) (23) (23)
Total comprehensive income $ 491
Cumulative effect of adopting
Interpretation No. 48 (10) (10)
Dividends (231) (231)
Employee stock plans 53 (19) 862 48 82
Treasury stock purchased (14,080) (868) (868)
Other (5) (5)
158,741 $ 159 $ 534 $ 386 (20,703) $ (1,270) $ (179) $- $ (370)
Balance at June 30, 2008
4. The Clorox Company 25
Condensed Consolidated Statements of Cash Flows
2008 2007 2006
Years ended June 30 (dollars in millions)
Operating activities:
Net earnings $ 461 $ 501 $ 444
Deduct: Earnings from discontinued operations - 5 1
Earnings from continuing operations 461 496 443
Adjustments to reconcile earnings from continuing operations
to net cash provided by continuing operations:
Depreciation and amortization 205 192 188
Share-based compensation 47 49 77
Deferred income taxes (42) (15) (28)
Restructuring and asset impairment activities 29 4 -
Other 23 26 44
Cash effects of changes in:
Receivables, net (8) (15) (29)
Inventories, net (26) (8) 26
Other current assets 11 13 (11)
Accounts payable and accrued liabilities 63 (30) (50)
Income taxes payable (33) 7 (136)
Pension contributions to qualified plans - (10) (10)
Net cash provided by continuing operations 730 709 514
Net cash provided by discontinued operations - - 8
Net cash provided by operations 730 709 522
Investing activities:
Capital expenditures (170) (147) (180)
Businesses acquired (913) (123) (16)
Other 1 2 35 `
Net cash used for investing activities (1,082) (268) (161)
Financing activities:
Notes and loans payable, net 681 (87) (204)
Long-term debt borrowings 1,256 - -
Long-term debt repayments (500) (150) (29)
Treasury stock purchased (868) (155) (135)
Cash dividends paid (228) (183) (173)
Proceeds from exercise of stock options and other 39 119 79
Net cash provided by (used for) financing activities 380 (456) (462)
Effect of exchange rate changes on cash and cash equivalents 4 5 -
Net increase (decrease) in cash and cash equivalents 32 (10) (101)
Cash and cash equivalents:
Beginning of year 182 192 293
End of year $ 214 $ 182 $ 192
Supplemental cash flow information:
Cash paid for:
Interest $ 153 $ 117 $ 132
Income taxes, net of refunds 299 272 373
Non-cash financing activities:
Dividends declared and accrued but not paid 64 61 43
5. 28 The Clorox Company
Return on Invested Capital (Unaudited) (1)
Reconciliation of earnings from continuing operations before income taxes to return on invested capital (ROIC)
FY08 FY07 FY06 FY05 FY04
Dollars in millions and all calculations on a rounded basis
$693 $743 $653 $729 $752
Earnings from continuing operations before income taxes
Restructuring and asset impairment costs (2) 36 13 1 36 11
Interest expense (3) 168 113 127 79 30
Earnings from continuing operations before income taxes,
restructuring and asset impairment costs, and interest expense $897 $869 $781 $844 $793
Adjusted after tax profit (4) $596 $580 $530 $596 $517
Adjusted average invested capital (5) $2,805 $2,189 $2,095 $2,204 $2,306
Return on invested capital (6) 21.2% 26.5% 25.3% 27.0% 22.4%
(1) In accordance with SEC’s Regulation G, this schedule provides the definition of a non-GAAP measure and the reconciliation to the most closely related GAAP measure.
Management believes the presentation of return on invested capital (ROIC) provides additional information to investors about current trends in the business. ROIC is a
measure of how effectively the company allocates capital. Beginning with fiscal year 2008, the company adopted a simplified ROIC calculation (see definition below).
(2) Restructuring and asset impairment costs are added back to earnings and average invested capital to more closely reflect operating results.
(3) Interest expense is added back to earnings because it is factored in debt, a component of average invested capital (as defined below).
(4) Adjusted after tax profit represents earnings from continuing operations before income taxes, restructuring and asset impairment costs, and interest expense; after tax.
The tax rate applied is the effective tax rate on continuing operations, which was 33.6%, 33.2%, 32.1%, 29.4% and 34.8% in fiscal years 2008, 2007, 2006, 2005 and
2004, respectively.
(5) Average invested capital represents a five quarter average of debt and equity. Adjusted average invested capital represents average invested capital adjusted to add back a five
quarter average of cumulative, current-year after-tax restructuring and asset impairment costs. See below for details of the adjusted average invested capital calculation:
FY08 FY07 FY06 FY05 FY04
Amounts shown below are five quarter averages
Debt $3,161 $2,181 $2,533 $1,820 $1,019
Equity (372) 4 (439) 366 1,286
2,789 2,185 2,094 2,186 2,305
Average invested capital
Cumulative after-tax restructuring and asset impairment costs 16 4 1 18 1
$2,805 $2,189 $2,095 $2,204 $2,306
Adjusted average invested capital
(6) ROIC is calculated as earnings from continuing operations before income taxes, excluding restructuring and asset impairment costs and interest expense, computed on an
after-tax basis as a percentage of adjusted average invested capital (as defined above).