1. TRIBUNE COMPANY
THIRD QUARTER RESULTS OF OPERATIONS (Unaudited)
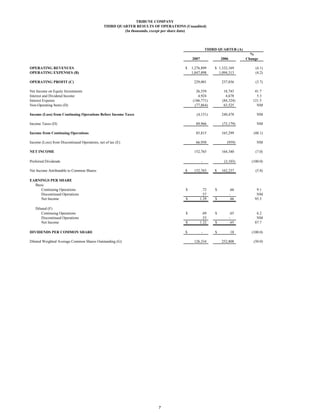
(In thousands, except per share data)
THIRD QUARTER (A)
%
2007 2006 Change
OPERATING REVENUES $ 1,276,899 $ 1,332,169 (4.1)
OPERATING EXPENSES (B) 1,047,898 1,094,313 (4.2)
OPERATING PROFIT (C) 229,001 237,856 (3.7)
Net Income on Equity Investments 26,559 18,743 41.7
Interest and Dividend Income 4,924 4,678 5.3
Interest Expense (186,771) (84,324) 121.5
Non-Operating Items (D) (77,864) 63,525 NM
Income (Loss) from Continuing Operations Before Income Taxes (4,151) 240,478 NM
Income Taxes (D) 89,966 (75,179) NM
Income from Continuing Operations 85,815 165,299 (48.1)
Income (Loss) from Discontinued Operations, net of tax (E) 66,950 (959) NM
NET INCOME 152,765 164,340 (7.0)
Preferred Dividends - (2,103) (100.0)
Net Income Attributable to Common Shares $ 152,765 $ 162,237 (5.8)
EARNINGS PER SHARE
Basic
Continuing Operations $ .72 $ .66 9.1
Discontinued Operations .57 - NM
Net Income $ 1.29 $ .66 95.5
Diluted (F)
Continuing Operations $ .69 $ .65 6.2
Discontinued Operations .53 - NM
Net Income $ 1.22 $ .65 87.7
DIVIDENDS PER COMMON SHARE $ - $ .18 (100.0)
Diluted Weighted Average Common Shares Outstanding (G) 126,334 252,808 (50.0)
7
2. (A) 2007 third quarter: July 2, 2007 to Sept. 30, 2007. (13 weeks)
2006 third quarter: June 26, 2006 to Sept. 24, 2006. (13 weeks)
(B) Operating expenses for the third quarter of 2007 included a severance charge of $3.2 million, or $.02 per diluted share, primarily at publishing.
Operating expenses for the third quarter of 2006 included a severance charge of $2.2 million and a $.7 million property gain at publishing.
These items netted to less than $.01 per diluted share.
(C) Operating profit excludes interest and dividend income, interest expense, equity income and losses, non-operating items
and income taxes.
(D) The third quarter of 2007 included the following non-operating items:
Pretax After-tax
Gain (Loss) Gain (Loss) Diluted EPS
Loss on derivatives and related investments (1) $ (84,969) $ (51,831) $ (.41)
Strategic transaction expenses (2) (3,160) (3,160) (.03)
Gain on TMCT transactions (3) 8,329 5,081 .04
Other, net 1,936 1,180 .01
Income tax adjustment (4) - 90,704 .72
Total non-operating items $ (77,864) $ 41,974 $ .33
The third quarter of 2006 included the following non-operating items:
Pretax After-tax
Gain (Loss) Gain (Loss) Diluted EPS
Loss on derivatives and related investments (1) $ (17,746) $ (10,825) $ (.04)
Gain on TMCT transactions (3) 59,596 47,988 .19
Gain on sales of investments, net (5) 17,507 10,679 .04
Other, net 4,168 4,618 .02
Income tax adjustment (6) - 3,820 .02
Total non-operating items $ 63,525 $ 56,280 $ .22
(1) Loss on derivatives and related investments represents primarily the net change in fair values of the derivative component of the Company's PHONES
and the related Time Warner shares.
(2) Includes expenses related to the leveraged ESOP and going-private transactions approved by the Company's board of directors on April 1, 2007.
(3) The 2007 gain related to the redemption of the Company's remaining interest in TMCT, LLC and TMCT II, LLC in September 2007. The 2006 gain
related to the restructuring of TMCT, LLC and TMCT II, LLC in September 2006.
(4) On Oct. 1, 2007, the Company announced that it had finalized the settlement of its appeal of the 2005 Tax Court decision disallowing the
tax-free reorganizations of Matthew Bender and Mosby, former subsidiaries of Times Mirror. As a result of the settlement, the Company received
refunds of federal income taxes and interest of $4 million on Sept. 26, 2007 and $340 million on Oct. 1, 2007. After consideration of income taxes
on the interest received, the net cash proceeds totaled approximately $286 million. These refunds, together with related state income tax benefits
of $29 million, were accounted for as a $91 million reduction in third quarter income tax expense and a $224 million reduction in goodwill recorded
on the Company's balance sheet.
(5) The 2006 gain on sales of investments consisted primarily of the gain on sale of 2.8 million shares of Time Warner stock unrelated to the PHONES.
(6) In the third quarter of 2006, the Company reduced its income tax expense and liabilities by $4 million as a result of favorably resolving certain
state and income tax issues.
(E) During the third quarter of 2007, the Company entered into negotiations to sell the stock of one of its subsidiaries, EZ Buy and EZ Sell Recycler
Corporation (quot;Recyclerquot;). Recycler publishes a collection of free classified newspapers in Southern California. The sale of Recycler closed on
Oct. 17, 2007. In February 2007, the Company announced an agreement to sell the New York edition of Hoy , the Company's Spanish-language daily
newspaper (quot;Hoy, New Yorkquot;). In March 2007, the Company announced its intentions to sell its Southern Connecticut Newspapers—The Advocate
(Stamford) and Greenwich Time (collectively quot;SCNIquot;). The sale of Hoy, New York closed in May 2007. In June 2006, the Company announced
agreements to sell its Atlanta and Albany television stations. The sale of Atlanta closed in August 2006. In September 2006, the Company
announced an agreement to sell its Boston television station. The sales of Albany and Boston closed in December 2006. Operating results for these
business units are reported as discontinued operations. Income (loss) from discontinued operations in the third quarter included the following:
Third Quarter
2007 2006
Income (loss) from operations, net of tax $ 138 $ (1,445)
Gain on sales of discontinued operations, net of tax (1) 66,812 486
Total $ 66,950 $ (959)
(1) In the third quarter of 2007, the Company recorded a $1 million pretax loss on the sale of Recycler. Due to the Company's high tax basis
in the stock of Recycler, the sale will generate a significantly higher capital loss for income tax purposes. As a result, the Company recorded
a $65 million tax benefit in the third quarter of 2007, resulting in an after-tax gain of $64 million. In addition, the Company recorded a
favorable $3 million after-tax adjustment to the expected loss on the sale of SCNI in the third quarter of 2007. In the third quarter of 2006, the
Company recorded an adjustment to the loss on the sale of Atlanta.
8
3. (F) For the third quarters of 2007 and 2006, weighted average common shares outstanding used in the calculations of diluted earnings per share (quot;EPSquot;)
were adjusted for the dilutive effect of stock-based compensation awards. The third quarter 2007 diluted EPS calculation also assumed the conversion
of the Company's $200 million exchangeable promissory note into 5.9 million common shares. In addition, the third quarter 2006 diluted EPS
calculation assumed that the Company's Series C, D-1, and D-2 preferred shares were converted into 3.3 million common shares. All of the Series C,
D-1 and D-2 preferred shares were issued to and held by TMCT, LLC and TMCT II, LLC. In connection with a restructuring of these limited liability
companies, all of these preferred shares were distributed to the Company on Sept. 22, 2006 and are no longer outstanding. Following are the
calculations for the third quarter:
Third Quarter
2007 2006
Income from continuing operations $ 85,815 $ 165,299
Income (loss) from discontinued operations, net of tax 66,950 (959)
Net income 152,765 164,340
Add back: exchangeable promissory note interest expense, net of tax 1,463 -
Adjusted net income $ 154,228 $ 164,340
Weighted average common shares outstanding 118,428 247,389
Adjustment for stock-based compensation awards, net 2,024 2,116
Adjustment for assumed conversion of exchangeable promissory note 5,882 -
Adjustment for assumed conversion of Series C, D-1 and D-2 preferred stock - 3,303
Adjusted weighted average common shares outstanding 126,334 252,808
Diluted earnings per share:
Continuing operations $ .69 $ .65
Discontinued operations .53 -
Net income $ 1.22 $ .65
(G) The number of common shares outstanding, in thousands, at Sept. 30, 2007 was 118,445, excluding 60,671 shares held by subsidiaries
of the Company and 8,929 shares held by the Tribune Employee Stock Ownership Plan.
9
4. TRIBUNE COMPANY
THREE QUARTERS RESULTS OF OPERATIONS (Unaudited)
(In thousands, except per share data)
THREE QUARTERS (A)
%
2007 2006 Change
OPERATING REVENUES $ 3,794,289 $ 3,995,350 (5.0)
OPERATING EXPENSES (B) 3,187,114 3,235,306 (1.5)
OPERATING PROFIT (C) 607,175 760,044 (20.1)
Net Income on Equity Investments (D) 67,953 51,308 32.4
Interest and Dividend Income 11,908 9,330 27.6
Interest Expense (385,925) (180,375) 114.0
Non-Operating Items (E) (203,922) 43,104 NM
Income from Continuing Operations Before Income Taxes 97,189 683,411 (85.8)
Income Taxes (E) 35,761 (255,616) NM
Income from Continuing Operations 132,950 427,795 (68.9)
Income (Loss) from Discontinued Operations, net of tax (F) 32,796 (72,857) NM
NET INCOME 165,746 354,938 (53.3)
Preferred Dividends - (6,309) (100.0)
Net Income Attributable to Common Shares $ 165,746 $ 348,629 (52.5)
EARNINGS PER SHARE
Basic
Continuing Operations $ .71 $ 1.48 (52.0)
Discontinued Operations .17 (.26) NM
Net Income $ .88 $ 1.22 (27.9)
Diluted (G)
Continuing Operations $ .70 $ 1.47 (52.4)
Discontinued Operations .17 (.25) NM
Net Income $ .88 $ 1.22 (27.9)
DIVIDENDS PER COMMON SHARE $ .18 $ .54 (66.7)
Diluted Weighted Average Common Shares Outstanding (H) 189,391 286,435 (33.9)
10
5. (A) 2007 first three quarters: Jan. 1, 2007 to Sept. 30, 2007. (39 weeks)
2006 first three quarters: Dec. 26, 2005 to Sept. 24, 2006. (39 weeks)
(B) Operating expenses for the first three quarters of 2007 included a severance charge of $32 million, or $.10 per diluted share, at publishing and corporate,
and a charge of $24 million, or $.08 per diluted share, for the write-off of Los Angeles Times plant equipment related to the previously closed
San Fernando Valley facility. Operating expenses for the first three quarters of 2006 included a charge of $20 million, or $.04 per diluted share,
for severance and other payments associated with new union contracts at Newsday, $2 million for other severance charges in publishing and a gain
of $3 million, or $.01 per diluted share, related to real property sales at Publishing.
(C) Operating profit excludes interest and dividend income, interest expense, equity income and losses, non-operating items and income taxes.
(D) Net income on equity investments for the first three quarters of 2006 included the Company's $5.9 million share of a one-time
favorable income tax adjustment at CareerBuilder.
(E) The first three quarters of 2007 included the following non-operating items:
Pretax After-tax
Gain (Loss) Gain (Loss) Diluted EPS
Loss on derivatives and related investments (1) $ (182,144) $ (111,108) $ (.59)
Strategic transaction expenses (2) (38,557) (32,588) (.17)
Gain on TMCT transactions (3) 8,329 5,081 .03
Other, net 8,450 3,205 .02
Income tax adjustment (4) - 90,704 .48
Total non-operating items $ (203,922) $ (44,706) $ (.24)
The first three quarters of 2006 included the following non-operating items:
Pretax After-tax
Gain (Loss) Gain (Loss) Diluted EPS
Loss on derivatives and related investments (1) $ (34,184) $ (20,852) $ (.07)
Gain on TMCT transactions (3) 59,596 47,988 .17
Gain on sales of investments, net (5) 20,811 12,695 .04
Other, net (3,119) 169 -
Income tax adjustments - 225 -
Total non-operating items $ 43,104 $ 40,225 $ .14
(1) Loss on derivatives and related investments represents primarily the net change in fair values of the derivative component of the Company's
PHONES and the related Time Warner shares.
(2) Includes expenses related to the Company's strategic review and leveraged ESOP and going-private transactions approved by the Company's
board of directors on April 1, 2007.
(3) The 2007 gain related to the redemption of the Company's remaining interest in TMCT, LLC and TMCT II, LLC in September 2007. The 2006 gain
related to the restructuring of TMCT, LLC and TMCT II, LLC in September 2006.
(4) On Oct. 1, 2007, the Company announced that it had finalized the settlement of its appeal of the 2005 Tax Court decision disallowing the
tax-free reorganizations of Matthew Bender and Mosby, former subsidiaries of Times Mirror. As a result of the settlement, the Company received
refunds of federal income taxes and interest of $4 million on Sept. 26, 2007 and $340 million on Oct. 1, 2007. After consideration of income taxes
on the interest received, the net cash proceeds totaled approximately $286 million. These refunds, together with related state income tax benefits
of $29 million, were accounted for as a $91 million reduction in third quarter income tax expense and a $224 million reduction in goodwill recorded
on the Company's balance sheet.
(5) The 2006 gain on sales of investments consisted primarily of the gain on sale of 2.8 million shares of Time Warner stock unrelated to the PHONES.
11
6. (F) During the third quarter of 2007, the Company entered into negotiations to sell the stock of one of its subsidiaries, EZ Buy and EZ Sell Recycler
Corporation (quot;Recyclerquot;). Recycler publishes a collection of free classified newspapers in Southern California. The sale of Recycler closed on
Oct. 17, 2007. In February 2007, the Company announced an agreement to sell the New York edition of Hoy , the Company's Spanish-language daily
newspaper (quot;Hoy, New Yorkquot;). In March 2007, the Company announced its intentions to sell its Southern Connecticut Newspapers—The Advocate
(Stamford) and Greenwich Time (collectively quot;SCNIquot;). The sale of Hoy, New York closed in May 2007. In June 2006, the Company announced
agreements to sell its Atlanta and Albany television stations. The sale of Atlanta closed in August 2006. In September 2006, the Company
announced an agreement to sell its Boston television station. The sales of Albany and Boston closed in December 2006. Operating results for these
business units are reported as discontinued operations. Income (loss) from discontinued operations in the first three quarters included the following:
Three Quarters
2007 2006
Income (loss) from operations, net of tax $ (962) $ 4,676
Gain (loss) on sales of discontinued operations, net of tax (1) (2) 33,758 (77,533)
Total $ 32,796 $ (72,857)
(1) In the first quarter of 2007, the Company recorded an after-tax loss of $33 million to write down the SCNI net assets to estimated fair value, less
costs to sell. The Company recorded a favorable $3 million after-tax adjustment to the expected SCNI loss in the third quarter of 2007. In the
third quarter of 2007, the Company recorded a $1 million pretax loss on the sale of Recycler. Due to the Company's high tax basis in the stock
of Recycler, the sale will generate a significantly higher capital loss for income tax purposes. As a result, the Company recorded a $65 million
tax benefit in the third quarter of 2007, resulting in an after-tax gain of $64 million.
(2) In the first three quarters of 2006, the Company recorded a pretax loss of $89 million, including $80 million of allocated television group goodwill, to write
down the Atlanta and Albany net assets to estimated fair value, less costs to sell.
(G) For the first three quarters of 2007 and 2006, weighted average common shares outstanding used in the calculations of diluted earnings per share (quot;EPSquot;)
were adjusted for the dilutive effect of stock-based compensation awards. The assumed conversion of the Company's $200 million exchangeable promissory
note was not included in the calculation of diluted EPS for the first three quarters of 2007 because its effect was antidilutive. The Company's Series C, D-1
and D-2 convertible preferred shares were not included in the calculation of diluted EPS for the first three quarters of 2006 because their effects were antidilutive.
All of the Series C, D-1 and D-2 preferred shares were issued to and held by TMCT, LLC and TMCT II, LLC. In connection with a restructuring of these
limited liability companies, all of these preferred shares were distributed to the Company on Sept. 22, 2006 and are no longer outstanding. Following are
the calculations for the first three quarters:
Three Quarters
2007 2006
Income from continuing operations $ 132,950 $ 427,795
Income (loss) from discontinued operations, net of tax 32,796 (72,857)
Net income 165,746 354,938
Dividends for Series C, D-1 and D-2 preferred stock - (6,309)
Net income attributable to common shares $ 165,746 $ 348,629
Weighted average common shares outstanding 187,604 284,764
Adjustment for stock-based compensation awards, net 1,787 1,671
Adjusted weighted average common shares outstanding 189,391 286,435
Diluted earnings per share:
Continuing operations $ .70 $ 1.47
Discontinued operations .17 (.25)
Net income $ .88 $ 1.22
(H) The number of common shares outstanding, in thousands, at Sept. 30, 2007 was 118,445, excluding 60,671 shares held by subsidiaries
of the Company and 8,929 shares held by the Tribune Employee Stock Ownership Plan.
12
8. (A) The Company uses cash operating expenses to evaluate internal performance. The Company has presented cash operating expenses because it is a common
measure used by rating agencies, financial analysts and investors. Cash operating expense is not a measure of financial performance under generally accepted
accounting principles (quot;GAAPquot;) and should not be considered in isolation or as a substitute for measures of performance prepared in accordance with
GAAP.
Following is a reconciliation of operating expenses to cash operating expenses for the third quarter of 2007:
Broadcasting and
Publishing Entertainment Corporate Consolidated
Operating expenses $ 748,305 $ 288,264 $ 11,329 $ 1,047,898
Less: depreciation and amortization expense 43,105 12,703 274 56,082
Cash operating expenses $ 705,200 $ 275,561 $ 11,055 $ 991,816
Following is a reconciliation of operating expenses to cash operating expenses for the third quarter of 2006:
Broadcasting and
Publishing Entertainment Corporate Consolidated
Operating expenses $ 795,840 $ 284,755 $ 13,718 $ 1,094,313
Less: depreciation and amortization expense 42,900 13,505 356 56,761
Cash operating expenses $ 752,940 $ 271,250 $ 13,362 $ 1,037,552
Following is a reconciliation of operating expenses to cash operating expenses for the first three quarters of 2007:
Broadcasting and
Publishing Entertainment Corporate Consolidated
Operating expenses $ 2,347,097 $ 795,115 $ 44,902 $ 3,187,114
Less: depreciation and amortization expense 131,974 38,182 832 170,988
Cash operating expenses $ 2,215,123 $ 756,933 $ 44,070 $ 3,016,126
Following is a reconciliation of operating expenses to cash operating expenses for the first three quarters of 2006:
Broadcasting and
Publishing Entertainment Corporate Consolidated
Operating expenses $ 2,403,309 $ 783,896 $ 48,101 $ 3,235,306
Less: depreciation and amortization expense 126,663 37,913 1,041 165,617
Cash operating expenses $ 2,276,646 $ 745,983 $ 47,060 $ 3,069,689
(B) Cash operating expenses for the third quarter of 2007 included a severance charge of $3.2 million ($3.5 million at publishing and a $.3 million credit
at corporate), and for the first three quarters included a severance charge of $32 million ($29 million at publishing and $3 million at corporate). In
addition, publishing cash operating expenses for the first three quarters of 2007 included a charge of $24 million for the write-off of Los Angeles
Times plant equipment related to the previously closed San Fernando Valley facility. Publishing cash operating expenses for the third quarter of
2006 included a charge of $2.2 million for severance and a gain of $.7 million related to a real property sale. Publishing cash operating expenses
for the first three quarters of 2006 included a charge of $20 million for severance and other payments associated with the new union contracts at
Newsday, a charge of $2.2 million for other severance and a gain of $2.6 million related to real property sales.
(C) Operating cash flow is defined as operating profit before depreciation and amortization. The Company uses operating cash flow along with operating profit
and other measures to evaluate the financial performance of the Company's business segments. The Company has presented operating cash flow because it
is a common alternative measure of financial performance used by rating agencies, financial analysts and investors. These groups use operating cash flow
along with other measures as a way to estimate the value of a company. The Company's definition of operating cash flow may not be consistent with that
of other companies. Operating cash flow does not represent cash provided by operating activities as reflected in the Company's consolidated statements of
cash flows, is not a measure of financial performance under GAAP and should not be considered in isolation or as a substitute for measures of performance
prepared in accordance with GAAP.
14
9. (D) Operating profit for each segment excludes interest and dividend income, interest expense, equity income and losses, non-operating items and
income taxes.
Following is a reconciliation of operating profit (loss) to operating cash flow for the third quarter of 2007:
Broadcasting and
Publishing Entertainment Corporate Consolidated
Operating profit (loss) $ 122,543 $ 117,787 $ (11,329) $ 229,001
Add back: depreciation and amortization expense 43,105 12,703 274 56,082
Operating cash flow $ 165,648 $ 130,490 $ (11,055) $ 285,083
Following is a reconciliation of operating profit (loss) to operating cash flow for the third quarter of 2006:
Broadcasting and
Publishing Entertainment Corporate Consolidated
Operating profit (loss) $ 143,774 $ 107,800 $ (13,718) $ 237,856
Add back: depreciation and amortization expense 42,900 13,505 356 56,761
Operating cash flow $ 186,674 $ 121,305 $ (13,362) $ 294,617
Following is a reconciliation of operating profit (loss) to operating cash flow for the first three quarters of 2007:
Broadcasting and
Publishing Entertainment Corporate Consolidated
Operating profit (loss) $ 365,174 $ 286,903 $ (44,902) $ 607,175
Add back: depreciation and amortization expense 131,974 38,182 832 170,988
Operating cash flow $ 497,148 $ 325,085 $ (44,070) $ 778,163
Following is a reconciliation of operating profit (loss) to operating cash flow for the first three quarters of 2006:
Broadcasting and
Publishing Entertainment Corporate Consolidated
Operating profit (loss) $ 522,498 $ 285,647 $ (48,101) $ 760,044
Add back: depreciation and amortization expense 126,663 37,913 1,041 165,617
Operating cash flow $ 649,161 $ 323,560 $ (47,060) $ 925,661
15