SlideShare a Scribd company logo
1 of 11
Download to read offline
DTE ENERGY COMPANY
                                                   NET INCOME SUMMARY (PRELIMINARY/UNAUDITED)

                                                                                           Three Months Ended December 31
                                                                                                                                              2003
                                                                              2004
                                                                                                                        Reported                                 Operating
                                                             Reported                           Operating
                                                                                                                        Earnings          Adjustments            Earnings
(in Millions)                                                Earnings     Adjustments           Earnings
Energy Resources
  Utility – Power Generation ....................                                                                   $        103        $         (21 ) A       $           82
                                                             $     11     $     28 A           $         39

 Non-utility
  Synfuels ...............................................                                                                    48                    -                       48
                                                                   48            -                       48
  Coke Batteries......................................                                                                         2                    -                        2
                                                                    1            -                        1
  On Site Energy Projects .......................                                                                              3                    -                        3
                                                                    5            -                        5
  Power Generation ................................                                                                           (4 )                  -                       (4 )
                                                                   (3 )          -                       (3 )
  Coal Services .......................................                                                                        1                    -                        1
                                                                    5            -                        5
  Biomass Energy ...................................                                                                           2                    -                        2
                                                                    2            -                        2
  Energy Trading & CoEnergy Portfolio                                                                                         (7 )                  -                       (7 )
                                                                   30            -                       30
   Energy Resources Overheads/Development.                                                                                    (5 )                  -                       (5 )
                                                                  (13 )          -                      (13 )
   Total Non-utility ..................................                                                                       40                    -                       40
                                                                   75            -                       75
                                                                                                                             143                  (21 )                    122
                                                                   86           28                      114

Energy Distribution
 Utility – Power Distribution...................                                                                                2                    -                       2
                                                                   25             1B                     26
 Non-utility .............................................                                                                     (3 )                  -                      (3 )
                                                                   (4 )           -                      (4 )
                                                                                                                               (1 )                  -                      (1 )
                                                                   21             1                      22

Energy Gas
 Utility – Gas Distribution ......................                                                                            22                     -                      22
                                                                   42             1B                     43
 Non-utility .............................................                                                                     4                     -                       4
                                                                    7             -                       7
                                                                                                                              26                     -                      26
                                                                   49             1                      50

Corporate and Other
 Energy Technology Investments............                                                                                     -                    -                        -
                                                                   (3 )          -                       (3 )
 Other Holding Company                                                                                                        61                  (70 ) C                   (9 )
                                                                  (35 )         14 C                    (21 )
                                                                                                                              61                  (70 )                     (9 )
                                                                  (38 )         14                      (24 )

Discontinued Operations
 Income from operations .........................                                                                               -                    -                       -
                                                                    -             -                        -
 Impairment loss/Gain on sale ................                                                                                  -                    -                       -
                                                                   (5 )           5D                       -
                                                                                                                                -                    -                       -
                                                                   (5 )           5                        -

Cumulative Effect of Accounting
Changes
 Asset retirement obligations ..................                                                                               -                    -                        -
                                                                    -            -                        -
 Energy trading activities ........................                                                                            -                    -                        -
                                                                    -            -                        -
                                                                                                                               -                    -                        -
                                                                    -            -                        -
                                                                                                                    $        229        $         (91 )         $          138
Net Income..............................................     $    113     $     49             $        162


ADJUSTMENTS KEY
A) Stranded cost adjustment............................................ Stranded costs adjustment made pursuant to November 2004 MPSC order
B) DTE2 project costs ..................................................... Incremental DTE2 project costs
C) Tax credit driven normalization ................................. Quarterly adjustment at DTE Energy to normalize its effective tax rate. Annual results not impacted
D) Gain on sale of ITC.................................................... Gain or a related adjustment from the sale of International Transmission Company


                                                                                                                                                                       Page 1
DTE ENERGY COMPANY
                                                   NET INCOME SUMMARY (PRELIMINARY/UNAUDITED)

                                                                                          Twelve Months Ended December 31
                                                                                                                                    2003
                                                                              2004
                                                                                                               Reported                              Operating
                                                             Reported                        Operating
                                                                                                               Earnings         Adjustments          Earnings
(in Millions)                                                Earnings     Adjustments        Earnings
Energy Resources
  Utility – Power Generation ....................                                                          $        235        $       (21 ) A       $      230
                                                             $     62     $      21 A       $      85
                                                                                                                                        16 F
                                                                                  2B
 Non-utility
  Synfuels ...............................................                                                          197                  -                  197
                                                                  198             -               198
  Coke Batteries......................................                                                               (7 )                -                   (7 )
                                                                    9             -                 9
  On Site Energy Projects .......................                                                                     9                  -                    9
                                                                   23             -                23
  Power Generation ................................                                                                   4                  -                    4
                                                                  (18 )           -               (18 )
  Coal Services .......................................                                                               8                  -                    8
                                                                   12             -                12
  Biomass Energy ...................................                                                                  6                  -                    6
                                                                    5             -                 5
  Energy Trading & CoEnergy Portfolio                                                                                45                (16 ) G               29
                                                                   92           (48 ) C            44
   Energy Resources Overheads/Development.                                                                          (20 )                -                  (20 )
                                                                  (40 )           -               (40 )
   Total Non-utility ..................................                                                             242                (16 )                226
                                                                  281           (48 )             233
                                                                                                                    477                (21 )                456
                                                                  343           (25 )             318

Energy Distribution
 Utility – Power Distribution...................                                                                     17                 14 H                 31
                                                                   88                5B             93
 Non-utility .............................................                                                          (15 )                -                  (15 )
                                                                  (19 )              -             (19 )
                                                                                                                      2                 14                   16
                                                                   69                5              74

Energy Gas
 Utility – Gas Distribution ......................                                                                   29                 17 I                 46
                                                                   20                4B            24
 Non-utility .............................................                                                           29                  -                   29
                                                                   21                -             21
                                                                                                                     58                 17                   75
                                                                   41                4             45

Corporate and Other
 Energy Technology Investments............                                                                           (9 )                -                   (9 )
                                                                    6                -               6
 Other Holding Company                                                                                              (48 )               10 J                (38 )
                                                                  (16 )              -             (16 )
                                                                                                                    (57 )               10                  (47 )
                                                                  (10 )                            (10 )

Discontinued Operations
 Income from operations .........................                                                                     5                 (5 ) K                 -
                                                                    -             -                  -
 Impairment loss/Gain on sale ................                                                                        -                  -                     -
                                                                   (7 )           7D                 -
                                                                                                                     63                (63 ) E                 -
                                                                   (5 )           5E                 -
                                                                                                                     68                (68 )                   -
                                                                  (12 )          12                  -

Cumulative Effect of Accounting
Changes
 Asset retirement obligations ..................                                                                    (11 )               11 L                  -
                                                                    -             -                 -
 Energy trading activities ........................                                                                 (16 )               16 M                  -
                                                                    -             -                 -
                                                                                                                    (27 )               27                    -
                                                                    -             -                 -
                                                                                                           $        521        $       (21 )         $      500
Net Income..............................................     $    431     $      (4 )       $     427


ADJUSTMENTS KEY
A) Stranded cost adjustment............................................ Stranded costs adjustment made pursuant to November 2004 MPSC order
B) DTE2 project costs ..................................................... Incremental DTE2 project costs
C) Adjustment for contract termination / modification... Terminated a long-term gas exchange agreement and modified a related transportation agreement with a
                                                                            pipeline company
D) Impairment loss / Discontinued operations................ Impairment charge relating to the expected loss on sale of Southern Missouri Gas Company
E) Gain on sale of ITC..................................................... Gain or a related adjustment from the sale of International Transmission Company
F) Blackout Costs……………………………………….Costs associated with the August 2003 Blackout
G) Adjustment of EITF 98-10 accounting change .......... Flowback of the cumulative effect of a change in accounting principle from rescission of EITF Issue
                                                                            No. 98-10
H) Loss on sale of steam heating business ...................... Sold Detroit Edison steam heating business
I) Disallowance of gas costs ........................................... Reserve for the potential disallowance of MichCon 2002 gas procurement costs
J) Contribution to DTE Energy Foundation .................... Used a portion of International Transmission Company sale proceeds to fund the DTE Energy Foundation
K) Adjustment for discontinued operations .................... Sold International Transmission Company
L) Asset retirement obligations ....................................... Cumulative effect of a change in accounting principle from adoption of SFAS 143
M) Adjustment of EITF 98-10 accounting change ......... Cumulative effect of a change in accounting principle from rescission of EITF Issue No. 98-10


                                                                                                                                                          Page 2
DTE ENERGY COMPANY AND SUBSIDIARY COMPANIES
                     Earnings Variance Analysis (Preliminary/Unaudited)


2003 Reported Earnings per Share                                                $3.09
                                                                                (0.12)
   Stranded costs pursuant to Nov. 2004 MPSC order
   Costs associated with August 2003 blackout                                    0.10
   Accounting change related to rescission of EITF 98-10                        (0.10)
   Loss on sale of Detroit Edison steam heating business                         0.08
   Reserve for potential disallowance of MichCon 2002 gas costs                  0.10
   Contribution to DTE Energy Foundation                                         0.06
   Discontinuted operations - International Transmission Company (ITC)          (0.03)
   Gain or related adjustment from the sale of ITC                              (0.37)
   Cumulative effect of accounting change - SFAS 143                             0.07
   Cumulative effect of accounting change - rescission of EITF 98-10             0.09
2003 Operating Earnings per Share                                               $2.97
Regulated Electric
   Weather                                                                      (0.09)
   Choice Lost Margin                                                           (0.51)
   Net Rate Relief                                                               0.14
   Regulatory Deferrals                                                          0.18
   Pension/Health Care                                                          (0.16)
   Other                                                                        (0.03)

Regulated Gas
   Weather                                                                      (0.06)
   Uncollectables                                                               (0.08)
   Interim rate relief                                                           0.03
   Pension/Health Care                                                          (0.03)
   Other                                                                         0.01

Non-Regulated
   Synfuels                                                                      0.01
   Coke Batteries                                                                0.09
   On-Site Projects                                                              0.08
   Power Generation                                                             (0.14)
   Energy Trading & CoEnergy Portfolio                                           0.09
   Energy Technology Investments                                                 0.09
   Overheads and other                                                          (0.14)

Holding Company & Share Dilution                                                 0.01
                                                                                $2.46
2004 Operating Earnings per Share

   Stranded costs pursuant to Nov. 2004 MPSC order                              (0.12)
   Incremental DTE2 project costs                                               (0.06)
   Terminated a long-term gas exchange agreement with a pipeline company         0.27
   Impairment charge related to expected loss on sale of So. Missouri Gas Co.   (0.04)
   Gain or related adjustment from the sale of ITC                              (0.02)
2004 Reported Earnings per Share                                                $2.49

                                                                                        Page 3
DTE ENERGY COMPANY
               CONSOLIDATED STATEMENT OF FINANCIAL POSITION (UNAUDITED)

                                                                                                                                      December 31
                                                                                                                                                    2003
                                                                                                                               2004
(in Millions)
ASSETS
Current Assets
  Cash and cash equivalents ................................................................................                                  $             54
                                                                                                                           $           56
  Restricted cash .................................................................................................                                        131
                                                                                                                                      126
  Accounts receivable
    Customer (less allowance for doubtful accounts of $129 and $99, respectively)                                                                          877
                                                                                                                                      880
    Accrued unbilled revenues .............................................................................                                                316
                                                                                                                                      378
    Other...............................................................................................................                                   338
                                                                                                                                      383
  Inventories
    Fuel and gas....................................................................................................                                    467
                                                                                                                                   509
    Materials and supplies ....................................................................................                                         162
                                                                                                                                   159
  Assets from risk management and trading activities ........................................                                                           186
                                                                                                                                   296
  Other.................................................................................................................                                181
                                                                                                                                   209
                                                                                                                                                      2,712
                                                                                                                                 2,996

Investments
  Nuclear decommissioning trust funds ..............................................................                                                    518
                                                                                                                                   590
  Other.................................................................................................................                                601
                                                                                                                                   558
                                                                                                                                                      1,119
                                                                                                                                 1,148


Property
 Property, plant and equipment..........................................................................                                             17,679
                                                                                                                                18,011
 Less accumulated depreciation and depletion ..................................................                                 (7,520 )             (7,355 )
                                                                                                                                                     10,324
                                                                                                                                10,491


Other Assets
 Goodwill...........................................................................................................                                  2,067
                                                                                                                                 2,067
 Regulatory assets .............................................................................................                                      2,063
                                                                                                                                 2,119
 Securitized regulatory assets ...........................................................................                                            1,527
                                                                                                                                 1,438
 Notes receivable ...............................................................................................                                       469
                                                                                                                                   529
 Assets from risk management and trading activities ........................................                                                             88
                                                                                                                                   125
 Prepaid pension assets ......................................................................................                                          181
                                                                                                                                   184
 Other.................................................................................................................                                 203
                                                                                                                                   200
                                                                                                                                                      6,598
                                                                                                                                 6,662


                                                                                                                                              $      20,753
Total Assets ........................................................................................................      $    21,297


                                                                                                                                                  Page 4
DTE ENERGY COMPANY
               CONSOLIDATED STATEMENT OF FINANCIAL POSITION (UNAUDITED)

                                                                                                                                      December 31
                                                                                                                                                    2003
                                                                                                                               2004
(in Millions, Except Shares)
LIABILITIES AND SHAREHOLDERS’ EQUITY
Current Liabilities
  Accounts payable..............................................................................................                              $        625
                                                                                                                           $       836
  Accrued interest................................................................................................                                     110
                                                                                                                                   111
  Dividends payable ............................................................................................                                        87
                                                                                                                                    90
  Accrued payroll ................................................................................................                                      51
                                                                                                                                    33
  Income taxes.....................................................................................................                                    185
                                                                                                                                    16
  Short-term borrowings......................................................................................                                          370
                                                                                                                                   403
  Current portion long-term debt, including capital leases..................................                                                           477
                                                                                                                                   692
  Liabilities from risk management and trading activities...................................                                                           326
                                                                                                                                   369
  Other.................................................................................................................                               593
                                                                                                                                   637
                                                                                                                                                     2,824
                                                                                                                                 3,187
Other Liabilities
 Deferred income taxes ......................................................................................                                          988
                                                                                                                                 1,124
 Regulatory liabilities ........................................................................................                                       817
                                                                                                                                   817
 Asset retirement obligations ............................................................................                                             866
                                                                                                                                   916
 Unamortized investment tax credit...................................................................                                                  156
                                                                                                                                   143
 Liabilities from risk management and trading activities...................................                                                            173
                                                                                                                                   224
 Liabilities from transportation and storage contracts .......................................                                                         495
                                                                                                                                   387
 Accrued pension liability..................................................................................                                           345
                                                                                                                                   265
 Deferred gains from asset sales ........................................................................                                              311
                                                                                                                                   414
 Minority interest ...............................................................................................                                     156
                                                                                                                                   132
 Nuclear decommissioning ...............................................................................                                                67
                                                                                                                                    78
 Other.................................................................................................................                                599
                                                                                                                                   634
                                                                                                                                                     4,973
                                                                                                                                 5,134
Long-Term Debt (net of current portion)
 Mortgage bonds, notes and other......................................................................                                               5,624
                                                                                                                                 5,495
 Securitization bonds .........................................................................................                                      1,496
                                                                                                                                 1,400
 Equity-linked securities ....................................................................................                                         185
                                                                                                                                   178
 Trust preferred-linked securities.......................................................................                                              289
                                                                                                                                   289
 Capital lease obligations...................................................................................                                           75
                                                                                                                                    66
                                                                                                                                                     7,669
                                                                                                                                 7,428

Commitments and Contingencies

Shareholders’ Equity
 Common stock, without par value, 400,000,000 shares
  authorized,174,209,034 and 168,606,522 shares issued
  and outstanding, respectively .........................................................................                                            3,109
                                                                                                                                 3,323
 Retained earnings .............................................................................................                                     2,308
                                                                                                                                 2,383
 Accumulated other comprehensive loss ...........................................................                                                     (130 )
                                                                                                                                  (158 )
                                                                                                                                                     5,287
                                                                                                                                 5,548

                                                                                                                                              $     20,753
Total Liabilities and Shareholders’ Equity .....................................................                           $    21,297


                                                                                                                                                    Page 5
DTE ENERGY COMPANY
       CONSOLIDATED STATEMENT OF CASH FLOWS (UNAUDITED)
                                                                                                 Year Ended December 31
                                                                                                                 2003
                                                                                                  2004
(in Millions)
Operating Activities
  Net income..........................................................................                        $      521
                                                                                             $        431
  Adjustments to reconcile net income to net cash from
    operating activities:
    Depreciation, depletion and amortization .........................                                               691
                                                                                                      744
    Deferred income taxes ......................................................                                    (220 )
                                                                                                      129
    Gain on sale of interests in synfuel projects .....................                                              (83 )
                                                                                                     (219 )
    Gain on sale of ITC and other assets, net ........................                                              (145 )
                                                                                                      (17 )
    Partners’ share of synfuel project losses...........................                                             (78 )
                                                                                                     (223 )
    Contributions from synfuel partners.................................                                              65
                                                                                                      141
    Cumulative effect of accounting changes.........................                                                  27
                                                                                                        -
    Changes in assets and liabilities, exclusive of
     changes shown separately ...............................................                                        172
                                                                                                        9
   Net cash from operating activities .....................................                                          950
                                                                                                      995

Investing Activities
  Plant and equipment expenditures – utility ........................                                               (679 )
                                                                                                     (815 )
  Plant and equipment expenditures – non-utility .................                                                   (72 )
                                                                                                      (89 )
  Investment in joint ventures ..............................................                                        (34 )
                                                                                                      (36 )
  Proceeds from sale of interests in synfuel projects.............                                                    89
                                                                                                      221
  Proceeds from sale of ITC and other assets........................                                                 669
                                                                                                      104
  Restricted cash for debt redemptions .................................                                             106
                                                                                                        5
  Other investments...............................................................                                   (69 )
                                                                                                      (71 )
  Net cash from (used for) investing activities ....................                                                  10
                                                                                                     (681 )

Financing Activities
  Issuance of long-term debt .................................................                                        527
                                                                                                      736
  Redemption of long-term debt ...........................................                                         (1,208 )
                                                                                                     (759 )
  Short-term borrowings, net ................................................                                         (44 )
                                                                                                       33
  Issuance of common stock ................................................                                            44
                                                                                                       41
  Dividends on common stock ..............................................                                           (346 )
                                                                                                     (354 )
  Other ..................................................................................                            (12 )
                                                                                                       (9 )
  Net cash used for financing activities.................................                                          (1,039 )
                                                                                                     (312 )
                                                                                                                      (79 )
Net Increase (Decrease) in Cash and Cash Equivalents ...                                                2
                                                                                                                      133
Cash and Cash Equivalents at Beginning of Period .........                                             54
                                                                                                              $        54
Cash and Cash Equivalents at End of Period....................                               $         56


                                                                                                                              Page 6
THE DETROIT EDISON COMPANY
  CONSOLIDATED STATEMENT OF OPERATIONS (UNAUDITED)
                                                                                                                 Year ended
                                                                                                                December 31
(in Millions)                                                                                                             2003
                                                                                                              2004

                                                                                                                         $   3,695
Operating Revenues............................................................................            $ 3,568

Operating Expenses
 Fuel and purchased power..................................................................                                    939
                                                                                                                 885
 Operation and maintenance................................................................                                   1,332
                                                                                                               1,395
 Depreciation and amortization ...........................................................                                     473
                                                                                                                 523
 Taxes other than income ....................................................................                                  257
                                                                                                                 249
 Asset gains and losses, net .................................................................                                  20
                                                                                                                  (1 )
                                                                                                                             3,021
                                                                                                               3,051

                                                                                                                              674
Operating Income ..............................................................................                 517

Other (Income) and Deductions
 Interest expense..................................................................................                           284
                                                                                                                280
 Interest income...................................................................................                            (7 )
                                                                                                                  -
 Other, net ...........................................................................................                         -
                                                                                                                 23
                                                                                                                              277
                                                                                                                303

                                                                                                                              397
Income Before Income Taxes .............................................................                        214

                                                                                                                              145
Income Tax Provision .........................................................................                    64

                                                                                                                              252
Income Before Accounting Change ...................................................                             150

                                                                                                                                 (6 )
Cumulative Effect of Accounting Change.........................................                                    -

                                                                                                                              246
Reported Earnings .............................................................................                 150

Cumulative Effect of Accounting Changes
 Asset Retirement Obligations (FAS 143)…………………………..                                                                               6
                                                                                                                   -
Unusual Items
 Stranded Cost adjustment..................................................................                                    (21 )
                                                                                                                  21
 DTE2 Capitalized costs.....................................................................                                     -
                                                                                                                   7
 August 2003 Blackout Costs.............................................................                                        16
                                                                                                                   -
 Loss on Sale of Steam Heating Business ..........................................                                              14
                                                                                                                   -

Operating Earnings………………………………………………….                                                                                   $    261
                                                                                                          $     178


The Consolidated Statement of Operations (Unaudited) should be
read in conjunction with the Notes to Consolidated Financial
Statements appearing in the Annual Report to Shareholders, Form
10K and Form 10Q


                                                                                                                                        Page 7
MICHIGAN CONSOLIDATED GAS COMPANY
  CONSOLIDATED STATEMENT OF OPERATIONS (UNAUDITED)
                                                                                                              Year ended
                                                                                                             December 31
(in Millions)                                                                                                          2003
                                                                                                           2004

                                                                                                                      $   1,492
Operating Revenues ............................................................................ $ 1,645

Operating Expenses
 Cost of gas ..........................................................................................                     888
                                                                                                            1,044
 Operation and maintenance ................................................................                                 349
                                                                                                              387
 Depreciation, depletion and amortization ...........................................                                       105
                                                                                                              108
 Taxes other than income .....................................................................                               52
                                                                                                               48
 Asset gains and losses, net..................................................................                                8
                                                                                                               (2 )
                                                                                                                          1,402
                                                                                                            1,585

                                                                                                                            90
Operating Income ...............................................................................               60

Other (Income) and Deductions
 Interest expense ..................................................................................                         57
                                                                                                               57
 Interest income ...................................................................................                        (10 )
                                                                                                               (9 )
 Other, net ............................................................................................                    (11 )
                                                                                                               (2 )
                                                                                                                             36
                                                                                                               46

                                                                                                                            54
Income Before Income Taxes..............................................................                       14

                                                                                                                               9
Income Tax Provision (Benefit) ..........................................................                      (8 )

                                                                                                                            45
Reported Earnings...............................................................................               22

                                                                                                                              (6 )
Purchase Accounting and Other Adjustments ..................................                                   (3 )
                                                                                                                            (17 )
                                                                                                                -
Disallowance of Gas Costs...................................................................
                                                                                                                              -
                                                                                                                4
DTE2 Capitalized Costs ......................................................................

                                                                                                                      $     22
Operating Earnings ............................................................................ $              23


The Consolidated Statement of Operations (Unaudited) should be
read in conjunction with the Notes to Consolidated Financial
Statements appearing in the Annual Report to Shareholders, Form
10K and Form 10Q


                                                                                                                                     Page 8
DTE Energy Debt/Equity Calculation
                          As of December 31, 2004
                                  ($ millions)


                           short-term borrowings           403
                current portion LTD + cap leases           692
                                   long-term debt         5,495
                             securitization bonds         1,400
                                    capital leases          66
                                      less QUIDS           (385)
                   less MichCon short-term debt            (232)
less securitization debt, including current portion      (1,496)
                                       Total debt         5,943


                                  Trust preferred          289
                                           QUIDS           385
                           Mandatory convertible           178
                          Total preferred/ other           852


                                            Equity        5,548


                             Total capitalization        12,343


                                                 Debt     48.2%
                                  Preferred stock          6.9%
                   Common shareholders' equity            44.9%


                                                 Total   100.0%


                                                                   Page 9
Sales Analysis - Q4
                                                                                  Electric Revenue - Detroit Edison Service Area
 Electric Sales - Detroit Edison Service Area                     (GWh)                              ($000s)

                                     Q4 2004         Q4 2003 % Change                                            Q4 2004           Q4 2003        % Change

Residential                               3,426           3,519        -3%     Residential                         305,966           314,120              -3%
Commercial                                3,328           3,691       -10%     Commercial                          281,008           305,971              -8%
Industrial                                3,054           2,990           2%   Industrial                          150,646           150,968                 0%
Other                                        648           667         -3%     Other                                 27,871           27,947                 0%
                                      10,456          10,867           -4%                                         765,491           799,006              -4%
Interconnection                                                                Interconnection
                                          2,274            992       129%                                            84,797           30,814           175%
Choice*                                                                        Choice*
                                          2,563           2,089       23%                                            48,734           10,439           367% **
TOTAL SALES                           15,293          13,948          10%      TOTAL REVENUES                      899,022           840,259                 7%


* Includes Dearborn Industrial Group sales                                     * Distribution charge includes Dearborn Industrial Group revenues

                                                                               ** Reflects impact of interim rate order eliminating Choice transition credit &
                                                                                  implementing transition charges

Gas Sales - MichCon Service Area (Mcf)                                         Gas Revenue - MichCon Service Area ($000s)

                                   Q4 2004         Q4 2003                                                       Q4 2004           Q4 2003
                                                                  % Change                                                                        % Change

Residential                        39,621,965      40,307,846          -2%     Residential                         348,149           304,168             14%
Commercial                         12,070,676      12,102,969             0%   Commercial                          106,907            91,702             17%
Industrial                           335,373         466,728          -28%     Industrial                              2,919            3,503           -17%
                                   52,028,014      52,877,543          -2%                                         457,975           399,373             15%
End User                                                                       End User
Transportation*                                                                Transportation*
                                   38,386,908      38,042,355             1%                                         30,499           31,389              -3%
TOTAL SALES                        90,414,922      90,919,898          -1%     TOTAL REVENUES                      488,474           430,762             13%
* includes choice customers                                                    * includes choice customers


                                                                  Weather
Cooling Degree Days                                                            Heating Degree Days
Detroit Edison service territory                                               MichCon service territory
                                   Q4 2004         Q4 2003                                                       Q4 2004           Q4 2003
                                                                  % Change                                                                         % Change

Actuals                               1               0             n/m        Actuals                             2,216            2,177             2%
Normal                                6               6             n/m        Normal*                             2,252            2,396            -6%


Deviation from normal               -83%             n/m                       Deviation from normal                -2%              -9%

                                                                               * 2004 data based on 10-year average, 2003 data based on 30 year average


                                                                                                                                                   Page 10
Sales Analysis - 2004
          Electric Sales - Detroit Edison Service Area                             Electric Revenue - Detroit Edison Service Area
                             (GWh)                                                                     ($000s)

                                     2004         2003                                                            2004               2003
                                                                 % Change                                                                           % Change

Residential                            15,082        15,074              0%   Residential                        1,344,761          1,350,882                 0%
Commercial                             13,425        15,942         -16%      Commercial                         1,122,902          1,308,501            -14%
Industrial                             11,472        12,254           -6%     Industrial                           557,098            633,551            -12%
Other                                    2,598           2,643        -2%     Other                                116,793            115,975                 1%
TOTAL SYSTEM                           42,577        45,913          -7%      TOTAL SYSTEM                       3,141,554          3,408,909             -8%
                                        6,372         3,359          90%                                           244,206            134,352             82%
Interconnection                                                               Interconnection
                                         9,840           7,281       35%                                           173,734              35,443           390% **
Choice*                                                                       Choice*
TOTAL SALES                            58,789        56,553              4%   TOTAL REVENUES                     3,559,494          3,578,704              -1%


* Includes Dearborn Industrial Group sales                                    * Distribution charge includes Dearborn Industrial Group revenues

                                                                              ** Reflects impact of interim rate order eliminating Choice transition credit &
                                                                                 implementing transition charges


Gas Sales - MichCon Service Area (Mcf)                                        Gas Revenue - MichCon Service Area ($000s)

                                     2004         2003                                                            2004               2003
                                                                 % Change                                                                           % Change

Residential                        127,225,642   134,401,892          -5%     Residential                        1,028,514            939,980                 9%
Commercial                          40,748,332    41,135,858          -1%     Commercial                           327,245            289,521             13%
Industrial                           1,337,622     1,526,112        -12%      Industrial                             10,592             10,547                0%
                                   169,311,596   177,063,862          -4%                                        1,366,351          1,240,048             10%
End User                                                                      End User
                                   144,867,269   151,089,646          -4%                                          118,770            135,438            -12%
Transportation*                                                               Transportation*
TOTAL SALES                        314,178,865   328,153,508          -4%     TOTAL REVENUES                     1,485,121          1,375,486                 8%
* includes choice customers                                                   * includes choice customers


                                                                 Weather
Cooling Degree Days                                                           Heating Degree Days
Detroit Edison service territory                                              MichCon service territory
                                     2004         2003                                                            2004               2003
                                                                 % Change                                                                          % Change

Actuals                               642          662             -3%        Actuals                             6,474              6,802             -5%
Normal                                736          736             n/m        Normal*                             6,469              6,850             -6%


                                     -13%          -10%                                                            0%                 -1%
Deviation from normal                                                         Deviation from normal

                                                                              * 2004 data based on 10-year average, 2003 data based on 30 year average


                                                                                                                                                    Page 11

More Related Content

Viewers also liked

yrc worldwide2Q07_Release
yrc worldwide2Q07_Releaseyrc worldwide2Q07_Release
yrc worldwide2Q07_Releasefinance41
 
yrc worldwide1q04_stats
yrc worldwide1q04_statsyrc worldwide1q04_stats
yrc worldwide1q04_statsfinance41
 
starbucks 102640_financials2
starbucks  102640_financials2starbucks  102640_financials2
starbucks 102640_financials2finance41
 
pepco FallEEIl
pepco FallEEIlpepco FallEEIl
pepco FallEEIlfinance41
 
starbucks ar02_financials
starbucks  ar02_financialsstarbucks  ar02_financials
starbucks ar02_financialsfinance41
 
pepco POMFallEEI2007
pepco POMFallEEI2007pepco POMFallEEI2007
pepco POMFallEEI2007finance41
 
pepco Berenson0306
pepco Berenson0306pepco Berenson0306
pepco Berenson0306finance41
 
starbucks ar01_financials
starbucks  ar01_financialsstarbucks  ar01_financials
starbucks ar01_financialsfinance41
 
starbucks Annual_Report_2004_part2
starbucks  Annual_Report_2004_part2starbucks  Annual_Report_2004_part2
starbucks Annual_Report_2004_part2finance41
 

Viewers also liked (12)

yrc worldwide2Q07_Release
yrc worldwide2Q07_Releaseyrc worldwide2Q07_Release
yrc worldwide2Q07_Release
 
yrc worldwide1q04_stats
yrc worldwide1q04_statsyrc worldwide1q04_stats
yrc worldwide1q04_stats
 
starbucks 102640_financials2
starbucks  102640_financials2starbucks  102640_financials2
starbucks 102640_financials2
 
pepco FallEEIl
pepco FallEEIlpepco FallEEIl
pepco FallEEIl
 
starbucks ar02_financials
starbucks  ar02_financialsstarbucks  ar02_financials
starbucks ar02_financials
 
dtefin1
dtefin1dtefin1
dtefin1
 
dte_1q1999
dte_1q1999dte_1q1999
dte_1q1999
 
pepco POMFallEEI2007
pepco POMFallEEI2007pepco POMFallEEI2007
pepco POMFallEEI2007
 
pepco Berenson0306
pepco Berenson0306pepco Berenson0306
pepco Berenson0306
 
dte_040730
dte_040730dte_040730
dte_040730
 
starbucks ar01_financials
starbucks  ar01_financialsstarbucks  ar01_financials
starbucks ar01_financials
 
starbucks Annual_Report_2004_part2
starbucks  Annual_Report_2004_part2starbucks  Annual_Report_2004_part2
starbucks Annual_Report_2004_part2
 

Similar to dte_q404irpack

smurfit stone container 2006_AR
smurfit stone container  2006_ARsmurfit stone container  2006_AR
smurfit stone container 2006_ARfinance30
 
smurfit stone container 2006_AR
smurfit stone container  2006_ARsmurfit stone container  2006_AR
smurfit stone container 2006_ARfinance30
 
Design power plant
Design power plantDesign power plant
Design power plantvidhanajmera
 
แผนการสอน เรื่อง เซลล์
แผนการสอน เรื่อง เซลล์แผนการสอน เรื่อง เซลล์
แผนการสอน เรื่อง เซลล์Nutt Yang
 
แผนการสอน เรื่อง เซลล์
แผนการสอน เรื่อง เซลล์แผนการสอน เรื่อง เซลล์
แผนการสอน เรื่อง เซลล์Nutt Yang
 
Roland Berger PPT Sample
Roland Berger PPT SampleRoland Berger PPT Sample
Roland Berger PPT Samplehaigou
 
smurfit stone container 2004_AR
smurfit stone container  2004_ARsmurfit stone container  2004_AR
smurfit stone container 2004_ARfinance30
 
smurfit stone container 2004_AR
smurfit stone container  2004_ARsmurfit stone container  2004_AR
smurfit stone container 2004_ARfinance30
 
Smart city engineering work using Internet of Things
Smart city engineering  work using Internet of ThingsSmart city engineering  work using Internet of Things
Smart city engineering work using Internet of ThingsPraveenHegde20
 
DTE_4Q05supplemental
DTE_4Q05supplementalDTE_4Q05supplemental
DTE_4Q05supplementalfinance41
 
DTE_4Q05supplemental
DTE_4Q05supplementalDTE_4Q05supplemental
DTE_4Q05supplementalfinance41
 
Lcd samsung gnb23 mla gnb26mla_gnb32mla_gnb40mla_=_ln263r71bax__ln263r71wax__...
Lcd samsung gnb23 mla gnb26mla_gnb32mla_gnb40mla_=_ln263r71bax__ln263r71wax__...Lcd samsung gnb23 mla gnb26mla_gnb32mla_gnb40mla_=_ln263r71bax__ln263r71wax__...
Lcd samsung gnb23 mla gnb26mla_gnb32mla_gnb40mla_=_ln263r71bax__ln263r71wax__...BatistaBR
 
App Credit Card Top Up
App Credit Card Top UpApp Credit Card Top Up
App Credit Card Top Upguest9a5535
 
Motorola ws2000 wireless switch cli reference guide
Motorola ws2000 wireless switch cli reference guideMotorola ws2000 wireless switch cli reference guide
Motorola ws2000 wireless switch cli reference guideAdvantec Distribution
 
Motorola ws2000 wireless switch cli reference guide
Motorola ws2000 wireless switch cli reference guideMotorola ws2000 wireless switch cli reference guide
Motorola ws2000 wireless switch cli reference guideAdvantec Distribution
 

Similar to dte_q404irpack (20)

dte_Q12005b
dte_Q12005bdte_Q12005b
dte_Q12005b
 
smurfit stone container 2006_AR
smurfit stone container  2006_ARsmurfit stone container  2006_AR
smurfit stone container 2006_AR
 
smurfit stone container 2006_AR
smurfit stone container  2006_ARsmurfit stone container  2006_AR
smurfit stone container 2006_AR
 
Power generation
Power generationPower generation
Power generation
 
Design power plant
Design power plantDesign power plant
Design power plant
 
แผนการสอน เรื่อง เซลล์
แผนการสอน เรื่อง เซลล์แผนการสอน เรื่อง เซลล์
แผนการสอน เรื่อง เซลล์
 
แผนการสอน เรื่อง เซลล์
แผนการสอน เรื่อง เซลล์แผนการสอน เรื่อง เซลล์
แผนการสอน เรื่อง เซลล์
 
FW:
FW:FW:
FW:
 
Roland Berger PPT Sample
Roland Berger PPT SampleRoland Berger PPT Sample
Roland Berger PPT Sample
 
smurfit stone container 2004_AR
smurfit stone container  2004_ARsmurfit stone container  2004_AR
smurfit stone container 2004_AR
 
smurfit stone container 2004_AR
smurfit stone container  2004_ARsmurfit stone container  2004_AR
smurfit stone container 2004_AR
 
dte_041104
dte_041104dte_041104
dte_041104
 
Smart city engineering work using Internet of Things
Smart city engineering  work using Internet of ThingsSmart city engineering  work using Internet of Things
Smart city engineering work using Internet of Things
 
DTE_4Q05supplemental
DTE_4Q05supplementalDTE_4Q05supplemental
DTE_4Q05supplemental
 
DTE_4Q05supplemental
DTE_4Q05supplementalDTE_4Q05supplemental
DTE_4Q05supplemental
 
Storage Virtualization for Efficient Operations
Storage Virtualization for Efficient OperationsStorage Virtualization for Efficient Operations
Storage Virtualization for Efficient Operations
 
Lcd samsung gnb23 mla gnb26mla_gnb32mla_gnb40mla_=_ln263r71bax__ln263r71wax__...
Lcd samsung gnb23 mla gnb26mla_gnb32mla_gnb40mla_=_ln263r71bax__ln263r71wax__...Lcd samsung gnb23 mla gnb26mla_gnb32mla_gnb40mla_=_ln263r71bax__ln263r71wax__...
Lcd samsung gnb23 mla gnb26mla_gnb32mla_gnb40mla_=_ln263r71bax__ln263r71wax__...
 
App Credit Card Top Up
App Credit Card Top UpApp Credit Card Top Up
App Credit Card Top Up
 
Motorola ws2000 wireless switch cli reference guide
Motorola ws2000 wireless switch cli reference guideMotorola ws2000 wireless switch cli reference guide
Motorola ws2000 wireless switch cli reference guide
 
Motorola ws2000 wireless switch cli reference guide
Motorola ws2000 wireless switch cli reference guideMotorola ws2000 wireless switch cli reference guide
Motorola ws2000 wireless switch cli reference guide
 

More from finance41

pepco POMSlides
pepco POMSlidespepco POMSlides
pepco POMSlidesfinance41
 
pepco EdwardJones0306
pepco EdwardJones0306pepco EdwardJones0306
pepco EdwardJones0306finance41
 
pepco 2006JulyInvestorMeetings
pepco 2006JulyInvestorMeetingspepco 2006JulyInvestorMeetings
pepco 2006JulyInvestorMeetingsfinance41
 
pepco Presentation081706
pepco Presentation081706pepco Presentation081706
pepco Presentation081706finance41
 
pepco WSUG107
pepco WSUG107pepco WSUG107
pepco WSUG107finance41
 
pepco AugustInvestorMeetings2007Final
pepco AugustInvestorMeetings2007Finalpepco AugustInvestorMeetings2007Final
pepco AugustInvestorMeetings2007Finalfinance41
 
pepco MerillLynchPower&GasConferenceSept2007(final)
pepco MerillLynchPower&GasConferenceSept2007(final)pepco MerillLynchPower&GasConferenceSept2007(final)
pepco MerillLynchPower&GasConferenceSept2007(final)finance41
 
pepco WallStBerensonFINAL
pepco WallStBerensonFINALpepco WallStBerensonFINAL
pepco WallStBerensonFINALfinance41
 
pepco POMAGAPresentation(final)
pepco POMAGAPresentation(final)pepco POMAGAPresentation(final)
pepco POMAGAPresentation(final)finance41
 
PHI_ProxyAnnual_Report2002
PHI_ProxyAnnual_Report2002PHI_ProxyAnnual_Report2002
PHI_ProxyAnnual_Report2002finance41
 
PHI_ProxyAnnual_Report2002
PHI_ProxyAnnual_Report2002PHI_ProxyAnnual_Report2002
PHI_ProxyAnnual_Report2002finance41
 
PHI_ProxyAnnual_Report2004
PHI_ProxyAnnual_Report2004PHI_ProxyAnnual_Report2004
PHI_ProxyAnnual_Report2004finance41
 
PHI_ProxyAnnual_Report2003
PHI_ProxyAnnual_Report2003PHI_ProxyAnnual_Report2003
PHI_ProxyAnnual_Report2003finance41
 
PHI_ProxyAnnual_Report2004
PHI_ProxyAnnual_Report2004PHI_ProxyAnnual_Report2004
PHI_ProxyAnnual_Report2004finance41
 
phi proxystatement2005report
phi proxystatement2005reportphi proxystatement2005report
phi proxystatement2005reportfinance41
 
phi proxystatement2005report
phi proxystatement2005reportphi proxystatement2005report
phi proxystatement2005reportfinance41
 
starbucks Board_Committee_List
starbucks   Board_Committee_Liststarbucks   Board_Committee_List
starbucks Board_Committee_Listfinance41
 

More from finance41 (20)

pepco POMSlides
pepco POMSlidespepco POMSlides
pepco POMSlides
 
pepco EdwardJones0306
pepco EdwardJones0306pepco EdwardJones0306
pepco EdwardJones0306
 
pepco 2006JulyInvestorMeetings
pepco 2006JulyInvestorMeetingspepco 2006JulyInvestorMeetings
pepco 2006JulyInvestorMeetings
 
pepco Presentation081706
pepco Presentation081706pepco Presentation081706
pepco Presentation081706
 
pepco WSUG107
pepco WSUG107pepco WSUG107
pepco WSUG107
 
pepco AugustInvestorMeetings2007Final
pepco AugustInvestorMeetings2007Finalpepco AugustInvestorMeetings2007Final
pepco AugustInvestorMeetings2007Final
 
pepco MerillLynchPower&GasConferenceSept2007(final)
pepco MerillLynchPower&GasConferenceSept2007(final)pepco MerillLynchPower&GasConferenceSept2007(final)
pepco MerillLynchPower&GasConferenceSept2007(final)
 
pepco WallStBerensonFINAL
pepco WallStBerensonFINALpepco WallStBerensonFINAL
pepco WallStBerensonFINAL
 
pepco POM2
pepco POM2pepco POM2
pepco POM2
 
pepco POMAGAPresentation(final)
pepco POMAGAPresentation(final)pepco POMAGAPresentation(final)
pepco POMAGAPresentation(final)
 
PHI_ProxyAnnual_Report2002
PHI_ProxyAnnual_Report2002PHI_ProxyAnnual_Report2002
PHI_ProxyAnnual_Report2002
 
PHI_ProxyAnnual_Report2002
PHI_ProxyAnnual_Report2002PHI_ProxyAnnual_Report2002
PHI_ProxyAnnual_Report2002
 
PHI_ProxyAnnual_Report2004
PHI_ProxyAnnual_Report2004PHI_ProxyAnnual_Report2004
PHI_ProxyAnnual_Report2004
 
PHI_ProxyAnnual_Report2003
PHI_ProxyAnnual_Report2003PHI_ProxyAnnual_Report2003
PHI_ProxyAnnual_Report2003
 
PHI_ProxyAnnual_Report2004
PHI_ProxyAnnual_Report2004PHI_ProxyAnnual_Report2004
PHI_ProxyAnnual_Report2004
 
phi proxystatement2005report
phi proxystatement2005reportphi proxystatement2005report
phi proxystatement2005report
 
phi proxystatement2005report
phi proxystatement2005reportphi proxystatement2005report
phi proxystatement2005report
 
phi AR07
phi AR07phi AR07
phi AR07
 
phi AR07
phi AR07phi AR07
phi AR07
 
starbucks Board_Committee_List
starbucks   Board_Committee_Liststarbucks   Board_Committee_List
starbucks Board_Committee_List
 

Recently uploaded

Financial Preparation for Millennia.pptx
Financial Preparation for Millennia.pptxFinancial Preparation for Millennia.pptx
Financial Preparation for Millennia.pptxsimon978302
 
Introduction to Health Economics Dr. R. Kurinji Malar.pptx
Introduction to Health Economics Dr. R. Kurinji Malar.pptxIntroduction to Health Economics Dr. R. Kurinji Malar.pptx
Introduction to Health Economics Dr. R. Kurinji Malar.pptxDrRkurinjiMalarkurin
 
2024 Q1 Crypto Industry Report | CoinGecko
2024 Q1 Crypto Industry Report | CoinGecko2024 Q1 Crypto Industry Report | CoinGecko
2024 Q1 Crypto Industry Report | CoinGeckoCoinGecko
 
Liquidity Decisions in Financial management
Liquidity Decisions in Financial managementLiquidity Decisions in Financial management
Liquidity Decisions in Financial managementshrutisingh143670
 
Uae-NO1 Rohani Amil In Islamabad Amil Baba in Rawalpindi Kala Jadu Amil In Ra...
Uae-NO1 Rohani Amil In Islamabad Amil Baba in Rawalpindi Kala Jadu Amil In Ra...Uae-NO1 Rohani Amil In Islamabad Amil Baba in Rawalpindi Kala Jadu Amil In Ra...
Uae-NO1 Rohani Amil In Islamabad Amil Baba in Rawalpindi Kala Jadu Amil In Ra...Amil baba
 
Stock Market Brief Deck FOR 4/17 video.pdf
Stock Market Brief Deck FOR 4/17 video.pdfStock Market Brief Deck FOR 4/17 video.pdf
Stock Market Brief Deck FOR 4/17 video.pdfMichael Silva
 
《加拿大本地办假证-寻找办理Dalhousie毕业证和达尔豪斯大学毕业证书的中介代理》
《加拿大本地办假证-寻找办理Dalhousie毕业证和达尔豪斯大学毕业证书的中介代理》《加拿大本地办假证-寻找办理Dalhousie毕业证和达尔豪斯大学毕业证书的中介代理》
《加拿大本地办假证-寻找办理Dalhousie毕业证和达尔豪斯大学毕业证书的中介代理》rnrncn29
 
Gender and caste discrimination in india
Gender and caste discrimination in indiaGender and caste discrimination in india
Gender and caste discrimination in indiavandanasingh01072003
 
Kempen ' UK DB Endgame Paper Apr 24 final3.pdf
Kempen ' UK DB Endgame Paper Apr 24 final3.pdfKempen ' UK DB Endgame Paper Apr 24 final3.pdf
Kempen ' UK DB Endgame Paper Apr 24 final3.pdfHenry Tapper
 
Banking: Commercial and Central Banking.pptx
Banking: Commercial and Central Banking.pptxBanking: Commercial and Central Banking.pptx
Banking: Commercial and Central Banking.pptxANTHONYAKINYOSOYE1
 
Uae-NO1 Pakistani Amil Baba Real Amil baba In Pakistan Najoomi Baba in Pakist...
Uae-NO1 Pakistani Amil Baba Real Amil baba In Pakistan Najoomi Baba in Pakist...Uae-NO1 Pakistani Amil Baba Real Amil baba In Pakistan Najoomi Baba in Pakist...
Uae-NO1 Pakistani Amil Baba Real Amil baba In Pakistan Najoomi Baba in Pakist...Amil baba
 
cost of capital questions financial management
cost of capital questions financial managementcost of capital questions financial management
cost of capital questions financial managementtanmayarora23
 
Unveiling Business Expansion Trends in 2024
Unveiling Business Expansion Trends in 2024Unveiling Business Expansion Trends in 2024
Unveiling Business Expansion Trends in 2024Champak Jhagmag
 
Uae-NO1 Kala Jadu specialist Expert in Pakistan kala ilam specialist Expert i...
Uae-NO1 Kala Jadu specialist Expert in Pakistan kala ilam specialist Expert i...Uae-NO1 Kala Jadu specialist Expert in Pakistan kala ilam specialist Expert i...
Uae-NO1 Kala Jadu specialist Expert in Pakistan kala ilam specialist Expert i...Amil baba
 
Unveiling Poonawalla Fincorp’s Phenomenal Performance Under Abhay Bhutada’s L...
Unveiling Poonawalla Fincorp’s Phenomenal Performance Under Abhay Bhutada’s L...Unveiling Poonawalla Fincorp’s Phenomenal Performance Under Abhay Bhutada’s L...
Unveiling Poonawalla Fincorp’s Phenomenal Performance Under Abhay Bhutada’s L...beulahfernandes8
 
PMFBY , Pradhan Mantri Fasal bima yojna
PMFBY , Pradhan Mantri  Fasal bima yojnaPMFBY , Pradhan Mantri  Fasal bima yojna
PMFBY , Pradhan Mantri Fasal bima yojnaDharmendra Kumar
 
Market Morning Updates for 16th April 2024
Market Morning Updates for 16th April 2024Market Morning Updates for 16th April 2024
Market Morning Updates for 16th April 2024Devarsh Vakil
 
『澳洲文凭』买科廷大学毕业证书成绩单办理澳洲Curtin文凭学位证书
『澳洲文凭』买科廷大学毕业证书成绩单办理澳洲Curtin文凭学位证书『澳洲文凭』买科廷大学毕业证书成绩单办理澳洲Curtin文凭学位证书
『澳洲文凭』买科廷大学毕业证书成绩单办理澳洲Curtin文凭学位证书rnrncn29
 
2024-04-09 - Pension Playpen roundtable - slides.pptx
2024-04-09 - Pension Playpen roundtable - slides.pptx2024-04-09 - Pension Playpen roundtable - slides.pptx
2024-04-09 - Pension Playpen roundtable - slides.pptxHenry Tapper
 
Uae-NO1 Black Magic Specialist In Lahore Black magic In Pakistan Kala Ilam Ex...
Uae-NO1 Black Magic Specialist In Lahore Black magic In Pakistan Kala Ilam Ex...Uae-NO1 Black Magic Specialist In Lahore Black magic In Pakistan Kala Ilam Ex...
Uae-NO1 Black Magic Specialist In Lahore Black magic In Pakistan Kala Ilam Ex...Amil baba
 

Recently uploaded (20)

Financial Preparation for Millennia.pptx
Financial Preparation for Millennia.pptxFinancial Preparation for Millennia.pptx
Financial Preparation for Millennia.pptx
 
Introduction to Health Economics Dr. R. Kurinji Malar.pptx
Introduction to Health Economics Dr. R. Kurinji Malar.pptxIntroduction to Health Economics Dr. R. Kurinji Malar.pptx
Introduction to Health Economics Dr. R. Kurinji Malar.pptx
 
2024 Q1 Crypto Industry Report | CoinGecko
2024 Q1 Crypto Industry Report | CoinGecko2024 Q1 Crypto Industry Report | CoinGecko
2024 Q1 Crypto Industry Report | CoinGecko
 
Liquidity Decisions in Financial management
Liquidity Decisions in Financial managementLiquidity Decisions in Financial management
Liquidity Decisions in Financial management
 
Uae-NO1 Rohani Amil In Islamabad Amil Baba in Rawalpindi Kala Jadu Amil In Ra...
Uae-NO1 Rohani Amil In Islamabad Amil Baba in Rawalpindi Kala Jadu Amil In Ra...Uae-NO1 Rohani Amil In Islamabad Amil Baba in Rawalpindi Kala Jadu Amil In Ra...
Uae-NO1 Rohani Amil In Islamabad Amil Baba in Rawalpindi Kala Jadu Amil In Ra...
 
Stock Market Brief Deck FOR 4/17 video.pdf
Stock Market Brief Deck FOR 4/17 video.pdfStock Market Brief Deck FOR 4/17 video.pdf
Stock Market Brief Deck FOR 4/17 video.pdf
 
《加拿大本地办假证-寻找办理Dalhousie毕业证和达尔豪斯大学毕业证书的中介代理》
《加拿大本地办假证-寻找办理Dalhousie毕业证和达尔豪斯大学毕业证书的中介代理》《加拿大本地办假证-寻找办理Dalhousie毕业证和达尔豪斯大学毕业证书的中介代理》
《加拿大本地办假证-寻找办理Dalhousie毕业证和达尔豪斯大学毕业证书的中介代理》
 
Gender and caste discrimination in india
Gender and caste discrimination in indiaGender and caste discrimination in india
Gender and caste discrimination in india
 
Kempen ' UK DB Endgame Paper Apr 24 final3.pdf
Kempen ' UK DB Endgame Paper Apr 24 final3.pdfKempen ' UK DB Endgame Paper Apr 24 final3.pdf
Kempen ' UK DB Endgame Paper Apr 24 final3.pdf
 
Banking: Commercial and Central Banking.pptx
Banking: Commercial and Central Banking.pptxBanking: Commercial and Central Banking.pptx
Banking: Commercial and Central Banking.pptx
 
Uae-NO1 Pakistani Amil Baba Real Amil baba In Pakistan Najoomi Baba in Pakist...
Uae-NO1 Pakistani Amil Baba Real Amil baba In Pakistan Najoomi Baba in Pakist...Uae-NO1 Pakistani Amil Baba Real Amil baba In Pakistan Najoomi Baba in Pakist...
Uae-NO1 Pakistani Amil Baba Real Amil baba In Pakistan Najoomi Baba in Pakist...
 
cost of capital questions financial management
cost of capital questions financial managementcost of capital questions financial management
cost of capital questions financial management
 
Unveiling Business Expansion Trends in 2024
Unveiling Business Expansion Trends in 2024Unveiling Business Expansion Trends in 2024
Unveiling Business Expansion Trends in 2024
 
Uae-NO1 Kala Jadu specialist Expert in Pakistan kala ilam specialist Expert i...
Uae-NO1 Kala Jadu specialist Expert in Pakistan kala ilam specialist Expert i...Uae-NO1 Kala Jadu specialist Expert in Pakistan kala ilam specialist Expert i...
Uae-NO1 Kala Jadu specialist Expert in Pakistan kala ilam specialist Expert i...
 
Unveiling Poonawalla Fincorp’s Phenomenal Performance Under Abhay Bhutada’s L...
Unveiling Poonawalla Fincorp’s Phenomenal Performance Under Abhay Bhutada’s L...Unveiling Poonawalla Fincorp’s Phenomenal Performance Under Abhay Bhutada’s L...
Unveiling Poonawalla Fincorp’s Phenomenal Performance Under Abhay Bhutada’s L...
 
PMFBY , Pradhan Mantri Fasal bima yojna
PMFBY , Pradhan Mantri  Fasal bima yojnaPMFBY , Pradhan Mantri  Fasal bima yojna
PMFBY , Pradhan Mantri Fasal bima yojna
 
Market Morning Updates for 16th April 2024
Market Morning Updates for 16th April 2024Market Morning Updates for 16th April 2024
Market Morning Updates for 16th April 2024
 
『澳洲文凭』买科廷大学毕业证书成绩单办理澳洲Curtin文凭学位证书
『澳洲文凭』买科廷大学毕业证书成绩单办理澳洲Curtin文凭学位证书『澳洲文凭』买科廷大学毕业证书成绩单办理澳洲Curtin文凭学位证书
『澳洲文凭』买科廷大学毕业证书成绩单办理澳洲Curtin文凭学位证书
 
2024-04-09 - Pension Playpen roundtable - slides.pptx
2024-04-09 - Pension Playpen roundtable - slides.pptx2024-04-09 - Pension Playpen roundtable - slides.pptx
2024-04-09 - Pension Playpen roundtable - slides.pptx
 
Uae-NO1 Black Magic Specialist In Lahore Black magic In Pakistan Kala Ilam Ex...
Uae-NO1 Black Magic Specialist In Lahore Black magic In Pakistan Kala Ilam Ex...Uae-NO1 Black Magic Specialist In Lahore Black magic In Pakistan Kala Ilam Ex...
Uae-NO1 Black Magic Specialist In Lahore Black magic In Pakistan Kala Ilam Ex...
 

dte_q404irpack

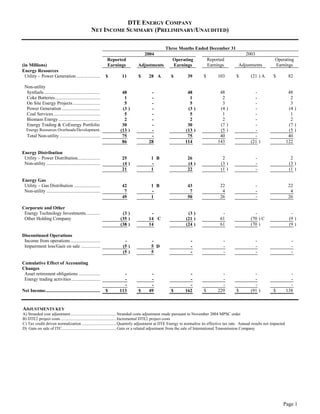
  • 1. DTE ENERGY COMPANY NET INCOME SUMMARY (PRELIMINARY/UNAUDITED) Three Months Ended December 31 2003 2004 Reported Operating Reported Operating Earnings Adjustments Earnings (in Millions) Earnings Adjustments Earnings Energy Resources Utility – Power Generation .................... $ 103 $ (21 ) A $ 82 $ 11 $ 28 A $ 39 Non-utility Synfuels ............................................... 48 - 48 48 - 48 Coke Batteries...................................... 2 - 2 1 - 1 On Site Energy Projects ....................... 3 - 3 5 - 5 Power Generation ................................ (4 ) - (4 ) (3 ) - (3 ) Coal Services ....................................... 1 - 1 5 - 5 Biomass Energy ................................... 2 - 2 2 - 2 Energy Trading & CoEnergy Portfolio (7 ) - (7 ) 30 - 30 Energy Resources Overheads/Development. (5 ) - (5 ) (13 ) - (13 ) Total Non-utility .................................. 40 - 40 75 - 75 143 (21 ) 122 86 28 114 Energy Distribution Utility – Power Distribution................... 2 - 2 25 1B 26 Non-utility ............................................. (3 ) - (3 ) (4 ) - (4 ) (1 ) - (1 ) 21 1 22 Energy Gas Utility – Gas Distribution ...................... 22 - 22 42 1B 43 Non-utility ............................................. 4 - 4 7 - 7 26 - 26 49 1 50 Corporate and Other Energy Technology Investments............ - - - (3 ) - (3 ) Other Holding Company 61 (70 ) C (9 ) (35 ) 14 C (21 ) 61 (70 ) (9 ) (38 ) 14 (24 ) Discontinued Operations Income from operations ......................... - - - - - - Impairment loss/Gain on sale ................ - - - (5 ) 5D - - - - (5 ) 5 - Cumulative Effect of Accounting Changes Asset retirement obligations .................. - - - - - - Energy trading activities ........................ - - - - - - - - - - - - $ 229 $ (91 ) $ 138 Net Income.............................................. $ 113 $ 49 $ 162 ADJUSTMENTS KEY A) Stranded cost adjustment............................................ Stranded costs adjustment made pursuant to November 2004 MPSC order B) DTE2 project costs ..................................................... Incremental DTE2 project costs C) Tax credit driven normalization ................................. Quarterly adjustment at DTE Energy to normalize its effective tax rate. Annual results not impacted D) Gain on sale of ITC.................................................... Gain or a related adjustment from the sale of International Transmission Company Page 1
  • 2. DTE ENERGY COMPANY NET INCOME SUMMARY (PRELIMINARY/UNAUDITED) Twelve Months Ended December 31 2003 2004 Reported Operating Reported Operating Earnings Adjustments Earnings (in Millions) Earnings Adjustments Earnings Energy Resources Utility – Power Generation .................... $ 235 $ (21 ) A $ 230 $ 62 $ 21 A $ 85 16 F 2B Non-utility Synfuels ............................................... 197 - 197 198 - 198 Coke Batteries...................................... (7 ) - (7 ) 9 - 9 On Site Energy Projects ....................... 9 - 9 23 - 23 Power Generation ................................ 4 - 4 (18 ) - (18 ) Coal Services ....................................... 8 - 8 12 - 12 Biomass Energy ................................... 6 - 6 5 - 5 Energy Trading & CoEnergy Portfolio 45 (16 ) G 29 92 (48 ) C 44 Energy Resources Overheads/Development. (20 ) - (20 ) (40 ) - (40 ) Total Non-utility .................................. 242 (16 ) 226 281 (48 ) 233 477 (21 ) 456 343 (25 ) 318 Energy Distribution Utility – Power Distribution................... 17 14 H 31 88 5B 93 Non-utility ............................................. (15 ) - (15 ) (19 ) - (19 ) 2 14 16 69 5 74 Energy Gas Utility – Gas Distribution ...................... 29 17 I 46 20 4B 24 Non-utility ............................................. 29 - 29 21 - 21 58 17 75 41 4 45 Corporate and Other Energy Technology Investments............ (9 ) - (9 ) 6 - 6 Other Holding Company (48 ) 10 J (38 ) (16 ) - (16 ) (57 ) 10 (47 ) (10 ) (10 ) Discontinued Operations Income from operations ......................... 5 (5 ) K - - - - Impairment loss/Gain on sale ................ - - - (7 ) 7D - 63 (63 ) E - (5 ) 5E - 68 (68 ) - (12 ) 12 - Cumulative Effect of Accounting Changes Asset retirement obligations .................. (11 ) 11 L - - - - Energy trading activities ........................ (16 ) 16 M - - - - (27 ) 27 - - - - $ 521 $ (21 ) $ 500 Net Income.............................................. $ 431 $ (4 ) $ 427 ADJUSTMENTS KEY A) Stranded cost adjustment............................................ Stranded costs adjustment made pursuant to November 2004 MPSC order B) DTE2 project costs ..................................................... Incremental DTE2 project costs C) Adjustment for contract termination / modification... Terminated a long-term gas exchange agreement and modified a related transportation agreement with a pipeline company D) Impairment loss / Discontinued operations................ Impairment charge relating to the expected loss on sale of Southern Missouri Gas Company E) Gain on sale of ITC..................................................... Gain or a related adjustment from the sale of International Transmission Company F) Blackout Costs……………………………………….Costs associated with the August 2003 Blackout G) Adjustment of EITF 98-10 accounting change .......... Flowback of the cumulative effect of a change in accounting principle from rescission of EITF Issue No. 98-10 H) Loss on sale of steam heating business ...................... Sold Detroit Edison steam heating business I) Disallowance of gas costs ........................................... Reserve for the potential disallowance of MichCon 2002 gas procurement costs J) Contribution to DTE Energy Foundation .................... Used a portion of International Transmission Company sale proceeds to fund the DTE Energy Foundation K) Adjustment for discontinued operations .................... Sold International Transmission Company L) Asset retirement obligations ....................................... Cumulative effect of a change in accounting principle from adoption of SFAS 143 M) Adjustment of EITF 98-10 accounting change ......... Cumulative effect of a change in accounting principle from rescission of EITF Issue No. 98-10 Page 2
  • 3. DTE ENERGY COMPANY AND SUBSIDIARY COMPANIES Earnings Variance Analysis (Preliminary/Unaudited) 2003 Reported Earnings per Share $3.09 (0.12) Stranded costs pursuant to Nov. 2004 MPSC order Costs associated with August 2003 blackout 0.10 Accounting change related to rescission of EITF 98-10 (0.10) Loss on sale of Detroit Edison steam heating business 0.08 Reserve for potential disallowance of MichCon 2002 gas costs 0.10 Contribution to DTE Energy Foundation 0.06 Discontinuted operations - International Transmission Company (ITC) (0.03) Gain or related adjustment from the sale of ITC (0.37) Cumulative effect of accounting change - SFAS 143 0.07 Cumulative effect of accounting change - rescission of EITF 98-10 0.09 2003 Operating Earnings per Share $2.97 Regulated Electric Weather (0.09) Choice Lost Margin (0.51) Net Rate Relief 0.14 Regulatory Deferrals 0.18 Pension/Health Care (0.16) Other (0.03) Regulated Gas Weather (0.06) Uncollectables (0.08) Interim rate relief 0.03 Pension/Health Care (0.03) Other 0.01 Non-Regulated Synfuels 0.01 Coke Batteries 0.09 On-Site Projects 0.08 Power Generation (0.14) Energy Trading & CoEnergy Portfolio 0.09 Energy Technology Investments 0.09 Overheads and other (0.14) Holding Company & Share Dilution 0.01 $2.46 2004 Operating Earnings per Share Stranded costs pursuant to Nov. 2004 MPSC order (0.12) Incremental DTE2 project costs (0.06) Terminated a long-term gas exchange agreement with a pipeline company 0.27 Impairment charge related to expected loss on sale of So. Missouri Gas Co. (0.04) Gain or related adjustment from the sale of ITC (0.02) 2004 Reported Earnings per Share $2.49 Page 3
  • 4. DTE ENERGY COMPANY CONSOLIDATED STATEMENT OF FINANCIAL POSITION (UNAUDITED) December 31 2003 2004 (in Millions) ASSETS Current Assets Cash and cash equivalents ................................................................................ $ 54 $ 56 Restricted cash ................................................................................................. 131 126 Accounts receivable Customer (less allowance for doubtful accounts of $129 and $99, respectively) 877 880 Accrued unbilled revenues ............................................................................. 316 378 Other............................................................................................................... 338 383 Inventories Fuel and gas.................................................................................................... 467 509 Materials and supplies .................................................................................... 162 159 Assets from risk management and trading activities ........................................ 186 296 Other................................................................................................................. 181 209 2,712 2,996 Investments Nuclear decommissioning trust funds .............................................................. 518 590 Other................................................................................................................. 601 558 1,119 1,148 Property Property, plant and equipment.......................................................................... 17,679 18,011 Less accumulated depreciation and depletion .................................................. (7,520 ) (7,355 ) 10,324 10,491 Other Assets Goodwill........................................................................................................... 2,067 2,067 Regulatory assets ............................................................................................. 2,063 2,119 Securitized regulatory assets ........................................................................... 1,527 1,438 Notes receivable ............................................................................................... 469 529 Assets from risk management and trading activities ........................................ 88 125 Prepaid pension assets ...................................................................................... 181 184 Other................................................................................................................. 203 200 6,598 6,662 $ 20,753 Total Assets ........................................................................................................ $ 21,297 Page 4
  • 5. DTE ENERGY COMPANY CONSOLIDATED STATEMENT OF FINANCIAL POSITION (UNAUDITED) December 31 2003 2004 (in Millions, Except Shares) LIABILITIES AND SHAREHOLDERS’ EQUITY Current Liabilities Accounts payable.............................................................................................. $ 625 $ 836 Accrued interest................................................................................................ 110 111 Dividends payable ............................................................................................ 87 90 Accrued payroll ................................................................................................ 51 33 Income taxes..................................................................................................... 185 16 Short-term borrowings...................................................................................... 370 403 Current portion long-term debt, including capital leases.................................. 477 692 Liabilities from risk management and trading activities................................... 326 369 Other................................................................................................................. 593 637 2,824 3,187 Other Liabilities Deferred income taxes ...................................................................................... 988 1,124 Regulatory liabilities ........................................................................................ 817 817 Asset retirement obligations ............................................................................ 866 916 Unamortized investment tax credit................................................................... 156 143 Liabilities from risk management and trading activities................................... 173 224 Liabilities from transportation and storage contracts ....................................... 495 387 Accrued pension liability.................................................................................. 345 265 Deferred gains from asset sales ........................................................................ 311 414 Minority interest ............................................................................................... 156 132 Nuclear decommissioning ............................................................................... 67 78 Other................................................................................................................. 599 634 4,973 5,134 Long-Term Debt (net of current portion) Mortgage bonds, notes and other...................................................................... 5,624 5,495 Securitization bonds ......................................................................................... 1,496 1,400 Equity-linked securities .................................................................................... 185 178 Trust preferred-linked securities....................................................................... 289 289 Capital lease obligations................................................................................... 75 66 7,669 7,428 Commitments and Contingencies Shareholders’ Equity Common stock, without par value, 400,000,000 shares authorized,174,209,034 and 168,606,522 shares issued and outstanding, respectively ......................................................................... 3,109 3,323 Retained earnings ............................................................................................. 2,308 2,383 Accumulated other comprehensive loss ........................................................... (130 ) (158 ) 5,287 5,548 $ 20,753 Total Liabilities and Shareholders’ Equity ..................................................... $ 21,297 Page 5
  • 6. DTE ENERGY COMPANY CONSOLIDATED STATEMENT OF CASH FLOWS (UNAUDITED) Year Ended December 31 2003 2004 (in Millions) Operating Activities Net income.......................................................................... $ 521 $ 431 Adjustments to reconcile net income to net cash from operating activities: Depreciation, depletion and amortization ......................... 691 744 Deferred income taxes ...................................................... (220 ) 129 Gain on sale of interests in synfuel projects ..................... (83 ) (219 ) Gain on sale of ITC and other assets, net ........................ (145 ) (17 ) Partners’ share of synfuel project losses........................... (78 ) (223 ) Contributions from synfuel partners................................. 65 141 Cumulative effect of accounting changes......................... 27 - Changes in assets and liabilities, exclusive of changes shown separately ............................................... 172 9 Net cash from operating activities ..................................... 950 995 Investing Activities Plant and equipment expenditures – utility ........................ (679 ) (815 ) Plant and equipment expenditures – non-utility ................. (72 ) (89 ) Investment in joint ventures .............................................. (34 ) (36 ) Proceeds from sale of interests in synfuel projects............. 89 221 Proceeds from sale of ITC and other assets........................ 669 104 Restricted cash for debt redemptions ................................. 106 5 Other investments............................................................... (69 ) (71 ) Net cash from (used for) investing activities .................... 10 (681 ) Financing Activities Issuance of long-term debt ................................................. 527 736 Redemption of long-term debt ........................................... (1,208 ) (759 ) Short-term borrowings, net ................................................ (44 ) 33 Issuance of common stock ................................................ 44 41 Dividends on common stock .............................................. (346 ) (354 ) Other .................................................................................. (12 ) (9 ) Net cash used for financing activities................................. (1,039 ) (312 ) (79 ) Net Increase (Decrease) in Cash and Cash Equivalents ... 2 133 Cash and Cash Equivalents at Beginning of Period ......... 54 $ 54 Cash and Cash Equivalents at End of Period.................... $ 56 Page 6
  • 7. THE DETROIT EDISON COMPANY CONSOLIDATED STATEMENT OF OPERATIONS (UNAUDITED) Year ended December 31 (in Millions) 2003 2004 $ 3,695 Operating Revenues............................................................................ $ 3,568 Operating Expenses Fuel and purchased power.................................................................. 939 885 Operation and maintenance................................................................ 1,332 1,395 Depreciation and amortization ........................................................... 473 523 Taxes other than income .................................................................... 257 249 Asset gains and losses, net ................................................................. 20 (1 ) 3,021 3,051 674 Operating Income .............................................................................. 517 Other (Income) and Deductions Interest expense.................................................................................. 284 280 Interest income................................................................................... (7 ) - Other, net ........................................................................................... - 23 277 303 397 Income Before Income Taxes ............................................................. 214 145 Income Tax Provision ......................................................................... 64 252 Income Before Accounting Change ................................................... 150 (6 ) Cumulative Effect of Accounting Change......................................... - 246 Reported Earnings ............................................................................. 150 Cumulative Effect of Accounting Changes Asset Retirement Obligations (FAS 143)………………………….. 6 - Unusual Items Stranded Cost adjustment.................................................................. (21 ) 21 DTE2 Capitalized costs..................................................................... - 7 August 2003 Blackout Costs............................................................. 16 - Loss on Sale of Steam Heating Business .......................................... 14 - Operating Earnings…………………………………………………. $ 261 $ 178 The Consolidated Statement of Operations (Unaudited) should be read in conjunction with the Notes to Consolidated Financial Statements appearing in the Annual Report to Shareholders, Form 10K and Form 10Q Page 7
  • 8. MICHIGAN CONSOLIDATED GAS COMPANY CONSOLIDATED STATEMENT OF OPERATIONS (UNAUDITED) Year ended December 31 (in Millions) 2003 2004 $ 1,492 Operating Revenues ............................................................................ $ 1,645 Operating Expenses Cost of gas .......................................................................................... 888 1,044 Operation and maintenance ................................................................ 349 387 Depreciation, depletion and amortization ........................................... 105 108 Taxes other than income ..................................................................... 52 48 Asset gains and losses, net.................................................................. 8 (2 ) 1,402 1,585 90 Operating Income ............................................................................... 60 Other (Income) and Deductions Interest expense .................................................................................. 57 57 Interest income ................................................................................... (10 ) (9 ) Other, net ............................................................................................ (11 ) (2 ) 36 46 54 Income Before Income Taxes.............................................................. 14 9 Income Tax Provision (Benefit) .......................................................... (8 ) 45 Reported Earnings............................................................................... 22 (6 ) Purchase Accounting and Other Adjustments .................................. (3 ) (17 ) - Disallowance of Gas Costs................................................................... - 4 DTE2 Capitalized Costs ...................................................................... $ 22 Operating Earnings ............................................................................ $ 23 The Consolidated Statement of Operations (Unaudited) should be read in conjunction with the Notes to Consolidated Financial Statements appearing in the Annual Report to Shareholders, Form 10K and Form 10Q Page 8
  • 9. DTE Energy Debt/Equity Calculation As of December 31, 2004 ($ millions) short-term borrowings 403 current portion LTD + cap leases 692 long-term debt 5,495 securitization bonds 1,400 capital leases 66 less QUIDS (385) less MichCon short-term debt (232) less securitization debt, including current portion (1,496) Total debt 5,943 Trust preferred 289 QUIDS 385 Mandatory convertible 178 Total preferred/ other 852 Equity 5,548 Total capitalization 12,343 Debt 48.2% Preferred stock 6.9% Common shareholders' equity 44.9% Total 100.0% Page 9
  • 10. Sales Analysis - Q4 Electric Revenue - Detroit Edison Service Area Electric Sales - Detroit Edison Service Area (GWh) ($000s) Q4 2004 Q4 2003 % Change Q4 2004 Q4 2003 % Change Residential 3,426 3,519 -3% Residential 305,966 314,120 -3% Commercial 3,328 3,691 -10% Commercial 281,008 305,971 -8% Industrial 3,054 2,990 2% Industrial 150,646 150,968 0% Other 648 667 -3% Other 27,871 27,947 0% 10,456 10,867 -4% 765,491 799,006 -4% Interconnection Interconnection 2,274 992 129% 84,797 30,814 175% Choice* Choice* 2,563 2,089 23% 48,734 10,439 367% ** TOTAL SALES 15,293 13,948 10% TOTAL REVENUES 899,022 840,259 7% * Includes Dearborn Industrial Group sales * Distribution charge includes Dearborn Industrial Group revenues ** Reflects impact of interim rate order eliminating Choice transition credit & implementing transition charges Gas Sales - MichCon Service Area (Mcf) Gas Revenue - MichCon Service Area ($000s) Q4 2004 Q4 2003 Q4 2004 Q4 2003 % Change % Change Residential 39,621,965 40,307,846 -2% Residential 348,149 304,168 14% Commercial 12,070,676 12,102,969 0% Commercial 106,907 91,702 17% Industrial 335,373 466,728 -28% Industrial 2,919 3,503 -17% 52,028,014 52,877,543 -2% 457,975 399,373 15% End User End User Transportation* Transportation* 38,386,908 38,042,355 1% 30,499 31,389 -3% TOTAL SALES 90,414,922 90,919,898 -1% TOTAL REVENUES 488,474 430,762 13% * includes choice customers * includes choice customers Weather Cooling Degree Days Heating Degree Days Detroit Edison service territory MichCon service territory Q4 2004 Q4 2003 Q4 2004 Q4 2003 % Change % Change Actuals 1 0 n/m Actuals 2,216 2,177 2% Normal 6 6 n/m Normal* 2,252 2,396 -6% Deviation from normal -83% n/m Deviation from normal -2% -9% * 2004 data based on 10-year average, 2003 data based on 30 year average Page 10
  • 11. Sales Analysis - 2004 Electric Sales - Detroit Edison Service Area Electric Revenue - Detroit Edison Service Area (GWh) ($000s) 2004 2003 2004 2003 % Change % Change Residential 15,082 15,074 0% Residential 1,344,761 1,350,882 0% Commercial 13,425 15,942 -16% Commercial 1,122,902 1,308,501 -14% Industrial 11,472 12,254 -6% Industrial 557,098 633,551 -12% Other 2,598 2,643 -2% Other 116,793 115,975 1% TOTAL SYSTEM 42,577 45,913 -7% TOTAL SYSTEM 3,141,554 3,408,909 -8% 6,372 3,359 90% 244,206 134,352 82% Interconnection Interconnection 9,840 7,281 35% 173,734 35,443 390% ** Choice* Choice* TOTAL SALES 58,789 56,553 4% TOTAL REVENUES 3,559,494 3,578,704 -1% * Includes Dearborn Industrial Group sales * Distribution charge includes Dearborn Industrial Group revenues ** Reflects impact of interim rate order eliminating Choice transition credit & implementing transition charges Gas Sales - MichCon Service Area (Mcf) Gas Revenue - MichCon Service Area ($000s) 2004 2003 2004 2003 % Change % Change Residential 127,225,642 134,401,892 -5% Residential 1,028,514 939,980 9% Commercial 40,748,332 41,135,858 -1% Commercial 327,245 289,521 13% Industrial 1,337,622 1,526,112 -12% Industrial 10,592 10,547 0% 169,311,596 177,063,862 -4% 1,366,351 1,240,048 10% End User End User 144,867,269 151,089,646 -4% 118,770 135,438 -12% Transportation* Transportation* TOTAL SALES 314,178,865 328,153,508 -4% TOTAL REVENUES 1,485,121 1,375,486 8% * includes choice customers * includes choice customers Weather Cooling Degree Days Heating Degree Days Detroit Edison service territory MichCon service territory 2004 2003 2004 2003 % Change % Change Actuals 642 662 -3% Actuals 6,474 6,802 -5% Normal 736 736 n/m Normal* 6,469 6,850 -6% -13% -10% 0% -1% Deviation from normal Deviation from normal * 2004 data based on 10-year average, 2003 data based on 30 year average Page 11