SlideShare a Scribd company logo
1 of 72
Download to read offline
HOST HOTELS & RESORTS       WARM AND GLITTERING, ARISTOCRATIC AND INVITING… THE WESTIN PALACE, MADRID, A LUXURY COLLECTION HOTEL, CAPTURES
                           THE ESSENCE OF THIS HISTORIC MEDITERRANEAN CITY. WHETHER YOU ARE SEARCHING FOR TURN-OF-THE-CENTURY GRANDEUR OR A
                          MODERN WORLD-CLASS HOTEL, YOU WILL QUICKLY DISCOVER WHY THE PALACE IS CONSISTENTLY CONSIDERED AS ONE OF EUROPE’S TOP
     2005 ANNUAL REPORT
                              HOTEL DESTINATIONS. WE EXPECT OUR EUROPEAN JOINT VENTURE TO ACQUIRE THIS HOTEL IN THE SECOND QUARTER OF 2006.
INTERNATIONAL                     BRANDS AND MARKETS


upon the expected completion of the acquisition of the starwood portfolio in the second quarter of 2006,
 we will have ownership interests in 137 premium-branded hotels, in nine countries and over 50 markets.


                                                                                                           [ABOVE] The centuries-old Westin Europa & Regina is an architectural landmark

                                                                                                           just steps from Piazza San Marco in Venice, Italy. Named to Conde Nast Traveler’s
                                                                                                           2005 Gold List, the hotel offers guests a combination of traditional elegance and
                                                                                                           modern technology, while providing the same magnificent views of the Grand
                                                                                                           Canal that once inspired Monet. We expect our European joint venture to acquire
                                                                                                           this hotel in the second quarter of 2006.


                                                                                                                  HOST HOTELS & RESORTS

                                                                                                           will be the premier hospitality real estate

                                                                                                           company. we will own high-quality lodging

                                                                                                           assets in prime urban, airport and resort /

                                                                                                           convention lo cations. creating value

                                                                                                           through aggressive asset management and

                                                                                                           disciplined capital allocation to generate

                                                                                                           superior performance, we will maximize
                                                                                                           shareholders’ returns through a combina-

                                                                                                           tion of dividends, growth in funds from

                                                                                                           operations and increases to net asset value

                                                                                                           per share.

            EXISTING MARKETS (AS OF DECEMBER 31, 2005)

            MARKETS ACQUIRED AS PART OF THE STARWOOD ACQUISITION

            EUROPEAN JOINT VENTURE MARKETS
F I NA N C I A L H IG H L IG H T S

                                                                                                                                                  2005                              2004                             2003
(unaudited, in millions, except per share data, hotel data, and stock price)


OPERATING DATA
      Revenues                                                                                                                                $ 3,881                           $ 3,574                            $3,223
      Operating profit                                                                                                                            519                               397                               290
      Net income (loss)                                                                                                                           166                                —                                 14

DILUTED INCOME (LOSS) PER COMMON SHARE
      Income (loss) from continuing operations                                                                                                $      .30                        $     (.34)                        $ (1.00)
      Diluted income (loss)(1)                                                                                                                $      .38                        $     (.12)                        $ (.07)
      Diluted weighted average shares outstanding                                                                                                  355.5                             337.3                          281.0

BALANCE SHEET DATA
      Total assets                                                                                                                            $ 8,245                           $ 8,421                            $8,592
      Debt(2)                                                                                                                                   5,370                             5,523                             5,486
      Convertible preferred securities(2)                                                                                                          —                                 —                                475
      Equity                                                                                                                                    2,417                             2,395                             2,136

OTHER DATA
      Adjusted EBITDA(1)                                                                                                                      $     918                         $     790                          $ 709


                                                                                                                                                                                                                                             host hotels & resorts 2005
      Funds from operations per diluted share(1)                                                                                                    1.15                               .77                            .99
      Stock price on December 31st                                                                                                                 18.95                             17.30                          12.32

COMPARABLE HOTEL DATA (3)
      Number of properties                                                                                                                         98                                98
      Number of rooms                                                                                                                          48,785                            48,785
                                                                                                                                                                                                                                                  1
      Average daily rate                                                                                                                      $166.80                           $154.96
      Occupancy percentage                                                                                                                     73.6%                             72.4%
      RevPAR(4)                                                                                                                               $122.82                           $112.21
(1) Certain transactions significantly affected Funds From Operations (FFO) per diluted share, Adjusted Earnings before Interest Expense, Income Taxes,
    Depreciation, Amortization and other items (Adjusted EBITDA) and income (loss) per share for all years presented. FFO per diluted share and Adjusted
    EBITDA are non-GAAP financial measures within the meaning of the rules of the Securities & Exchange Commission and, accordingly, these measures
    have been reconciled to comparable GAAP measures. For further discussion of FFO per diluted share, see Management’s Discussion and Analysis of
    Results of Operations and Financial Condition. For further discussion of Adjusted EBITDA, see our Form 8-K dated and filed February 23, 2006.
(2) Effective January 1, 2004, we adopted a revision to Financial Interpretation No. 46 “Consolidation of Variable Interest Entities” (FIN 46R). As a result,
    we deconsolidated a wholly owned limited purpose trust subsidiary (the “Trust”) and recorded the $492 million Convertible Subordinated Debentures
    issued by the Trust as debt and eliminated the $475 million of Convertible Preferred Securities that were previously classified in the mezzanine section
    of our consolidated balance sheet prior to January 1, 2004. For further discussion see Management’s Discussion and Analysis of Results of Operations
    and Financial Condition.
(3) We define our comparable hotels as full-service properties that are owned or leased by us and the operations of which are included in our consoli-
    dated results, whether as continuing operations or discontinued operations, for the entirety of the reporting periods being compared, and that have
    not sustained substantial property damage or undergone large-scale capital projects during the reporting periods being compared.
(4) Room revenue per available room (“RevPAR”) represents the combination of average daily room rate charged and the average daily occupancy achieved,
    and is a commonly used indicator of hotel performance. RevPAR does not include food and beverage or other ancillary revenues generated by the property.


                                                                                                 C ON T E N T S

To Our Stockholders . . . . . . . . . . . . . . . . . . . . . . . . . . . . . . . . . . . . . . . . . . . . . . . 2     Reports of Independent Registered Public Accounting Firm on
                                                                                                                           Internal Control Over Financial Reporting and Management’s
Board of Directors and Management Team . . . . . . . . . . . . . . . . . . . . . . . . . . . . 20                          Assessment and on the Consolidated Financial Statements . . . . . . . . . . . . 70
Management’s Discussion and Analysis of Results of
                                                                                                                        Management Certifications . . . . . . . . . . . . . . . . . . . . . . . . . . . . . . . . . . . . . . . . . 71
  Operations and Financial Condition . . . . . . . . . . . . . . . . . . . . . . . . . . . . . . 21
                                                                                                                        Selected Financial Data . . . . . . . . . . . . . . . . . . . . . . . . . . . . . . . . . . . . . . . . . . . . 71
Forward-Looking Statements . . . . . . . . . . . . . . . . . . . . . . . . . . . . . . . . . . . . . . . 47
                                                                                                                        Host Marriott Portfolio . . . . . . . . . . . . . . . . . . . . . . . . . . . . . . . . . . . . . . . . . . . . 72
Financial Statements . . . . . . . . . . . . . . . . . . . . . . . . . . . . . . . . . . . . . . . . . . . . . . . 48
                                                                                                                        Directors, Officers and Management Team . . . . . . . . . . . . . . . . Inside Back Cover
Management’s Report . . . . . . . . . . . . . . . . . . . . . . . . . . . . . . . . . . . . . . . . . . . . . . 69

Management’s Report on Internal Control Over Financial Reporting . . . . . . 69                                         Corporate Information . . . . . . . . . . . . . . . . . . . . . . . . . . . . . . . Inside Back Cover
TO OU R S TO C K HOL DE R S


                                                                                      We had an outstanding 2005, delivering significant
                                                                                      increases in operating results, earnings and dividends
                                                                                      and executing on strategic initiatives that will help distin-
                                                                                      guish our company as a global player in the lodging
                                                                                      industry. Throughout the year we maintained our stra-
                                                                                      tegic focus, aggressively managing our existing portfolio
host hotels & resorts 2005


                                                                                      and practicing a systematic and disciplined approach to
                                                                                      capital allocation. Our focus and the continued improve-
                                                                                      ment of lodging fundamentals have enhanced our lodg-
                                                                                      ing portfolio and strengthened our financial position for
                                                                                      the future. Some of the more significant recent accom-
                                            CHRISTOPHER J. NASSETTA                   plishments include:
     2
                                        President and Chief Executive Officer

                                                                                      ◆   Our operating results improved significantly over
                                              RICHARD E. MARRIOTT
                                              Chairman of the Board
                                                                                          2004 in nearly every measure of performance. The
                                 RevPAR increase of 9.5% in 2005 was the highest full-year improvement since 1998, helping to drive signifi-
                                 cant increases in operating margins and cash flow;

                             ◆   On November 14, 2005, we entered an agreement to acquire an outstanding portfolio of hotels from Starwood
                                 Hotels & Resorts Worldwide, Inc. On April 10, 2006, we completed the purchase of 28 of the properties and
                                 expect to close on the remaining seven properties by the end of the second quarter. This $3.8 billion acquisi-
                                 tion delivers on all of our qualitative and quantitative acquisition parameters and forges a new partnership
                                 with one of the most innovative brand and management companies in the lodging industry;

                             ◆   We formed a joint venture on March 24, 2006 to own the Starwood hotels in Spain, Italy, Poland and the
                                 United Kingdom and to serve as a platform for further European expansion, as well as provide approximately
                                 $560 million of financing for the acquisition of the European hotels from Starwood;

                             ◆   On September 30, 2005, we purchased the 834-room Hyatt Regency Washington on Capitol Hill for $274 mil-
                                 lion, the seventh Hyatt-managed property in our portfolio;

                             ◆   We have pursued opportunities to unlock the inherent real estate value in our portfolio where it exceeds the
                                 value of the properties as hotels, such as in the sales in 2006 of the Fort Lauderdale Marina Marriott and the
                                 Swissôtel The Drake, New York for approximately $580 million;
◆   We have enhanced our existing portfolio through investment in repositioning and return on investment proj-
    ects spending over $100 million on these high yield projects in 2005;

◆   We continued to recycle capital out of assets that are not in keeping with our long-term strategic goals in
    2005, including the sale of five non-core assets and 85% of our interest in the Courtyard by Marriott joint
    venture for proceeds of over $240 million; and

◆   We continued to restructure our balance sheet in ways that have increased flexibility and, as a result, we are


                                                                                                                     host hotels & resorts 2005
    well on our way to achieving the strongest balance sheet in our history.


We believe these accomplishments exemplify the focused and disciplined approach to running our business that
has made us the nation’s premier owner of lodging real estate. Consistent with our expectations, 2005 marked
the second year of strong growth in what we expect to be a sustained recovery in the lodging industry. Our focus
                                                                                                                          3
on luxury and upper-upscale hotels has, over the long-term, provided superior returns to our stockholders
through appreciation in net asset value and growth in earnings and dividends. We believe that the combination
of continued strong demand growth and supply growth that remains at historically low levels, particularly in our
segments and markets, will sustain the current powerful recovery in the lodging industry and produce results that
are some of the best in our history. Based on these strong fundamentals, we believe we are at an attractive point
in the lodging cycle to grow our business both in North America and, with the help of our newly-formed joint
venture, Europe as well.


While we recently renamed the company Host Hotels & Resorts, Inc. to reflect the fundamental changes that we
have undergone over the past 12 years, our vision, mission, values and strategy remain unchanged. Our evolu-
tion from a domestic company with a single brand and an enterprise value of just over $3 billion to an emerging
international company with multiple world-renowned brands and an enterprise value of over $17 billion has
been dramatic. Yet, through it all, we have remained steadfast to our demanding best-in-class standards. These
steps, the positive lodging fundamentals, and our unmatched portfolio and strong capital structure should result
in meaningful growth in RevPAR, earnings and superior returns to our stockholders next year and beyond.


                      RICHARD E. MARRIOTT                              CHRISTOPHER J. NASSETTA
                       Chairman of the Board                       President and Chief Executive Officer


APRIL 10, 2006
UNWAVERING                             S T R AT EG IC FO C U S


                                                                                                    Our success over the past 12 years is a direct reflection of
                                                                                                    our clear and unwavering strategic focus, which is to pro-
                                                                                                    vide superior total returns to our stockholders through
                                                                                                    appreciation in asset values and growth in earnings and
                                                                                                    dividends. To achieve these goals, we have carefully exe-
                                                                                                    cuted on a focused and disciplined long-term strategic
                                                                                                    plan to acquire high-quality lodging assets in prime
                                                                                                    urban and resort destinations that have the potential for
                                                                                                    significant capital appreciation. We then work to enhance
                                                                                                    the value of the portfolio by working with our operators
host hotels & resorts 2005


                                                                                                    to aggressively manage our hotels to increase revenues
                                                                                                    and minimize operating costs, while pursuing selective
                                                                                                    capital improvements designed to increase profitability.


                             The building blocks of this strategic vision have been the prudent stewardship of our capital structure.
                             Management has made every effort to maintain the appropriate balance of debt and equity, while providing the
     4
                             company with sufficient flexibility to be able to react to market forces. During 2005, our commitment to a strong
                             capital structure permitted us to move forward on several of our strategic initiatives; including the purchase of
                             the Hyatt Regency Washington on Capitol Hill, an aggressive capital investment program in our existing port-
                             folio and most significantly, the acquisition of the Starwood portfolio.


                             Our success in restructuring our balance sheet over the past several years has resulted in reduced overall lever-
                             age, expanded financial flexibility and improved interest coverage ratios. Including the first quarter of 2006 con-
                             version of our Convertible Subordinated Debentures into common shares and other financing activities since the
                             beginning of 2003 through 2005, our debt balance has decreased over $1 billion and our annual interest pay-
                             ments have decreased over $100 million. We will continue to pursue future opportunities to reduce leverage or
                             improve coverages by the selective recycling of capital and the repayment or refinancing of debt when rates are
                             favorable. The correct capital structure also means having ample liquidity. Our near-term liquidity, including
                             available cash and $575 million of capacity under our credit facility, is strong and more than sufficient to con-
                             tinue to invest in our existing portfolio, as well as take advantage of acquisition opportunities that meet our
                             investment criteria.


                                [ABOVE] The spectacular twin towers of the 1,356-room San Diego Marriott Hotel & Marina are adjacent to the Convention Center and Seaport

                             Village in the heart of downtown San Diego and is within comfortable walking distance of the Gaslamp District, Farmers market and other popular
                                        attractions. The hotel features over 100,000 square feet of meeting space as well as a 446-slip marina, one of California’s largest.

                                   [RIGHT] Casting its dramatic reflection onto the bay, the Tampa Marriott Waterside is a major factor in the successful redevelopment of the

                               city’s Channel District. Connected directly to the 353,000 square foot Tampa Convention Center and close to Ybor City, the historic and vibrant
                                                       Latin district, this property significantly enhances Tampa’s appeal as a major convention destination.
THE FAIRMONT KEA LANI MAUI, HAWAII’S ONLY ALL-SUITE RESORT, RESTS GRACEFULLY ON POLO BEACH, ON THE SUNNY SOUTHWEST
SHORES OF MAUI. THE NAME KEA LANI MEANS “HEAVENLY WHITE,” WHICH APPROPRIATELY DESCRIBES THE GLEAMING WHITE EXTERIOR
OF THIS LAVISH RESORT. THIS TROPICAL PARADISE RESORT OFFERS A MYRIAD OF ISLAND ACTIVITIES, INCLUDING WINDSURFING OFF THE
                        BEACH, RELAXING AT THE SPA OR AN INTIMATE DINNER ON YOUR PRIVATE LANAI.
SUPERIOR      A S S E T M A NAG E M E N T


                                                                                                          Growth in revenues and profits is not guaranteed, it is
                                                                                                          earned. Future increases in revenues and operating profits
                                                                                                          at our hotels will result from our aggressive approach to
                                                                                                          asset management. As the largest owner of luxury and
                                                                                                          upper-upscale properties, our asset management team
                                                                                                          benefits from the diversity of premium brands and the
                                                                                                          size and composition of our portfolio. Our broad per-
                                                                                                          spective provides us with a unique ability to benchmark
                                                                                                          similar hotels and identify best practices, value enhance-
                                                                                                          ment opportunities and efficiencies that can be commu-
host hotels & resorts 2005


                                                                                                          nicated to our managers. We work closely with our
                                                                                                          managers to implement these strategies, which result in
                                                                                                          enhanced revenue management, reduced operating costs
                                  and other operating synergies, all of which will improve the long-term profitability and value of our portfolio. In
                                  this regard, the Starwood portfolio presents an exciting opportunity as these hotels have never benefited from the
                                  oversight of a third-party asset manager. We already have identified key opportunities and developed a strategic
     8
                                  plan for each property to uncover ways revenues can be enhanced, costs reduced and margins improved.


                                  We have seen a marked improvement in demand in all segments of our business, which has provided our oper-
                                  ators the ability to increase room rates while also increasing the mix of business represented by higher-rated
                                  segments. We also experienced strong margin improvement in 2005, as the growth in RevPAR was primarily
                                  driven by significant increases in room rates, as well as improvements in food and beverage sales. Controlling
                                  operating costs is always a key priority. We work closely with our operators to reduce costs and generate savings
                                  in ways that do not impact the quality of our hotels or guest satisfaction, which has resulted in increases in oper-
                                  ating margins despite costs such as labor and utilities rising at a rate greater than inflation. As we continue to
                                  maximize the business mix at our hotels, we expect to see further improvements in our operating margins.


                                              Standing as a beacon in the thriving heart of Seattle, the W Seattle is a premier destination for the savvy traveler. The W Seattle’s
                                         [ABOVE]

                                         modern crown of a steel-and-mesh pyramid provides a magical glow 26 stories above the street reflecting this city’s architectural history
                                                                                            and unique northwestern style.

                                       [RIGHT] Explore all our Nation’s capital offers from this newly renovated luxury hotel in Washington, D.C. The Hyatt Regency Washington on

                             Capitol Hill places you close to government and business centers, museums, memorials and other attractions. Delight in all that this downtown Washington, D.C.
                                      hotel affords—from Grand Beds in all 834 spacious guestrooms and fine dining, to wireless Internet and 41,000 square feet of function space.
RESEMBLING A GRAND MEDITERRANEAN VILLA, THIS LUXURIOUS 463-ROOM HOTEL IS SET AMIDST
  20 BEACHFRONT ACRES ON FLORIDA’S SOUTHWEST COAST. THE RITZ-CARLTON, NAPLES HAS EARNED
BOTH MOBIL FIVE-STAR AND AAA FIVE-DIAMOND RECOGNITION AS ONE OF THE COUNTRY’S TOP RESORTS.
UNMATCHED         P OR T FOL IO DI V E R S I F IC AT ION


                                                                                                         Over the past 12 years, we have strategically assembled an
                                                                                                         unmatched portfolio of luxury and upper-upscale hotels.
                                                                                                         Our portfolio is geographically diverse within North
                                                                                                         America and is operated under some of the most recog-
                                                                                                         nized brand names in the hospitality industry. Our $3.8
                                                                                                         billion acquisition of the 35 hotels from Starwood, while
                                                                                                         vaulting us to one of the largest lodging companies in the
                                                                                                         world, is just another step in creating a truly diversified
                                                                                                         company both in terms of brand and global presence.
host hotels & resorts 2005


                                                                                                         Similar to our existing hotels, the Starwood portfolio is
                                                                                                         geographically diverse in domestic markets with strong
                                                                                                         growth prospects and limited near-term supply. The port-
                               folio also represents a unique opportunity to acquire high-quality international assets, particularly in Europe, which
                               we believe are in the early stages of lodging cycle and, therefore, we have an increased opportunity for additional
                               growth outside of our domestic markets. As part of the financing for the acquisition and to create a platform for
12
                               future acquisitions in Europe, we formed a joint venture to own the six hotels in Italy, Spain, Poland and the
                               United Kingdom in which we will have a 32% ownership interest. The acquisition also provides access to key
                               domestic markets such as Seattle and an expanded presence in other markets such as New York, Boston and San
                               Diego, which we believe have strong growth prospects.


                               Equally important is the continued brand diversification within our portfolio and expanding our relationship
                               with Starwood, one of the most innovative operating and brand companies in the lodging industry. Established
                               brand names such as Sheraton, Westin, W and St. Regis represent some of the industry’s highest-performing and
                               innovative luxury and upper-upscale brands and are a perfect complement to our existing portfolio of premium
                               brands. Together, the combined portfolio solidifies our position as the premier owner of luxury and upper-
                               upscale urban and resort properties operated under world-renowned brands.


                                       [ABOVE] The Westin Palace, Milan, a Luxury Collection Hotel, represents the perfect synthesis between style and technology. The hotel

                                     embraces a refined elegance, inspired by the classical Empire-style and features 228 luxurious guest rooms—including 10 suites, which are
                                                           endowed with a relaxant private Turkish bath—that will make your stay truly unforgettable.
                              [RIGHT] The Westin Palace, Madrid, a Luxury Collection Hotel, is a monument to elegance and turn-of-the-century grandeur. Commissioned by King Alfonso XIII

                             in 1912, it has been a favored meeting point in the Spanish capital ever since and is just minutes from the renowned El Prado and Thyssen-Bornemisza Museums.
                                                         We expect our European joint venture to acquire both of these hotels in the second quarter of 2006.
LOCATED ON HAWAII’S ROMANTIC AND MYSTICAL ISLAND OF MAUI, THE LUXURIOUS 806-ROOM HYATT REGENCY MAUI
RESORT AND SPA OVERLOOKS 1,800 FEET OF SPARKLING WHITE SAND BEACH. A UNIQUELY ISLAND EXPERIENCE WITH TROPICAL
  WATERFALLS AND BRILLIANT FOLIAGE, GUESTS CAN BE PAMPERED AT THE WORLD-CLASS SPA OR EXPERIENCE THE ENERGY
                         OF A HAWAIIAN LUAU, BUILDING MEMORIES THAT LAST A LIFETIME.
STR ATEGIC
                              C A P I TA L A L L O C AT ION A N D VA L U E E N H A N C E M E N T


                                                                                                  Our goal of strategically allocating capital to create long-
                                                                                                  term stockholder value through the ownership of luxury
                                                                                                  and upper-upscale properties that meet our demanding,
                                                                                                  best-in-class standards remains unchanged. The purchase
                                                                                                  of the Hyatt Regency Washington on Capitol Hill in
                                                                                                  Washington D.C., in October of 2005, is a recent example
                                                                                                  of this strategy. The hotel is located in the heart of the
                                                                                                  Nation’s capitol just a short walk from the seat of govern-
                                                                                                  ment and the National Mall, the classic example of an
                                                                                                  urban hotel in a difficult to duplicate location that meets
host hotels & resorts 2005


                                                                                                  our best-in-class standard.


                                                                                                  During 2005, we made significant progress on one of the
                             most ambitious capital expenditure plans in our history which included spending over $100 million on reposi-
                             tioning and return on investment (ROI) projects. These investments range in scope from the complete reposi-
                             tioning of guest rooms, restaurants and meeting space to the development of world-class spas and exhibit halls.
16
                             These projects provide some of our highest investment yields and ensure that our hotels are in superior physical
                             condition, highly competitive in the marketplace and meet our own high-quality standards. For example, in
                             December 2005, we completed the renovation and repositioning of the Newport Beach Marriott Hotel & Spa at
                             a cost of approximately $65 million, which included the addition of a spa, 20 new luxury suites, redesigned and
                             renovated guestrooms, a new restaurant concept and updated meeting space. We plan on investing approximately
                             $275 million in repositioning and ROI projects in 2006 as we accelerate our efforts to drive growth in cash flow.
                             We have already identified, and will continue to review, investment opportunities for the Starwood portfolio that
                             will increase cash flows and shareholder value.


                             Capital allocation also means realizing the substantial real estate value inherent in our portfolio, as well as unlocking
                             non-income producing assets such as at the Hyatt Regency Maui, where we are actively pursuing an opportunity to
                             develop timeshare units on a beachfront parking lot adjacent to our hotel to maximize the value of the real estate
                             and create shareholder value. Two recent asset sales, the Fort Lauderdale Marina Marriott and the Swissôtel The
                             Drake, New York, which resulted in combined gain of approximately $345 million, provided the purchasers with
                             additional development opportunities that far exceed the value of the properties as hotels. By executing on these
                             sales and redeploying the capital into the purchase of the Starwood portfolio, we believe we have created significant
                             value. In addition to these sales, we continue to dispose of non-core assets that are not in keeping with our long-
                             term strategic goals, or fail to meet our on-going investment criteria, provided we can obtain satisfactory pricing.


                                                       A sanctuary of quiet comfort, the Newport Beach Marriott Hotel & Spa is nestled overlooking
                                                 [ABOVE]

                                                 the Upper Back Bay. The recently renovated Lobby Bar, above, is just a small part of the $65 million
                                                                             renovation recently completed at this hotel.

                                                [RIGHT] One of the Nation’s great convention hotels, the Orlando World Center Marriott is a landmark

                                             property in central Florida. The 2,000-room hotel can satisfy even the most discerning travelers searching for
                                                     the best in accommodations and recreational options close to the major Orlando attractions.
THE NEWPORT BEACH MARRIOTT HOTEL & SPA OFFERS COASTAL LIVING WITH A
SLEEK, MODERN STYLE. RECENTLY RENOVATED, THE HOTEL FEATURES 532 GUESTROOMS,
 MORE THAN 40,000 SQUARE FEET OF EVENT SPACE AND THE ALL NEW PURE BLU SPA.
B OA R D OF DI R EC TOR S
host hotels & resorts 2005


                                                                         Terence C. Golden, Ann McLaughlin Korologos, John B. Morse, Jr.,
                                              [BACK ROW, LEFT TO RIGHT]

                                                                  Judith A. McHale, Christopher J. Nassetta, Richard E. Marriott, Robert M. Baylis
                                     [FRONT ROW, LEFT TO RIGHT]
20


                                                                  M A NAG E M E N T T E A M


                                                         Matthew L. Richardson, Pamela K. Wagoner, Larry K. Harvey, Gregory J. Larson, Jeffrey S. Clark
                             [BACK ROW, LEFT TO RIGHT]

                                                          James F. Risoleo, Elizabeth A. Abdoo, Christopher J. Nassetta, W. Edward Walter, Minaz Abji
                              [FRONT ROW, LEFT TO RIGHT]
M A NAG E M E N T ’S DI S C U S S ION A N D A NA LYS I S OF
                      R E S U LT S OF OP E R AT ION S A N D F I NA N C I A L C ON DI T ION


The following discussion should be read in conjunction with           Starwood Acquisition
the consolidated financial statements and related notes               On November 14, 2005, we announced that we had signed a
included elsewhere in this report. This discussion contains for-      definitive merger agreement as amended March 24, 2006 to
ward-looking statements about our business. These statements          acquire 35 luxury and upper-upscale hotels from Starwood for
are based on current expectations and assumptions that are            approximately $3.8 billion. The portfolio consists of 25 domes-
subject to risks and uncertainties. Actual results could differ       tic and 10 international properties and a total of 16,455 rooms
materially because of factors discussed in “Forward Looking           managed under the Westin®, Sheraton®, W Hotels®, The
Statements” and “Risk Factors” contained in this report.              Luxury Collection® and St. Regis® brands (collectively, the
                                                                      “Starwood Portfolio”). As part of the acquisition, we expect
RECENT EVENTS AS OF APRIL 7, 2006                                     to assume approximately $109 million of debt and to issue
Between December 2005 and February 10, 2006, we issued                approximately $2.3 billion of equity (133,529,412 common
30.8 million shares of Host common stock upon conversion              shares at the exchange price of $17.00 per share) to Starwood
of $473 million principal amount of our Convertible                   stockholders. The remainder of the purchase price will be paid
Subordinated Debentures and corresponding Convertible                 in cash. On April 5, 2006, our stockholders approved the
Preferred Securities. The securities were convertible at the          issuance of common stock for this transaction with over 99%
option of the holder into shares of Host common stock at the          of the votes cast in favor of the issuance. In connection with the
rate of 3.2537 shares per $50 liquidation amount of Convertible       completion of the Starwood acquisition, we intend to change
Preferred Security (equivalent to a conversion price of $15.367       our name to Host Hotels & Resorts, Inc. and to change the New
per share of the Company’s common stock). As of March 31,             York Stock Exchange symbol that our common stock is traded
2006, $2 million of subordinated debentures and corresponding         under to “HST.”


                                                                                                                                               host hotels & resorts 2005
preferred securities remain outstanding and the right to convert          We anticipate that the initial closing on all but seven inter-
those securities into Host common stock has expired. We               national properties will occur on or about April 10, 2006. The
intend to redeem these securities in the second quarter of 2006.      acquisition is subject to certain closing conditions and also sub-
     On January 10, 2006, we issued mortgage debt in the              ject to a number of terms and conditions that could delay or
amount of $135 million Canadian Dollars ($116 million US              prevent the closing of the acquisitions, or result in modifica-
Dollars based on the exchange rate on the date of issuance)           tions, such as the exclusion of particular hotels due to the fail-
with a fixed interest rate of 5.195%. The mortgage debt is            ure to obtain required consents or certain other developments.
secured by four of our Canadian properties and matures on                 The Starwood Portfolio is comprised of luxury and upper-             21

March 1, 2011. On January 13, 2006, a portion of the proceeds         upscale hotels located primarily in urban, convention or resort
were used to repay the $20 million outstanding balance under          destinations with an average size of approximately 500 rooms
our credit facility.                                                  including five city-center hotels with over 750 rooms. The portfo-
     On March 29, 2006, we issued $800 million of 6 3⁄4% Series P     lio is geographically diverse both domestically and internationally,
senior notes due 2016. We intend to utilize the proceeds to fund      with most assets located in markets with strong growth profiles
a portion of the Starwood acquisition, redeem $136 million of our     and limited near-term supply. The portfolio includes 10 interna-
7 7⁄8% Series B senior notes and for general corporate purposes.      tional properties, which will expand our geographic distribution
     In 2006, we sold five properties (the Swissôtel The Drake,       into new markets outside of the United States. Six hotels repre-
New York; the Fort Lauderdale Marina Marriott; the Albany             senting 15% of the portfolio (by revenue) are located in Europe.
Marriott; the Marriott at Research Triangle Park; and the             Additional hotels are located in Fiji and in Chile. As a result of the
Chicago Marriott Deerfield Suites) for total proceeds of              acquisition, our percentage of revenues from international hotels
approximately $700 million and a total estimated gain in excess       will increase from approximately 3% to approximately 4%. We
of $380 million. We expect to use the proceeds from the sales to      believe that many of these international markets are in the early
partially fund the acquisition of the Starwood Portfolio and for      stages of lodging recovery, offering the opportunity for additional
other corporate purposes.                                             growth outside of the domestic lodging cycle. In addition, we will
     We recently negotiated amendments to various management          increase our presence in key domestic markets such as New York,
agreements with Marriott International and agreed, among              Boston, San Diego and Seattle as a result of this acquisition.
other matters, to waive performance termination tests through             We are also expanding an important relationship with
the end of fiscal year 2009, to modify certain extension tests        Starwood, and thereby diversifying our brand representation.
which condition the manager’s ability to renew the management         The portfolio consists of 17 Sheraton®, 13 Westins®, two W®
agreements, and to extend certain contracts for ten additional        hotels, one St. Regis® hotel, one The Luxury Collection® hotel
years. As part of this negotiation, Marriott International in turn    and one additional unbranded hotel. With the addition of these
agreed to make a cash payment to us, to reduce an existing cap        hotels, 54% of our portfolio (by revenue) will consist of
on the costs and expenses related to chain services that are pro-     Marriott-branded hotels, while Westin-branded hotels will rep-
vided on a centralized basis, as well as to establish a cap on cer-   resent 9%, up from 1% prior to the acquisition, and Sheraton
tain other costs, to provide us with an incentive to increase our     and W-branded hotels will represent 12% and 2%, respectively.
capital expenditures at the hotels through 2008, to waive certain     Currently, we do not own any Sheraton or W-branded hotels.
deferred management fees, and to modify the incentive manage-         In addition, we expect to work with Starwood to add value to
ment fee on certain contracts. In addition, we agreed to use a        the portfolio through aggressive asset management and believe
portion of Marriott International’s cash payment for brand            that our expanded relationship will foster additional growth
reinvestment projects at various hotels in our portfolio.             opportunities for both companies in the future.
Upon completion of the acquisition, we expect to be one of                          Swissôtel The Drake, New York, the Fort Lauderdale Marina
                             the largest lodging companies in the U.S. and the sixth-largest                         Marriott, the Albany Marriott, Chicago Marriott Deerfield
                             public REIT. We will own 137 luxury and upper-upscale hotels                            Suites and the Marriott at Research Triangle Park), (ii) sales of
                             with approximately 70,000 rooms that are affiliated with 17                             joint venture interests related to the six European assets to be
                             brands located in over 50 markets in nine countries.                                    acquired and (iii) the issuance or other incurrence of indebted-
                                 We have received commitments from Goldman Sachs Credit                              ness to repay any remaining draws on the bridge loan facility.
                             Partners, L.P., Deutsche Bank AG Cayman Islands Branch, Bank                            We entered into an agreement on March 24, 2006 with third
                             of America Bridge LLC and Merrill Lynch Capital Corporation                             parties regarding such a joint venture in which we will retain
                             in an aggregate amount of up to $1.39 billion, which is suffi-                          approximately 32% of the equity interests in the joint venture
                             cient to fund the cash portion of the purchase price of the                             while obtaining approximately $560 million of financing,
                             transactions. The bridge loan facility has a term, excluding                            including new debt to be issued by the joint venture but exclud-
                             extensions, of one year.                                                                ing our portion of the capital contributions to the joint venture.
                                 We expect to permanently finance the $1.39 billion cash por-                        Depending upon the timing of the closing of the asset sales and
                             tion of the purchase price for the transactions through available                       permanent financing transactions, proceeds therefrom may be
                             cash and cash proceeds from a combination of (i) asset sales of                         used to repay the bridge loan facility.
                             existing assets of approximately $670 million (including the                                The following table sets forth the location and number of
                                                                                                                     rooms of hotels included in the Starwood Portfolio:


                             Domestic Hotels                                                                CIT Y                         STATE      COUNTRY                   RO OMS

                             Sheraton New York Hotel & Towers                                               New York                      NY         USA                        1,746
                             Sheraton Boston Hotel                                                          Boston                        MA         USA                        1,216
                             Sheraton San Diego Hotel & Marina                                              San Diego                     CA         USA                        1,044
                             The Westin Seattle                                                             Seattle                       WA         USA                          891
                             The Westin Los Angeles Airport                                                 Los Angeles                   CA         USA                          740
host hotels & resorts 2005


                             W New York                                                                     New York                      NY         USA                          688
                             The Westin Indianapolis                                                        Indianapolis                  IN         USA                          573
                             Sheraton Indianapolis Hotels and Suites                                        Indianapolis                  IN         USA                          560
                             The Westin Mission Hills Resort & Spa                                          Rancho Mirage                 CA         USA                          512
                             The Westin Cincinnati                                                          Cincinnati                    OH         USA                          456
                             Sheraton Stamford Hotel                                                        Stamford                      CT         USA                          448
                             The Westin Tabor Center                                                        Denver                        CO         USA                          430
                             W Seattle                                                                      Seattle                       WA         USA                          426
22
                             The Westin South Coast Plaza                                                   Costa Mesa                    CA         USA                          390
                             Sheraton Milwaukee Brookfield Hotel                                            Brookfield                    WI         USA                          389
                             Sheraton Braintree Hotel                                                       Braintree                     MA         USA                          374
                             Sheraton Parsippany Hotel                                                      Parsippany                    NJ         USA                          370
                             The Westin Waltham-Boston                                                      Waltham                       MA         USA                          346
                             The Westin Grand, Washington, D.C.                                             Washington                    DC         USA                          263
                             Sheraton Suites Tampa Airport                                                  Tampa                         FL         USA                          259
                             Sheraton Needham Hotel                                                         Needham                       MA         USA                          247
                             St. Regis Hotel, Houston                                                       Houston                       TX         USA                          232
                             Sheraton Tucson Hotel & Suites                                                 Tucson                        AZ         USA                          216
                             Sheraton Providence Airport Hotel                                              Warwick                       RI         USA                          206
                             Capitol Hill Suites                                                            Washington                    DC         USA                          152
                                   Total—Domestic Hotels                                                                                                                       13,174

                             International Hotels
                             Sheraton Roma Hotel & Conference Center(1)                                     Rome                                     Italy                        634
                             The Westin Palace, Madrid, a Luxury Collection Hotel(1)                        Madrid                                   Spain                        468
                             Sheraton Santiago Hotel and Convention Center                                  Santiago                                 Chile                        379
                             Sheraton Skyline Hotel & Conference Centre(1)                                  Hayes                                    United Kingdom               350
                             Sheraton Warsaw Hotel & Towers(1)                                              Warsaw                                   Poland                       350
                             Sheraton Fiji Resort                                                           Nadi                                     Fiji                         281
                             The Westin Denarau Island Resort & Spa                                         Nadi                                     Fiji                         267
                             The Westin Palace, Milan, a Luxury Collection Hotel(1)                         Milan                                    Italy                        228
                             The Westin Europa & Regina(1)                                                  Venice                                   Italy                        185
                             San Cristobal Tower, a Luxury Collection Hotel                                 Santiago                                 Chile                        139
                                   Total—International Hotels                                                                                                                   3,281
                                   Total                                                                                                                                       16,455
                             (1)
                                   We anticipate that these properties will be owned by the European joint venture after the initial closing.
OVERVIEW                                                                          Corporate: This is the benchmark rate which a hotel pub-
                                                                              ■

                                                                                  lishes and offers to the general public. It is typically the
Structure and Business
                                                                                  second highest category, and is for travelers that do not
As of March 1, 2006, we own 103 full-service luxury and upper-
                                                                                  have access to negotiate or discount rates.
upscale hotel properties and we are the largest hotel Real Estate
                                                                                  Special Corporate: This is a negotiated rate offered to
                                                                              ■
Investment Trust, or REIT, in the National Association of Real
                                                                                  companies and organizations that provide significant lev-
Estate Investment Trust’s composite index. A REIT is a legal
                                                                                  els of room night demand to the hotel. These rates are
entity that holds real estate interests and, through payments of
                                                                                  typically negotiated annually, at a discount to the antici-
dividends to stockholders, is permitted to reduce or avoid fed-
                                                                                  pated corporate rate.
eral income taxes at the corporate level. Host operates as a self-
managed and self-administered REIT and owns approximately                         Discount: This encompasses all discount programs, such
                                                                              ■

95% of the partnership interests of Host Marriott, L.P., (Host                    as AAA and AARP discounts, government per diem,
LP, or the Operating Partnership).                                                rooms booked through internet distribution and whole-
    Our hotels are operated under brand names that are among                      sale channels, frequent guest program redemptions, and
the most respected and widely recognized in the lodging indus-                    promotional rates and packages offered by a hotel.
try—including Marriott®, Ritz-Carlton®, Hyatt®, Four                          Group demand represents clusters of guestrooms booked
Seasons®, Fairmont®, Hilton® and Westin®. Approximately                    together, usually with a minimum of 10 rooms. Examples
85% of our hotels (as measured by sales) are currently managed             include a company training session or a social event such as a
by Marriott International or its affiliates and branded under the          family reunion. Group business is segmented into the following
Marriott or Ritz-Carlton brand names. The majority of our                  three key sub-categories:
properties are located in central business districts of major
                                                                                  Association: Group business related to national and
                                                                              ■
cities, near airports and in resort/conference destinations. The
                                                                                  regional association meetings and conventions.
target profile for our portfolio includes luxury and upper-
                                                                                  Corporate: Group business related to corporate meetings
                                                                              ■
upscale full-service properties in urban and resort/conference
                                                                                  (e.g., product launches, training programs, contract nego-
destinations that benefit from significant barriers to entry by
                                                                                  tiations, and presentations).
competitors. Though hotels meeting this target profile will still


                                                                                                                                                  host hotels & resorts 2005
be subject to competitive pressures, we believe this will allow us                Other: Group business predominately related to social, mil-
                                                                              ■

to maintain room rate and occupancy premiums over our com-                        itary, education, religious, fraternity and youth and ama-
petitors. We also seek to maximize the value of our portfolio                     teur sports teams, otherwise known as SMERF business.
through aggressive asset management by assisting the managers                  The final segment is contract demand, which refers to
of our hotels in maximizing property operations and by com-                blocks of rooms sold to a specific company for an extended
pleting strategic capital improvements.                                    period of time at significantly discounted rates. Contract rates
    The majority of our customers fall into three broad groups:            are usually utilized by hotels that are located in markets that are    23
transient business, group business, and contract business,                 experiencing consistently low levels of demand. Airline crews
approximately 57%, 41% and 2%, respectively, of our business               are typical generators of contract demand for our hotels.
in 2005. Similar to the majority of the lodging industry, we fur-              Our hotels are operated by third-party managers under
ther categorize business within these segments based on charac-            long-term agreements under which they typically earn base and
teristics they have in common as follows:                                  incentive management fees related to the revenues and prof-
    Transient demand broadly represents individual business or             itability of each individual hotel. We provide operating funds,
leisure travelers and is divided into four key sub-categories:             or working capital, which the managers use to operate the
premium, corporate, special corporate and discount. Overall,               property, including purchasing inventory and paying wages,
business travelers make up approximately 80% of transient                  utilities, property taxes and other expenses. We generally receive
demand at our hotels, with leisure travelers making up the                 a cash distribution, which reflects hotel-level sales less property-
remainder. Therefore, our business will be more significantly              level operating expenses (excluding depreciation), from our
affected by trends in business travel versus leisure demand:               hotel managers each four week or monthly accounting period,
       Premium: Sometimes referred to as “rack rate,” typically            depending on the manager.
   ■

       consists of rooms booked close to arrival during high                   Hotel revenue is approximately 97% of our total revenue.
       demand periods and is the highest rate category available.          The following table presents the components of our hotel rev-
       Room rates will fluctuate depending on anticipated                  enue as a percentage of our total revenue:
       demand levels (e.g. seasonality, weekday vs. weekend stays).


                                                                                                                        % OF 2005 REVENUES

Rooms revenue. Occupancy and average daily room rate are the major drivers of rooms revenue. The business
 mix of the hotel (group versus transient and premium versus discount business) is the key driver of room rates.                 60%
Food and beverage revenue. Occupancy and the type of customer staying at the hotel are the major drivers of
 food and beverage revenue (i.e., group business typically generates more food and beverage business through
 catering functions when compared to transient business, which may or may not utilize the hotel’s restaurants).                  30%
Other revenue. Occupancy, the nature of the property (i.e., resort, etc.) and its price point are the main drivers of
 other ancillary revenue, such as parking, golf course, spa, telephone, entertainment and other guest services.                   7%
Hotel operating expenses are approximately 98% of our total operating costs and expenses. The following table presents the
                             components of our hotel operating expenses as a percentage of our total operating costs and expenses:

                                                                                                                                                    % OF 2005 OPERATING
                                                                                                                                                    COSTS AND EXPENSES

                             Rooms expense. These costs include housekeeping, reservation systems, room supplies, laundry services and front
                              desk costs. Occupancy is the major driver of rooms expense. These costs can increase based on increases in salaries
                              and wages, as well as the level of service and amenities that are provided.                                                   17%
                             Food and beverage expense. These expenses primarily include food, beverage and labor costs. Occupancy and
                              the type of customer staying at the hotel (i.e., catered functions generally are more profitable than outlet sales)
                              are the major drivers of food and beverage expense, which correlates closely with food and beverage revenue.                  26%
                             Hotel departmental expense. These expenses include labor and other costs associated with the other ancillary revenues
                              such as parking, golf courses, spas, telephones, entertainment and other guest services, as well as labor and other costs
                              associated with administrative departments, sales and marketing, repairs and minor maintenance and utility costs.             30%
                             Management fees. Base management fees are computed as a percentage of gross revenue as set forth in our management
                              contracts. Incentive management fees generally are paid when operating profits exceed threshold levels established in
                              our management agreements.                                                                                                     5%
                             Other property-level expenses. These expenses consist primarily of real and personal property taxes, ground rent,
                              equipment rent and property insurance. Many of these expenses are relatively inflexible and do not necessarily change
                              in tandem with changes in revenues at our hotels.                                                                              9%
                             Depreciation and amortization expense. This is a non-cash expense that is relatively inflexible and changes primarily
                              based on the acquisition and disposition of hotel properties and the level of post-acquisition capital expenditures.          11%


                                The expense components listed above are based on those                  property’s market share. For example, a RevPAR penetration
host hotels & resorts 2005


                             presented in our consolidated statement of operations. It is also          index of 100 would indicate that a hotel’s RevPAR is, on aver-
                             worth noting that wage and benefit costs are spread among var-             age, the same as its competitors. A RevPAR penetration index
                             ious line items, however, taken separately these costs represent           exceeding 100 would indicate that a hotel maintains a RevPAR
                             approximately 50% of our total expenses, making wages and                  premium in relation to its competitive set, while a RevPAR pen-
                             benefits the most significant component of our cost structure.             etration index below 100 would be an indicator that a hotel is
                                                                                                        underperforming its competitive set. One critical component in
                             Key Performance Indicators                                                 this calculation is the determination of a hotel’s competitive set.
                             We have several key indicators that we use to evaluate the per-            Factors that we consider include geographic proximity, as well
24
                             formance of our business. Revenue per available room, or                   as the level of service provided at the property. For example, a
                             RevPAR, is a commonly used measure within the hotel industry               hotel located near a convention center might have a competitive
                             to evaluate hotel operations. RevPAR is defined as the product             set that includes other hotels located in close proximity to the
                             of the average daily room rate charged and the average daily               convention center. Additionally, a luxury hotel might include
                             occupancy achieved. RevPAR does not include revenues from                  other luxury or upper-upscale hotels in its competitive set but
                             food and beverage or parking, telephone, or other guest services           not economy hotels. Competitive set determinations are highly
                             generated by the property. Although RevPAR does not include                subjective, however, and our methodology for determining a
                             these ancillary revenues, it is generally considered the leading           hotel’s competitive set may differ materially from those used by
                             indicator of core revenues for many hotels. We also use RevPAR             other owners and/or managers.
                             to evaluate the results of individual hotels between periods and               We assess profitability by measuring changes in our operat-
                             our comparable hotels. See “Comparable Hotel Operating                     ing margin, which is operating profit as a percentage of total
                             Statistics” for further discussion of what we consider to be our           revenue. Another key profitability indicator we use is hotel
                             comparable hotels.                                                         adjusted operating profit which is a non-GAAP measure, and
                                 RevPAR changes driven predominately by occupancy have                  which is used to evaluate the profitability of our comparable
                             different implications on overall revenue levels as well as incre-         hotels. Hotel adjusted operating profit measures property-level
                             mental operating profit than do changes driven predominately               results before debt service and is a supplemental measure of
                             by average room rate. For example, increases in occupancy at a             individual property-level profitability. The comparable hotel
                             hotel would lead to increases in rooms revenues and ancillary              adjusted operating profit that we discuss is an aggregation of
                             revenues, such as food and beverage, as well as additional incre-          the adjusted operating profit for each of our comparable hotels.
                             mental costs (including housekeeping services, utilities and               See “Non-GAAP Financial Measures—Comparable Hotel
                             room amenity costs). RevPAR increases due to higher room                   Operating Results” for further discussion. We also use, among
                             rates, however, would not result in these additional room-related          other things, FFO per diluted share as a supplemental measure
                             costs. For this reason, while operating profit typically increases         of company-wide profitability. See “Non-GAAP Financial
                             when occupancy rises, RevPAR increases due to higher room                  Measures—FFO per Diluted Share” for further discussion.
                             rates would have a greater impact on our profitability.                    Each of the non-GAAP measures should be considered by
                                 A related revenue measure for our hotels is the RevPAR                 investors as supplemental measures to accounting principles
                             penetration index. The RevPAR penetration index reflects                   generally accepted in the United States of America, or GAAP,
                             each property’s RevPAR in relation to the RevPAR for that prop-            performance measures such as total revenues, operating profit
                             erty’s competitive set. We use the measure as an indicator of a            and earnings per unit.
expired in 2004. One outcome of these negotiations could be
Outlook
                                                                      potential increases in labor costs (by increased wages, benefits
For 2005, RevPAR for our comparable hotels increased 9.5% as
                                                                      and/or changes in work rules that increase costs). Any increases
compared to 2004. Improvements in RevPAR at our comparable
                                                                      in labor costs are likely to increase labor costs in these markets
hotels for 2005 were primarily driven by significant increases in
                                                                      generally, including at non-union hotels, because of competi-
average room rates, and, to a lesser extent, by increases in occu-
                                                                      tive pressure to pay market wages. Other potential affects of
pancy. This is a result of a number of positive trends, such as
                                                                      these negotiations could include temporary disruptions in
strong United States Gross Domestic Product, or GDP, growth,
                                                                      group bookings and/or hotel operations and it is difficult to
low growth in the supply of new luxury and upper-upscale
                                                                      predict their outcome at this time, although we do not believe
hotels and the strengthening in the group and transient seg-
                                                                      the outcome of these negotiations will have a material effect on
ments of our business. As a result of these trends, we expect
                                                                      our 2006 results of operations.
comparable hotel RevPAR to increase approximately 7% to 10%
                                                                          Operating margins are also affected by our food and bever-
for full year 2006.
                                                                      age operations, which represented 30% of our 2005 revenues.
    We expect the supply growth of luxury and upper-upscale
                                                                      During 2005, food and beverage revenue growth at our compa-
hotels to continue to be low for the next two to three years.
                                                                      rable hotels was 5.6%, with a food and beverage margin
Although always subject to uncertainty, supply growth is
                                                                      increase of 0.9 percentage points. As the economy continues to
relatively easier to forecast than demand growth due to the long
                                                                      grow, we expect food and beverage revenue to continue to
permit, approval and development lead-times associated with
                                                                      increase, in particular catering revenue, which should result in
building new full-service hotels or expanding existing full-
                                                                      further improvement in our operating margins.
service hotels. Based on data provided by Lodging Econometrics,
                                                                          We also expect to see improvements in RevPAR and operat-
luxury and upper-upscale hotel supply growth in the top 25
                                                                      ing margins as we continue our strategy of recycling assets.
U.S. markets is expected to increase by approximately 1.4% and
                                                                      Over the past two years, we have acquired individual luxury
1.9% in 2006 and 2007, respectively.
                                                                      and upper-upscale properties in urban and resort/convention
    The performance of our portfolio is also significantly affected
                                                                      destinations, where further large-scale lodging development
by the results of our large hotels, including our convention
                                                                      typically is limited, and have disposed of individual assets pri-
hotels, the majority of which are located in major urban markets.


                                                                                                                                              host hotels & resorts 2005
                                                                      marily in suburban and secondary markets. The assets we have
Convention hotels have historically outperformed in the early
                                                                      acquired have higher RevPAR, higher margins and, we believe,
stages of an industry downturn; however, they also lag the indus-
                                                                      higher growth potential than those we have sold. Over time,
try in performance in the early stages of recovery. This primarily
                                                                      these assets should contribute to improvements in overall
is due to the longer booking lead-time for large group business
                                                                      RevPAR and margins, as well as an increase in the average per
and the need for transient demand in a market to recover to
                                                                      room replacement cost of our portfolio. The expected RevPAR
more substantial levels given a greater capacity of rooms. In
                                                                      for the Starwood Portfolio is roughly comparable to the
2005, we saw significant improvement in the operations of our
                                                                      RevPAR for our current hotel portfolio.                                 25
convention hotels in certain markets, such as New York City and
                                                                          During 2005, the average RevPAR penetration index for our
Washington D.C. Our large hotels situated in weaker markets
                                                                      comparable hotels declined slightly as we continued to work
continue to lag the portfolio, but we are beginning to see signs of
                                                                      with our managers to optimize the market positioning and
improving market strength in several of these markets including
                                                                      business mix of our hotels. We believe that this decline in mar-
Boston and to a lesser extent San Francisco. We have also recently
                                                                      ket share has occurred because:
initiated major projects at our convention hotels in Atlanta and
Orlando with the intention of enhancing their competitive mar-               many of our hotels occupy the number one or number
                                                                         ■

ket position and improving performance. We expect increasing                 two positions in their competitive set and achieve mean-
demand to continue to improve operations at our large conven-                ingful RevPAR premiums. In several markets lower-
tion hotels as markets strengthen, which should positively affect            ranked hotels have improved their competitive position
margin and RevPAR growth.                                                    (through renovation or other means) resulting in a nar-
    Operating margins improved in 2005, as the average room                  rowing of our RevPAR premium.
rate increases at our hotels significantly exceeded the rate of              our hotels generally have a higher percentage of their rev-
                                                                         ■
inflation, a trend we expect to continue. Operating margins                  enues generated by corporate group and corporate tran-
continue to be affected, however, by certain costs, primarily                sient customers than many of our competitors and that
wages, benefits, utilities and sales and marketing, which                    business in the luxury and upper-upscale segment did not
increased at a rate greater than inflation, a trend that we also             begin to significantly increase until the second half of 2004;
expect to continue in the near term. We expect utility costs to
                                                                             we have a significant number of large hotels in our port-
                                                                         ■
increase by over 10% in 2006, although these costs represent
                                                                             folio, including nine convention hotels with greater than
only approximately 3.6% of our revenues. Additionally, as a
                                                                             1,000 rooms, which require longer periods of time to
result of the large-scale devastation due to hurricanes this year,
                                                                             achieve optimal group bookings and business mix.
we expect insurance costs, which were approximately 1% of our
                                                                          As lodging demand continues to grow and, in particular, as
total costs and expenses in 2005, to increase in 2006 at a rate
                                                                      corporate group and corporate transient business strengthens,
that significantly exceeds inflation.
                                                                      we believe our RevPAR penetration index will improve.
    In addition, several markets have union contracts that
                                                                          While we believe the combination of improving demand
expire in 2006, including New York, Hawaii, Chicago, Toronto,
                                                                      trends and low supply trends in the lodging industry discussed
Boston and Los Angeles. The union contracts in San Francisco
HostHotels_05AnnualReport

More Related Content

What's hot

TMT Q1 Review by Jefferies
TMT Q1 Review by JefferiesTMT Q1 Review by Jefferies
TMT Q1 Review by JefferiesDave Liu
 
Dole 99 annrpt
Dole 99 annrptDole 99 annrpt
Dole 99 annrptfinance32
 
center- point energy annual reports 2005
center- point energy annual reports 2005center- point energy annual reports 2005
center- point energy annual reports 2005finance41
 

What's hot (8)

ball ar00
ball ar00ball ar00
ball ar00
 
TMT Q1 Review by Jefferies
TMT Q1 Review by JefferiesTMT Q1 Review by Jefferies
TMT Q1 Review by Jefferies
 
Dole 99 annrpt
Dole 99 annrptDole 99 annrpt
Dole 99 annrpt
 
Results2009march
Results2009marchResults2009march
Results2009march
 
Results2009
Results2009Results2009
Results2009
 
2012 financial plan for FFGA
2012 financial plan for FFGA2012 financial plan for FFGA
2012 financial plan for FFGA
 
SSS 2010 Annual Report
SSS 2010 Annual ReportSSS 2010 Annual Report
SSS 2010 Annual Report
 
center- point energy annual reports 2005
center- point energy annual reports 2005center- point energy annual reports 2005
center- point energy annual reports 2005
 

Similar to HostHotels_05AnnualReport

HostHotels_06AnnualReport
HostHotels_06AnnualReportHostHotels_06AnnualReport
HostHotels_06AnnualReportfinance38
 
HostMarriott_04AnnualReport
HostMarriott_04AnnualReportHostMarriott_04AnnualReport
HostMarriott_04AnnualReportfinance38
 
HostMarriott_02AnnualReport
HostMarriott_02AnnualReportHostMarriott_02AnnualReport
HostMarriott_02AnnualReportfinance38
 
arrow electronics annual reports 2003
arrow electronics annual reports 2003arrow electronics annual reports 2003
arrow electronics annual reports 2003finance16
 
autozone AZO_03AR
autozone  AZO_03ARautozone  AZO_03AR
autozone AZO_03ARfinance46
 
advanced micro devices Q408Financials
advanced micro devices Q408Financialsadvanced micro devices Q408Financials
advanced micro devices Q408Financialsfinance34
 
AMD Q408Financials
AMD Q408FinancialsAMD Q408Financials
AMD Q408Financialsfinance34
 
AMD-Q408Financials
AMD-Q408FinancialsAMD-Q408Financials
AMD-Q408Financialsfinance34
 
AMD Q408Financials
AMD Q408FinancialsAMD Q408Financials
AMD Q408Financialsfinance34
 
advanced micro devices Q408Financials
advanced micro devices Q408Financialsadvanced micro devices Q408Financials
advanced micro devices Q408Financialsfinance34
 
center- point energy annual reports2007
center- point energy annual reports2007 center- point energy annual reports2007
center- point energy annual reports2007 finance41
 
SHAWGROUPAR03
SHAWGROUPAR03SHAWGROUPAR03
SHAWGROUPAR03finance36
 
ecolab 2_DscrptBusnFinHighlight
ecolab  2_DscrptBusnFinHighlightecolab  2_DscrptBusnFinHighlight
ecolab 2_DscrptBusnFinHighlightfinance37
 
HostMarriott_03AnnualReport
HostMarriott_03AnnualReportHostMarriott_03AnnualReport
HostMarriott_03AnnualReportfinance38
 
HENRY SCHEIN 2002AnnualReport
HENRY SCHEIN 2002AnnualReportHENRY SCHEIN 2002AnnualReport
HENRY SCHEIN 2002AnnualReportfinance35
 
direc tv group Annual Reports 1998
direc tv group Annual Reports 1998direc tv group Annual Reports 1998
direc tv group Annual Reports 1998finance15
 
Implementing Partnerships in California
Implementing Partnerships in CaliforniaImplementing Partnerships in California
Implementing Partnerships in CaliforniaAdam Nicolopoulos
 
motorola 2001 Summary Annual Report
motorola 	2001 Summary Annual Reportmotorola 	2001 Summary Annual Report
motorola 2001 Summary Annual Reportfinance7
 

Similar to HostHotels_05AnnualReport (20)

HostHotels_06AnnualReport
HostHotels_06AnnualReportHostHotels_06AnnualReport
HostHotels_06AnnualReport
 
HostMarriott_04AnnualReport
HostMarriott_04AnnualReportHostMarriott_04AnnualReport
HostMarriott_04AnnualReport
 
HostMarriott_02AnnualReport
HostMarriott_02AnnualReportHostMarriott_02AnnualReport
HostMarriott_02AnnualReport
 
arrow electronics annual reports 2003
arrow electronics annual reports 2003arrow electronics annual reports 2003
arrow electronics annual reports 2003
 
.credit-suisse - Presentation
.credit-suisse - Presentation.credit-suisse - Presentation
.credit-suisse - Presentation
 
credit-suisse Slides - Presentation
credit-suisse Slides - Presentationcredit-suisse Slides - Presentation
credit-suisse Slides - Presentation
 
autozone AZO_03AR
autozone  AZO_03ARautozone  AZO_03AR
autozone AZO_03AR
 
advanced micro devices Q408Financials
advanced micro devices Q408Financialsadvanced micro devices Q408Financials
advanced micro devices Q408Financials
 
AMD Q408Financials
AMD Q408FinancialsAMD Q408Financials
AMD Q408Financials
 
AMD-Q408Financials
AMD-Q408FinancialsAMD-Q408Financials
AMD-Q408Financials
 
AMD Q408Financials
AMD Q408FinancialsAMD Q408Financials
AMD Q408Financials
 
advanced micro devices Q408Financials
advanced micro devices Q408Financialsadvanced micro devices Q408Financials
advanced micro devices Q408Financials
 
center- point energy annual reports2007
center- point energy annual reports2007 center- point energy annual reports2007
center- point energy annual reports2007
 
SHAWGROUPAR03
SHAWGROUPAR03SHAWGROUPAR03
SHAWGROUPAR03
 
ecolab 2_DscrptBusnFinHighlight
ecolab  2_DscrptBusnFinHighlightecolab  2_DscrptBusnFinHighlight
ecolab 2_DscrptBusnFinHighlight
 
HostMarriott_03AnnualReport
HostMarriott_03AnnualReportHostMarriott_03AnnualReport
HostMarriott_03AnnualReport
 
HENRY SCHEIN 2002AnnualReport
HENRY SCHEIN 2002AnnualReportHENRY SCHEIN 2002AnnualReport
HENRY SCHEIN 2002AnnualReport
 
direc tv group Annual Reports 1998
direc tv group Annual Reports 1998direc tv group Annual Reports 1998
direc tv group Annual Reports 1998
 
Implementing Partnerships in California
Implementing Partnerships in CaliforniaImplementing Partnerships in California
Implementing Partnerships in California
 
motorola 2001 Summary Annual Report
motorola 	2001 Summary Annual Reportmotorola 	2001 Summary Annual Report
motorola 2001 Summary Annual Report
 

More from finance38

urs proxy reports 2005
urs proxy reports 2005urs proxy reports 2005
urs proxy reports 2005finance38
 
urs proxy reports 2007
urs proxy reports 2007urs proxy reports 2007
urs proxy reports 2007finance38
 
urs proxy reports 2008
urs proxy reports 2008urs proxy reports 2008
urs proxy reports 2008finance38
 
urs Form 10-K 2004
urs Form 10-K 2004urs Form 10-K 2004
urs Form 10-K 2004finance38
 
urs Form 10-K 2005
urs Form 10-K 2005urs Form 10-K 2005
urs Form 10-K 2005finance38
 
urs Form 10-K 2006
urs Form 10-K 2006urs Form 10-K 2006
urs Form 10-K 2006finance38
 
urs Form 10-K 2007
urs Form 10-K 2007urs Form 10-K 2007
urs Form 10-K 2007finance38
 
urs annual reports 2004
urs annual reports 2004urs annual reports 2004
urs annual reports 2004finance38
 
urs annual reports 2006
urs annual reports 2006urs annual reports 2006
urs annual reports 2006finance38
 
urs annual reports 2005
urs annual reports 2005urs annual reports 2005
urs annual reports 2005finance38
 
urs annual reports 2007
urs annual reports 2007urs annual reports 2007
urs annual reports 2007finance38
 
ntrs_investor_day_ntgi
ntrs_investor_day_ntgintrs_investor_day_ntgi
ntrs_investor_day_ntgifinance38
 
ntrs_investor_day_cis
ntrs_investor_day_cisntrs_investor_day_cis
ntrs_investor_day_cisfinance38
 
ntrs_investor_day_pfs
ntrs_investor_day_pfsntrs_investor_day_pfs
ntrs_investor_day_pfsfinance38
 
ntrs_investor_day_cfo
ntrs_investor_day_cfontrs_investor_day_cfo
ntrs_investor_day_cfofinance38
 
ntrs_investor_day_ceo
ntrs_investor_day_ceontrs_investor_day_ceo
ntrs_investor_day_ceofinance38
 
ntrs_bancanalysts_boston_nov_6_08
ntrs_bancanalysts_boston_nov_6_08ntrs_bancanalysts_boston_nov_6_08
ntrs_bancanalysts_boston_nov_6_08finance38
 
ntrs_citigroup_jan_28_09
ntrs_citigroup_jan_28_09ntrs_citigroup_jan_28_09
ntrs_citigroup_jan_28_09finance38
 
ntrs_2007_proxy
ntrs_2007_proxyntrs_2007_proxy
ntrs_2007_proxyfinance38
 
northerntrust_proxy_2009
northerntrust_proxy_2009northerntrust_proxy_2009
northerntrust_proxy_2009finance38
 

More from finance38 (20)

urs proxy reports 2005
urs proxy reports 2005urs proxy reports 2005
urs proxy reports 2005
 
urs proxy reports 2007
urs proxy reports 2007urs proxy reports 2007
urs proxy reports 2007
 
urs proxy reports 2008
urs proxy reports 2008urs proxy reports 2008
urs proxy reports 2008
 
urs Form 10-K 2004
urs Form 10-K 2004urs Form 10-K 2004
urs Form 10-K 2004
 
urs Form 10-K 2005
urs Form 10-K 2005urs Form 10-K 2005
urs Form 10-K 2005
 
urs Form 10-K 2006
urs Form 10-K 2006urs Form 10-K 2006
urs Form 10-K 2006
 
urs Form 10-K 2007
urs Form 10-K 2007urs Form 10-K 2007
urs Form 10-K 2007
 
urs annual reports 2004
urs annual reports 2004urs annual reports 2004
urs annual reports 2004
 
urs annual reports 2006
urs annual reports 2006urs annual reports 2006
urs annual reports 2006
 
urs annual reports 2005
urs annual reports 2005urs annual reports 2005
urs annual reports 2005
 
urs annual reports 2007
urs annual reports 2007urs annual reports 2007
urs annual reports 2007
 
ntrs_investor_day_ntgi
ntrs_investor_day_ntgintrs_investor_day_ntgi
ntrs_investor_day_ntgi
 
ntrs_investor_day_cis
ntrs_investor_day_cisntrs_investor_day_cis
ntrs_investor_day_cis
 
ntrs_investor_day_pfs
ntrs_investor_day_pfsntrs_investor_day_pfs
ntrs_investor_day_pfs
 
ntrs_investor_day_cfo
ntrs_investor_day_cfontrs_investor_day_cfo
ntrs_investor_day_cfo
 
ntrs_investor_day_ceo
ntrs_investor_day_ceontrs_investor_day_ceo
ntrs_investor_day_ceo
 
ntrs_bancanalysts_boston_nov_6_08
ntrs_bancanalysts_boston_nov_6_08ntrs_bancanalysts_boston_nov_6_08
ntrs_bancanalysts_boston_nov_6_08
 
ntrs_citigroup_jan_28_09
ntrs_citigroup_jan_28_09ntrs_citigroup_jan_28_09
ntrs_citigroup_jan_28_09
 
ntrs_2007_proxy
ntrs_2007_proxyntrs_2007_proxy
ntrs_2007_proxy
 
northerntrust_proxy_2009
northerntrust_proxy_2009northerntrust_proxy_2009
northerntrust_proxy_2009
 

Recently uploaded

Crypto Confidence Unlocked: AnyKYCaccount's Shortcut to Binance Verification
Crypto Confidence Unlocked: AnyKYCaccount's Shortcut to Binance VerificationCrypto Confidence Unlocked: AnyKYCaccount's Shortcut to Binance Verification
Crypto Confidence Unlocked: AnyKYCaccount's Shortcut to Binance VerificationAny kyc Account
 
What is sip and What are its Benefits in 2024
What is sip and What are its Benefits in 2024What is sip and What are its Benefits in 2024
What is sip and What are its Benefits in 2024prajwalgopocket
 
10 QuickBooks Tips 2024 - Globus Finanza.pdf
10 QuickBooks Tips 2024 - Globus Finanza.pdf10 QuickBooks Tips 2024 - Globus Finanza.pdf
10 QuickBooks Tips 2024 - Globus Finanza.pdfglobusfinanza
 
ΤτΕ: Ανάπτυξη 2,3% και πληθωρισμός 2,8% φέτος
ΤτΕ: Ανάπτυξη 2,3% και πληθωρισμός 2,8% φέτοςΤτΕ: Ανάπτυξη 2,3% και πληθωρισμός 2,8% φέτος
ΤτΕ: Ανάπτυξη 2,3% και πληθωρισμός 2,8% φέτοςNewsroom8
 
Banking: Commercial and Central Banking.pptx
Banking: Commercial and Central Banking.pptxBanking: Commercial and Central Banking.pptx
Banking: Commercial and Central Banking.pptxANTHONYAKINYOSOYE1
 
ekthesi-trapeza-tis-ellados-gia-2023.pdf
ekthesi-trapeza-tis-ellados-gia-2023.pdfekthesi-trapeza-tis-ellados-gia-2023.pdf
ekthesi-trapeza-tis-ellados-gia-2023.pdfSteliosTheodorou4
 
OAT_RI_Ep18 WeighingTheRisks_Mar24_GlobalCredit.pptx
OAT_RI_Ep18 WeighingTheRisks_Mar24_GlobalCredit.pptxOAT_RI_Ep18 WeighingTheRisks_Mar24_GlobalCredit.pptx
OAT_RI_Ep18 WeighingTheRisks_Mar24_GlobalCredit.pptxhiddenlevers
 
Gender and caste discrimination in india
Gender and caste discrimination in indiaGender and caste discrimination in india
Gender and caste discrimination in indiavandanasingh01072003
 
2B Nation-State.pptx contemporary world nation
2B  Nation-State.pptx contemporary world nation2B  Nation-State.pptx contemporary world nation
2B Nation-State.pptx contemporary world nationko9240888
 
Liquidity Decisions in Financial management
Liquidity Decisions in Financial managementLiquidity Decisions in Financial management
Liquidity Decisions in Financial managementshrutisingh143670
 
Hello this ppt is about seminar final project
Hello this ppt is about seminar final projectHello this ppt is about seminar final project
Hello this ppt is about seminar final projectninnasirsi
 
Global Economic Outlook, 2024 - Scholaride Consulting
Global Economic Outlook, 2024 - Scholaride ConsultingGlobal Economic Outlook, 2024 - Scholaride Consulting
Global Economic Outlook, 2024 - Scholaride Consultingswastiknandyofficial
 
2024-04-09 - Pension Playpen roundtable - slides.pptx
2024-04-09 - Pension Playpen roundtable - slides.pptx2024-04-09 - Pension Playpen roundtable - slides.pptx
2024-04-09 - Pension Playpen roundtable - slides.pptxHenry Tapper
 
Aon-UK-DC-Pension-Tracker-Q1-2024. slideshare
Aon-UK-DC-Pension-Tracker-Q1-2024. slideshareAon-UK-DC-Pension-Tracker-Q1-2024. slideshare
Aon-UK-DC-Pension-Tracker-Q1-2024. slideshareHenry Tapper
 
The Inspirational Story of Julio Herrera Velutini - Global Finance Leader
The Inspirational Story of Julio Herrera Velutini - Global Finance LeaderThe Inspirational Story of Julio Herrera Velutini - Global Finance Leader
The Inspirational Story of Julio Herrera Velutini - Global Finance LeaderArianna Varetto
 
Thoma Bravo Equity - Presentation Pension Fund
Thoma Bravo Equity - Presentation Pension FundThoma Bravo Equity - Presentation Pension Fund
Thoma Bravo Equity - Presentation Pension FundAshwinJey
 
Money Forward Integrated Report “Forward Map” 2024
Money Forward Integrated Report “Forward Map” 2024Money Forward Integrated Report “Forward Map” 2024
Money Forward Integrated Report “Forward Map” 2024Money Forward
 
Kempen ' UK DB Endgame Paper Apr 24 final3.pdf
Kempen ' UK DB Endgame Paper Apr 24 final3.pdfKempen ' UK DB Endgame Paper Apr 24 final3.pdf
Kempen ' UK DB Endgame Paper Apr 24 final3.pdfHenry Tapper
 
Introduction to Health Economics Dr. R. Kurinji Malar.pptx
Introduction to Health Economics Dr. R. Kurinji Malar.pptxIntroduction to Health Economics Dr. R. Kurinji Malar.pptx
Introduction to Health Economics Dr. R. Kurinji Malar.pptxDrRkurinjiMalarkurin
 
Building pressure? Rising rents, and what to expect in the future
Building pressure? Rising rents, and what to expect in the futureBuilding pressure? Rising rents, and what to expect in the future
Building pressure? Rising rents, and what to expect in the futureResolutionFoundation
 

Recently uploaded (20)

Crypto Confidence Unlocked: AnyKYCaccount's Shortcut to Binance Verification
Crypto Confidence Unlocked: AnyKYCaccount's Shortcut to Binance VerificationCrypto Confidence Unlocked: AnyKYCaccount's Shortcut to Binance Verification
Crypto Confidence Unlocked: AnyKYCaccount's Shortcut to Binance Verification
 
What is sip and What are its Benefits in 2024
What is sip and What are its Benefits in 2024What is sip and What are its Benefits in 2024
What is sip and What are its Benefits in 2024
 
10 QuickBooks Tips 2024 - Globus Finanza.pdf
10 QuickBooks Tips 2024 - Globus Finanza.pdf10 QuickBooks Tips 2024 - Globus Finanza.pdf
10 QuickBooks Tips 2024 - Globus Finanza.pdf
 
ΤτΕ: Ανάπτυξη 2,3% και πληθωρισμός 2,8% φέτος
ΤτΕ: Ανάπτυξη 2,3% και πληθωρισμός 2,8% φέτοςΤτΕ: Ανάπτυξη 2,3% και πληθωρισμός 2,8% φέτος
ΤτΕ: Ανάπτυξη 2,3% και πληθωρισμός 2,8% φέτος
 
Banking: Commercial and Central Banking.pptx
Banking: Commercial and Central Banking.pptxBanking: Commercial and Central Banking.pptx
Banking: Commercial and Central Banking.pptx
 
ekthesi-trapeza-tis-ellados-gia-2023.pdf
ekthesi-trapeza-tis-ellados-gia-2023.pdfekthesi-trapeza-tis-ellados-gia-2023.pdf
ekthesi-trapeza-tis-ellados-gia-2023.pdf
 
OAT_RI_Ep18 WeighingTheRisks_Mar24_GlobalCredit.pptx
OAT_RI_Ep18 WeighingTheRisks_Mar24_GlobalCredit.pptxOAT_RI_Ep18 WeighingTheRisks_Mar24_GlobalCredit.pptx
OAT_RI_Ep18 WeighingTheRisks_Mar24_GlobalCredit.pptx
 
Gender and caste discrimination in india
Gender and caste discrimination in indiaGender and caste discrimination in india
Gender and caste discrimination in india
 
2B Nation-State.pptx contemporary world nation
2B  Nation-State.pptx contemporary world nation2B  Nation-State.pptx contemporary world nation
2B Nation-State.pptx contemporary world nation
 
Liquidity Decisions in Financial management
Liquidity Decisions in Financial managementLiquidity Decisions in Financial management
Liquidity Decisions in Financial management
 
Hello this ppt is about seminar final project
Hello this ppt is about seminar final projectHello this ppt is about seminar final project
Hello this ppt is about seminar final project
 
Global Economic Outlook, 2024 - Scholaride Consulting
Global Economic Outlook, 2024 - Scholaride ConsultingGlobal Economic Outlook, 2024 - Scholaride Consulting
Global Economic Outlook, 2024 - Scholaride Consulting
 
2024-04-09 - Pension Playpen roundtable - slides.pptx
2024-04-09 - Pension Playpen roundtable - slides.pptx2024-04-09 - Pension Playpen roundtable - slides.pptx
2024-04-09 - Pension Playpen roundtable - slides.pptx
 
Aon-UK-DC-Pension-Tracker-Q1-2024. slideshare
Aon-UK-DC-Pension-Tracker-Q1-2024. slideshareAon-UK-DC-Pension-Tracker-Q1-2024. slideshare
Aon-UK-DC-Pension-Tracker-Q1-2024. slideshare
 
The Inspirational Story of Julio Herrera Velutini - Global Finance Leader
The Inspirational Story of Julio Herrera Velutini - Global Finance LeaderThe Inspirational Story of Julio Herrera Velutini - Global Finance Leader
The Inspirational Story of Julio Herrera Velutini - Global Finance Leader
 
Thoma Bravo Equity - Presentation Pension Fund
Thoma Bravo Equity - Presentation Pension FundThoma Bravo Equity - Presentation Pension Fund
Thoma Bravo Equity - Presentation Pension Fund
 
Money Forward Integrated Report “Forward Map” 2024
Money Forward Integrated Report “Forward Map” 2024Money Forward Integrated Report “Forward Map” 2024
Money Forward Integrated Report “Forward Map” 2024
 
Kempen ' UK DB Endgame Paper Apr 24 final3.pdf
Kempen ' UK DB Endgame Paper Apr 24 final3.pdfKempen ' UK DB Endgame Paper Apr 24 final3.pdf
Kempen ' UK DB Endgame Paper Apr 24 final3.pdf
 
Introduction to Health Economics Dr. R. Kurinji Malar.pptx
Introduction to Health Economics Dr. R. Kurinji Malar.pptxIntroduction to Health Economics Dr. R. Kurinji Malar.pptx
Introduction to Health Economics Dr. R. Kurinji Malar.pptx
 
Building pressure? Rising rents, and what to expect in the future
Building pressure? Rising rents, and what to expect in the futureBuilding pressure? Rising rents, and what to expect in the future
Building pressure? Rising rents, and what to expect in the future
 

HostHotels_05AnnualReport

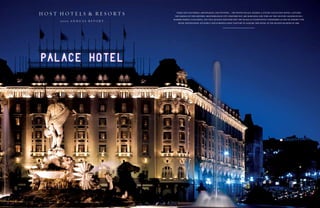
  • 1. HOST HOTELS & RESORTS WARM AND GLITTERING, ARISTOCRATIC AND INVITING… THE WESTIN PALACE, MADRID, A LUXURY COLLECTION HOTEL, CAPTURES THE ESSENCE OF THIS HISTORIC MEDITERRANEAN CITY. WHETHER YOU ARE SEARCHING FOR TURN-OF-THE-CENTURY GRANDEUR OR A MODERN WORLD-CLASS HOTEL, YOU WILL QUICKLY DISCOVER WHY THE PALACE IS CONSISTENTLY CONSIDERED AS ONE OF EUROPE’S TOP 2005 ANNUAL REPORT HOTEL DESTINATIONS. WE EXPECT OUR EUROPEAN JOINT VENTURE TO ACQUIRE THIS HOTEL IN THE SECOND QUARTER OF 2006.
  • 2. INTERNATIONAL BRANDS AND MARKETS upon the expected completion of the acquisition of the starwood portfolio in the second quarter of 2006, we will have ownership interests in 137 premium-branded hotels, in nine countries and over 50 markets. [ABOVE] The centuries-old Westin Europa & Regina is an architectural landmark just steps from Piazza San Marco in Venice, Italy. Named to Conde Nast Traveler’s 2005 Gold List, the hotel offers guests a combination of traditional elegance and modern technology, while providing the same magnificent views of the Grand Canal that once inspired Monet. We expect our European joint venture to acquire this hotel in the second quarter of 2006. HOST HOTELS & RESORTS will be the premier hospitality real estate company. we will own high-quality lodging assets in prime urban, airport and resort / convention lo cations. creating value through aggressive asset management and disciplined capital allocation to generate superior performance, we will maximize shareholders’ returns through a combina- tion of dividends, growth in funds from operations and increases to net asset value per share. EXISTING MARKETS (AS OF DECEMBER 31, 2005) MARKETS ACQUIRED AS PART OF THE STARWOOD ACQUISITION EUROPEAN JOINT VENTURE MARKETS
  • 3. F I NA N C I A L H IG H L IG H T S 2005 2004 2003 (unaudited, in millions, except per share data, hotel data, and stock price) OPERATING DATA Revenues $ 3,881 $ 3,574 $3,223 Operating profit 519 397 290 Net income (loss) 166 — 14 DILUTED INCOME (LOSS) PER COMMON SHARE Income (loss) from continuing operations $ .30 $ (.34) $ (1.00) Diluted income (loss)(1) $ .38 $ (.12) $ (.07) Diluted weighted average shares outstanding 355.5 337.3 281.0 BALANCE SHEET DATA Total assets $ 8,245 $ 8,421 $8,592 Debt(2) 5,370 5,523 5,486 Convertible preferred securities(2) — — 475 Equity 2,417 2,395 2,136 OTHER DATA Adjusted EBITDA(1) $ 918 $ 790 $ 709 host hotels & resorts 2005 Funds from operations per diluted share(1) 1.15 .77 .99 Stock price on December 31st 18.95 17.30 12.32 COMPARABLE HOTEL DATA (3) Number of properties 98 98 Number of rooms 48,785 48,785 1 Average daily rate $166.80 $154.96 Occupancy percentage 73.6% 72.4% RevPAR(4) $122.82 $112.21 (1) Certain transactions significantly affected Funds From Operations (FFO) per diluted share, Adjusted Earnings before Interest Expense, Income Taxes, Depreciation, Amortization and other items (Adjusted EBITDA) and income (loss) per share for all years presented. FFO per diluted share and Adjusted EBITDA are non-GAAP financial measures within the meaning of the rules of the Securities & Exchange Commission and, accordingly, these measures have been reconciled to comparable GAAP measures. For further discussion of FFO per diluted share, see Management’s Discussion and Analysis of Results of Operations and Financial Condition. For further discussion of Adjusted EBITDA, see our Form 8-K dated and filed February 23, 2006. (2) Effective January 1, 2004, we adopted a revision to Financial Interpretation No. 46 “Consolidation of Variable Interest Entities” (FIN 46R). As a result, we deconsolidated a wholly owned limited purpose trust subsidiary (the “Trust”) and recorded the $492 million Convertible Subordinated Debentures issued by the Trust as debt and eliminated the $475 million of Convertible Preferred Securities that were previously classified in the mezzanine section of our consolidated balance sheet prior to January 1, 2004. For further discussion see Management’s Discussion and Analysis of Results of Operations and Financial Condition. (3) We define our comparable hotels as full-service properties that are owned or leased by us and the operations of which are included in our consoli- dated results, whether as continuing operations or discontinued operations, for the entirety of the reporting periods being compared, and that have not sustained substantial property damage or undergone large-scale capital projects during the reporting periods being compared. (4) Room revenue per available room (“RevPAR”) represents the combination of average daily room rate charged and the average daily occupancy achieved, and is a commonly used indicator of hotel performance. RevPAR does not include food and beverage or other ancillary revenues generated by the property. C ON T E N T S To Our Stockholders . . . . . . . . . . . . . . . . . . . . . . . . . . . . . . . . . . . . . . . . . . . . . . . 2 Reports of Independent Registered Public Accounting Firm on Internal Control Over Financial Reporting and Management’s Board of Directors and Management Team . . . . . . . . . . . . . . . . . . . . . . . . . . . . 20 Assessment and on the Consolidated Financial Statements . . . . . . . . . . . . 70 Management’s Discussion and Analysis of Results of Management Certifications . . . . . . . . . . . . . . . . . . . . . . . . . . . . . . . . . . . . . . . . . 71 Operations and Financial Condition . . . . . . . . . . . . . . . . . . . . . . . . . . . . . . 21 Selected Financial Data . . . . . . . . . . . . . . . . . . . . . . . . . . . . . . . . . . . . . . . . . . . . 71 Forward-Looking Statements . . . . . . . . . . . . . . . . . . . . . . . . . . . . . . . . . . . . . . . 47 Host Marriott Portfolio . . . . . . . . . . . . . . . . . . . . . . . . . . . . . . . . . . . . . . . . . . . . 72 Financial Statements . . . . . . . . . . . . . . . . . . . . . . . . . . . . . . . . . . . . . . . . . . . . . . . 48 Directors, Officers and Management Team . . . . . . . . . . . . . . . . Inside Back Cover Management’s Report . . . . . . . . . . . . . . . . . . . . . . . . . . . . . . . . . . . . . . . . . . . . . . 69 Management’s Report on Internal Control Over Financial Reporting . . . . . . 69 Corporate Information . . . . . . . . . . . . . . . . . . . . . . . . . . . . . . . Inside Back Cover
  • 4. TO OU R S TO C K HOL DE R S We had an outstanding 2005, delivering significant increases in operating results, earnings and dividends and executing on strategic initiatives that will help distin- guish our company as a global player in the lodging industry. Throughout the year we maintained our stra- tegic focus, aggressively managing our existing portfolio host hotels & resorts 2005 and practicing a systematic and disciplined approach to capital allocation. Our focus and the continued improve- ment of lodging fundamentals have enhanced our lodg- ing portfolio and strengthened our financial position for the future. Some of the more significant recent accom- CHRISTOPHER J. NASSETTA plishments include: 2 President and Chief Executive Officer ◆ Our operating results improved significantly over RICHARD E. MARRIOTT Chairman of the Board 2004 in nearly every measure of performance. The RevPAR increase of 9.5% in 2005 was the highest full-year improvement since 1998, helping to drive signifi- cant increases in operating margins and cash flow; ◆ On November 14, 2005, we entered an agreement to acquire an outstanding portfolio of hotels from Starwood Hotels & Resorts Worldwide, Inc. On April 10, 2006, we completed the purchase of 28 of the properties and expect to close on the remaining seven properties by the end of the second quarter. This $3.8 billion acquisi- tion delivers on all of our qualitative and quantitative acquisition parameters and forges a new partnership with one of the most innovative brand and management companies in the lodging industry; ◆ We formed a joint venture on March 24, 2006 to own the Starwood hotels in Spain, Italy, Poland and the United Kingdom and to serve as a platform for further European expansion, as well as provide approximately $560 million of financing for the acquisition of the European hotels from Starwood; ◆ On September 30, 2005, we purchased the 834-room Hyatt Regency Washington on Capitol Hill for $274 mil- lion, the seventh Hyatt-managed property in our portfolio; ◆ We have pursued opportunities to unlock the inherent real estate value in our portfolio where it exceeds the value of the properties as hotels, such as in the sales in 2006 of the Fort Lauderdale Marina Marriott and the Swissôtel The Drake, New York for approximately $580 million;
  • 5. We have enhanced our existing portfolio through investment in repositioning and return on investment proj- ects spending over $100 million on these high yield projects in 2005; ◆ We continued to recycle capital out of assets that are not in keeping with our long-term strategic goals in 2005, including the sale of five non-core assets and 85% of our interest in the Courtyard by Marriott joint venture for proceeds of over $240 million; and ◆ We continued to restructure our balance sheet in ways that have increased flexibility and, as a result, we are host hotels & resorts 2005 well on our way to achieving the strongest balance sheet in our history. We believe these accomplishments exemplify the focused and disciplined approach to running our business that has made us the nation’s premier owner of lodging real estate. Consistent with our expectations, 2005 marked the second year of strong growth in what we expect to be a sustained recovery in the lodging industry. Our focus 3 on luxury and upper-upscale hotels has, over the long-term, provided superior returns to our stockholders through appreciation in net asset value and growth in earnings and dividends. We believe that the combination of continued strong demand growth and supply growth that remains at historically low levels, particularly in our segments and markets, will sustain the current powerful recovery in the lodging industry and produce results that are some of the best in our history. Based on these strong fundamentals, we believe we are at an attractive point in the lodging cycle to grow our business both in North America and, with the help of our newly-formed joint venture, Europe as well. While we recently renamed the company Host Hotels & Resorts, Inc. to reflect the fundamental changes that we have undergone over the past 12 years, our vision, mission, values and strategy remain unchanged. Our evolu- tion from a domestic company with a single brand and an enterprise value of just over $3 billion to an emerging international company with multiple world-renowned brands and an enterprise value of over $17 billion has been dramatic. Yet, through it all, we have remained steadfast to our demanding best-in-class standards. These steps, the positive lodging fundamentals, and our unmatched portfolio and strong capital structure should result in meaningful growth in RevPAR, earnings and superior returns to our stockholders next year and beyond. RICHARD E. MARRIOTT CHRISTOPHER J. NASSETTA Chairman of the Board President and Chief Executive Officer APRIL 10, 2006
  • 6. UNWAVERING S T R AT EG IC FO C U S Our success over the past 12 years is a direct reflection of our clear and unwavering strategic focus, which is to pro- vide superior total returns to our stockholders through appreciation in asset values and growth in earnings and dividends. To achieve these goals, we have carefully exe- cuted on a focused and disciplined long-term strategic plan to acquire high-quality lodging assets in prime urban and resort destinations that have the potential for significant capital appreciation. We then work to enhance the value of the portfolio by working with our operators host hotels & resorts 2005 to aggressively manage our hotels to increase revenues and minimize operating costs, while pursuing selective capital improvements designed to increase profitability. The building blocks of this strategic vision have been the prudent stewardship of our capital structure. Management has made every effort to maintain the appropriate balance of debt and equity, while providing the 4 company with sufficient flexibility to be able to react to market forces. During 2005, our commitment to a strong capital structure permitted us to move forward on several of our strategic initiatives; including the purchase of the Hyatt Regency Washington on Capitol Hill, an aggressive capital investment program in our existing port- folio and most significantly, the acquisition of the Starwood portfolio. Our success in restructuring our balance sheet over the past several years has resulted in reduced overall lever- age, expanded financial flexibility and improved interest coverage ratios. Including the first quarter of 2006 con- version of our Convertible Subordinated Debentures into common shares and other financing activities since the beginning of 2003 through 2005, our debt balance has decreased over $1 billion and our annual interest pay- ments have decreased over $100 million. We will continue to pursue future opportunities to reduce leverage or improve coverages by the selective recycling of capital and the repayment or refinancing of debt when rates are favorable. The correct capital structure also means having ample liquidity. Our near-term liquidity, including available cash and $575 million of capacity under our credit facility, is strong and more than sufficient to con- tinue to invest in our existing portfolio, as well as take advantage of acquisition opportunities that meet our investment criteria. [ABOVE] The spectacular twin towers of the 1,356-room San Diego Marriott Hotel & Marina are adjacent to the Convention Center and Seaport Village in the heart of downtown San Diego and is within comfortable walking distance of the Gaslamp District, Farmers market and other popular attractions. The hotel features over 100,000 square feet of meeting space as well as a 446-slip marina, one of California’s largest. [RIGHT] Casting its dramatic reflection onto the bay, the Tampa Marriott Waterside is a major factor in the successful redevelopment of the city’s Channel District. Connected directly to the 353,000 square foot Tampa Convention Center and close to Ybor City, the historic and vibrant Latin district, this property significantly enhances Tampa’s appeal as a major convention destination.
  • 7.
  • 8. THE FAIRMONT KEA LANI MAUI, HAWAII’S ONLY ALL-SUITE RESORT, RESTS GRACEFULLY ON POLO BEACH, ON THE SUNNY SOUTHWEST SHORES OF MAUI. THE NAME KEA LANI MEANS “HEAVENLY WHITE,” WHICH APPROPRIATELY DESCRIBES THE GLEAMING WHITE EXTERIOR OF THIS LAVISH RESORT. THIS TROPICAL PARADISE RESORT OFFERS A MYRIAD OF ISLAND ACTIVITIES, INCLUDING WINDSURFING OFF THE BEACH, RELAXING AT THE SPA OR AN INTIMATE DINNER ON YOUR PRIVATE LANAI.
  • 9. SUPERIOR A S S E T M A NAG E M E N T Growth in revenues and profits is not guaranteed, it is earned. Future increases in revenues and operating profits at our hotels will result from our aggressive approach to asset management. As the largest owner of luxury and upper-upscale properties, our asset management team benefits from the diversity of premium brands and the size and composition of our portfolio. Our broad per- spective provides us with a unique ability to benchmark similar hotels and identify best practices, value enhance- ment opportunities and efficiencies that can be commu- host hotels & resorts 2005 nicated to our managers. We work closely with our managers to implement these strategies, which result in enhanced revenue management, reduced operating costs and other operating synergies, all of which will improve the long-term profitability and value of our portfolio. In this regard, the Starwood portfolio presents an exciting opportunity as these hotels have never benefited from the oversight of a third-party asset manager. We already have identified key opportunities and developed a strategic 8 plan for each property to uncover ways revenues can be enhanced, costs reduced and margins improved. We have seen a marked improvement in demand in all segments of our business, which has provided our oper- ators the ability to increase room rates while also increasing the mix of business represented by higher-rated segments. We also experienced strong margin improvement in 2005, as the growth in RevPAR was primarily driven by significant increases in room rates, as well as improvements in food and beverage sales. Controlling operating costs is always a key priority. We work closely with our operators to reduce costs and generate savings in ways that do not impact the quality of our hotels or guest satisfaction, which has resulted in increases in oper- ating margins despite costs such as labor and utilities rising at a rate greater than inflation. As we continue to maximize the business mix at our hotels, we expect to see further improvements in our operating margins. Standing as a beacon in the thriving heart of Seattle, the W Seattle is a premier destination for the savvy traveler. The W Seattle’s [ABOVE] modern crown of a steel-and-mesh pyramid provides a magical glow 26 stories above the street reflecting this city’s architectural history and unique northwestern style. [RIGHT] Explore all our Nation’s capital offers from this newly renovated luxury hotel in Washington, D.C. The Hyatt Regency Washington on Capitol Hill places you close to government and business centers, museums, memorials and other attractions. Delight in all that this downtown Washington, D.C. hotel affords—from Grand Beds in all 834 spacious guestrooms and fine dining, to wireless Internet and 41,000 square feet of function space.
  • 10.
  • 11. RESEMBLING A GRAND MEDITERRANEAN VILLA, THIS LUXURIOUS 463-ROOM HOTEL IS SET AMIDST 20 BEACHFRONT ACRES ON FLORIDA’S SOUTHWEST COAST. THE RITZ-CARLTON, NAPLES HAS EARNED BOTH MOBIL FIVE-STAR AND AAA FIVE-DIAMOND RECOGNITION AS ONE OF THE COUNTRY’S TOP RESORTS.
  • 12. UNMATCHED P OR T FOL IO DI V E R S I F IC AT ION Over the past 12 years, we have strategically assembled an unmatched portfolio of luxury and upper-upscale hotels. Our portfolio is geographically diverse within North America and is operated under some of the most recog- nized brand names in the hospitality industry. Our $3.8 billion acquisition of the 35 hotels from Starwood, while vaulting us to one of the largest lodging companies in the world, is just another step in creating a truly diversified company both in terms of brand and global presence. host hotels & resorts 2005 Similar to our existing hotels, the Starwood portfolio is geographically diverse in domestic markets with strong growth prospects and limited near-term supply. The port- folio also represents a unique opportunity to acquire high-quality international assets, particularly in Europe, which we believe are in the early stages of lodging cycle and, therefore, we have an increased opportunity for additional growth outside of our domestic markets. As part of the financing for the acquisition and to create a platform for 12 future acquisitions in Europe, we formed a joint venture to own the six hotels in Italy, Spain, Poland and the United Kingdom in which we will have a 32% ownership interest. The acquisition also provides access to key domestic markets such as Seattle and an expanded presence in other markets such as New York, Boston and San Diego, which we believe have strong growth prospects. Equally important is the continued brand diversification within our portfolio and expanding our relationship with Starwood, one of the most innovative operating and brand companies in the lodging industry. Established brand names such as Sheraton, Westin, W and St. Regis represent some of the industry’s highest-performing and innovative luxury and upper-upscale brands and are a perfect complement to our existing portfolio of premium brands. Together, the combined portfolio solidifies our position as the premier owner of luxury and upper- upscale urban and resort properties operated under world-renowned brands. [ABOVE] The Westin Palace, Milan, a Luxury Collection Hotel, represents the perfect synthesis between style and technology. The hotel embraces a refined elegance, inspired by the classical Empire-style and features 228 luxurious guest rooms—including 10 suites, which are endowed with a relaxant private Turkish bath—that will make your stay truly unforgettable. [RIGHT] The Westin Palace, Madrid, a Luxury Collection Hotel, is a monument to elegance and turn-of-the-century grandeur. Commissioned by King Alfonso XIII in 1912, it has been a favored meeting point in the Spanish capital ever since and is just minutes from the renowned El Prado and Thyssen-Bornemisza Museums. We expect our European joint venture to acquire both of these hotels in the second quarter of 2006.
  • 13.
  • 14. LOCATED ON HAWAII’S ROMANTIC AND MYSTICAL ISLAND OF MAUI, THE LUXURIOUS 806-ROOM HYATT REGENCY MAUI RESORT AND SPA OVERLOOKS 1,800 FEET OF SPARKLING WHITE SAND BEACH. A UNIQUELY ISLAND EXPERIENCE WITH TROPICAL WATERFALLS AND BRILLIANT FOLIAGE, GUESTS CAN BE PAMPERED AT THE WORLD-CLASS SPA OR EXPERIENCE THE ENERGY OF A HAWAIIAN LUAU, BUILDING MEMORIES THAT LAST A LIFETIME.
  • 15. STR ATEGIC C A P I TA L A L L O C AT ION A N D VA L U E E N H A N C E M E N T Our goal of strategically allocating capital to create long- term stockholder value through the ownership of luxury and upper-upscale properties that meet our demanding, best-in-class standards remains unchanged. The purchase of the Hyatt Regency Washington on Capitol Hill in Washington D.C., in October of 2005, is a recent example of this strategy. The hotel is located in the heart of the Nation’s capitol just a short walk from the seat of govern- ment and the National Mall, the classic example of an urban hotel in a difficult to duplicate location that meets host hotels & resorts 2005 our best-in-class standard. During 2005, we made significant progress on one of the most ambitious capital expenditure plans in our history which included spending over $100 million on reposi- tioning and return on investment (ROI) projects. These investments range in scope from the complete reposi- tioning of guest rooms, restaurants and meeting space to the development of world-class spas and exhibit halls. 16 These projects provide some of our highest investment yields and ensure that our hotels are in superior physical condition, highly competitive in the marketplace and meet our own high-quality standards. For example, in December 2005, we completed the renovation and repositioning of the Newport Beach Marriott Hotel & Spa at a cost of approximately $65 million, which included the addition of a spa, 20 new luxury suites, redesigned and renovated guestrooms, a new restaurant concept and updated meeting space. We plan on investing approximately $275 million in repositioning and ROI projects in 2006 as we accelerate our efforts to drive growth in cash flow. We have already identified, and will continue to review, investment opportunities for the Starwood portfolio that will increase cash flows and shareholder value. Capital allocation also means realizing the substantial real estate value inherent in our portfolio, as well as unlocking non-income producing assets such as at the Hyatt Regency Maui, where we are actively pursuing an opportunity to develop timeshare units on a beachfront parking lot adjacent to our hotel to maximize the value of the real estate and create shareholder value. Two recent asset sales, the Fort Lauderdale Marina Marriott and the Swissôtel The Drake, New York, which resulted in combined gain of approximately $345 million, provided the purchasers with additional development opportunities that far exceed the value of the properties as hotels. By executing on these sales and redeploying the capital into the purchase of the Starwood portfolio, we believe we have created significant value. In addition to these sales, we continue to dispose of non-core assets that are not in keeping with our long- term strategic goals, or fail to meet our on-going investment criteria, provided we can obtain satisfactory pricing. A sanctuary of quiet comfort, the Newport Beach Marriott Hotel & Spa is nestled overlooking [ABOVE] the Upper Back Bay. The recently renovated Lobby Bar, above, is just a small part of the $65 million renovation recently completed at this hotel. [RIGHT] One of the Nation’s great convention hotels, the Orlando World Center Marriott is a landmark property in central Florida. The 2,000-room hotel can satisfy even the most discerning travelers searching for the best in accommodations and recreational options close to the major Orlando attractions.
  • 16.
  • 17. THE NEWPORT BEACH MARRIOTT HOTEL & SPA OFFERS COASTAL LIVING WITH A SLEEK, MODERN STYLE. RECENTLY RENOVATED, THE HOTEL FEATURES 532 GUESTROOMS, MORE THAN 40,000 SQUARE FEET OF EVENT SPACE AND THE ALL NEW PURE BLU SPA.
  • 18. B OA R D OF DI R EC TOR S host hotels & resorts 2005 Terence C. Golden, Ann McLaughlin Korologos, John B. Morse, Jr., [BACK ROW, LEFT TO RIGHT] Judith A. McHale, Christopher J. Nassetta, Richard E. Marriott, Robert M. Baylis [FRONT ROW, LEFT TO RIGHT] 20 M A NAG E M E N T T E A M Matthew L. Richardson, Pamela K. Wagoner, Larry K. Harvey, Gregory J. Larson, Jeffrey S. Clark [BACK ROW, LEFT TO RIGHT] James F. Risoleo, Elizabeth A. Abdoo, Christopher J. Nassetta, W. Edward Walter, Minaz Abji [FRONT ROW, LEFT TO RIGHT]
  • 19. M A NAG E M E N T ’S DI S C U S S ION A N D A NA LYS I S OF R E S U LT S OF OP E R AT ION S A N D F I NA N C I A L C ON DI T ION The following discussion should be read in conjunction with Starwood Acquisition the consolidated financial statements and related notes On November 14, 2005, we announced that we had signed a included elsewhere in this report. This discussion contains for- definitive merger agreement as amended March 24, 2006 to ward-looking statements about our business. These statements acquire 35 luxury and upper-upscale hotels from Starwood for are based on current expectations and assumptions that are approximately $3.8 billion. The portfolio consists of 25 domes- subject to risks and uncertainties. Actual results could differ tic and 10 international properties and a total of 16,455 rooms materially because of factors discussed in “Forward Looking managed under the Westin®, Sheraton®, W Hotels®, The Statements” and “Risk Factors” contained in this report. Luxury Collection® and St. Regis® brands (collectively, the “Starwood Portfolio”). As part of the acquisition, we expect RECENT EVENTS AS OF APRIL 7, 2006 to assume approximately $109 million of debt and to issue Between December 2005 and February 10, 2006, we issued approximately $2.3 billion of equity (133,529,412 common 30.8 million shares of Host common stock upon conversion shares at the exchange price of $17.00 per share) to Starwood of $473 million principal amount of our Convertible stockholders. The remainder of the purchase price will be paid Subordinated Debentures and corresponding Convertible in cash. On April 5, 2006, our stockholders approved the Preferred Securities. The securities were convertible at the issuance of common stock for this transaction with over 99% option of the holder into shares of Host common stock at the of the votes cast in favor of the issuance. In connection with the rate of 3.2537 shares per $50 liquidation amount of Convertible completion of the Starwood acquisition, we intend to change Preferred Security (equivalent to a conversion price of $15.367 our name to Host Hotels & Resorts, Inc. and to change the New per share of the Company’s common stock). As of March 31, York Stock Exchange symbol that our common stock is traded 2006, $2 million of subordinated debentures and corresponding under to “HST.” host hotels & resorts 2005 preferred securities remain outstanding and the right to convert We anticipate that the initial closing on all but seven inter- those securities into Host common stock has expired. We national properties will occur on or about April 10, 2006. The intend to redeem these securities in the second quarter of 2006. acquisition is subject to certain closing conditions and also sub- On January 10, 2006, we issued mortgage debt in the ject to a number of terms and conditions that could delay or amount of $135 million Canadian Dollars ($116 million US prevent the closing of the acquisitions, or result in modifica- Dollars based on the exchange rate on the date of issuance) tions, such as the exclusion of particular hotels due to the fail- with a fixed interest rate of 5.195%. The mortgage debt is ure to obtain required consents or certain other developments. secured by four of our Canadian properties and matures on The Starwood Portfolio is comprised of luxury and upper- 21 March 1, 2011. On January 13, 2006, a portion of the proceeds upscale hotels located primarily in urban, convention or resort were used to repay the $20 million outstanding balance under destinations with an average size of approximately 500 rooms our credit facility. including five city-center hotels with over 750 rooms. The portfo- On March 29, 2006, we issued $800 million of 6 3⁄4% Series P lio is geographically diverse both domestically and internationally, senior notes due 2016. We intend to utilize the proceeds to fund with most assets located in markets with strong growth profiles a portion of the Starwood acquisition, redeem $136 million of our and limited near-term supply. The portfolio includes 10 interna- 7 7⁄8% Series B senior notes and for general corporate purposes. tional properties, which will expand our geographic distribution In 2006, we sold five properties (the Swissôtel The Drake, into new markets outside of the United States. Six hotels repre- New York; the Fort Lauderdale Marina Marriott; the Albany senting 15% of the portfolio (by revenue) are located in Europe. Marriott; the Marriott at Research Triangle Park; and the Additional hotels are located in Fiji and in Chile. As a result of the Chicago Marriott Deerfield Suites) for total proceeds of acquisition, our percentage of revenues from international hotels approximately $700 million and a total estimated gain in excess will increase from approximately 3% to approximately 4%. We of $380 million. We expect to use the proceeds from the sales to believe that many of these international markets are in the early partially fund the acquisition of the Starwood Portfolio and for stages of lodging recovery, offering the opportunity for additional other corporate purposes. growth outside of the domestic lodging cycle. In addition, we will We recently negotiated amendments to various management increase our presence in key domestic markets such as New York, agreements with Marriott International and agreed, among Boston, San Diego and Seattle as a result of this acquisition. other matters, to waive performance termination tests through We are also expanding an important relationship with the end of fiscal year 2009, to modify certain extension tests Starwood, and thereby diversifying our brand representation. which condition the manager’s ability to renew the management The portfolio consists of 17 Sheraton®, 13 Westins®, two W® agreements, and to extend certain contracts for ten additional hotels, one St. Regis® hotel, one The Luxury Collection® hotel years. As part of this negotiation, Marriott International in turn and one additional unbranded hotel. With the addition of these agreed to make a cash payment to us, to reduce an existing cap hotels, 54% of our portfolio (by revenue) will consist of on the costs and expenses related to chain services that are pro- Marriott-branded hotels, while Westin-branded hotels will rep- vided on a centralized basis, as well as to establish a cap on cer- resent 9%, up from 1% prior to the acquisition, and Sheraton tain other costs, to provide us with an incentive to increase our and W-branded hotels will represent 12% and 2%, respectively. capital expenditures at the hotels through 2008, to waive certain Currently, we do not own any Sheraton or W-branded hotels. deferred management fees, and to modify the incentive manage- In addition, we expect to work with Starwood to add value to ment fee on certain contracts. In addition, we agreed to use a the portfolio through aggressive asset management and believe portion of Marriott International’s cash payment for brand that our expanded relationship will foster additional growth reinvestment projects at various hotels in our portfolio. opportunities for both companies in the future.
  • 20. Upon completion of the acquisition, we expect to be one of Swissôtel The Drake, New York, the Fort Lauderdale Marina the largest lodging companies in the U.S. and the sixth-largest Marriott, the Albany Marriott, Chicago Marriott Deerfield public REIT. We will own 137 luxury and upper-upscale hotels Suites and the Marriott at Research Triangle Park), (ii) sales of with approximately 70,000 rooms that are affiliated with 17 joint venture interests related to the six European assets to be brands located in over 50 markets in nine countries. acquired and (iii) the issuance or other incurrence of indebted- We have received commitments from Goldman Sachs Credit ness to repay any remaining draws on the bridge loan facility. Partners, L.P., Deutsche Bank AG Cayman Islands Branch, Bank We entered into an agreement on March 24, 2006 with third of America Bridge LLC and Merrill Lynch Capital Corporation parties regarding such a joint venture in which we will retain in an aggregate amount of up to $1.39 billion, which is suffi- approximately 32% of the equity interests in the joint venture cient to fund the cash portion of the purchase price of the while obtaining approximately $560 million of financing, transactions. The bridge loan facility has a term, excluding including new debt to be issued by the joint venture but exclud- extensions, of one year. ing our portion of the capital contributions to the joint venture. We expect to permanently finance the $1.39 billion cash por- Depending upon the timing of the closing of the asset sales and tion of the purchase price for the transactions through available permanent financing transactions, proceeds therefrom may be cash and cash proceeds from a combination of (i) asset sales of used to repay the bridge loan facility. existing assets of approximately $670 million (including the The following table sets forth the location and number of rooms of hotels included in the Starwood Portfolio: Domestic Hotels CIT Y STATE COUNTRY RO OMS Sheraton New York Hotel & Towers New York NY USA 1,746 Sheraton Boston Hotel Boston MA USA 1,216 Sheraton San Diego Hotel & Marina San Diego CA USA 1,044 The Westin Seattle Seattle WA USA 891 The Westin Los Angeles Airport Los Angeles CA USA 740 host hotels & resorts 2005 W New York New York NY USA 688 The Westin Indianapolis Indianapolis IN USA 573 Sheraton Indianapolis Hotels and Suites Indianapolis IN USA 560 The Westin Mission Hills Resort & Spa Rancho Mirage CA USA 512 The Westin Cincinnati Cincinnati OH USA 456 Sheraton Stamford Hotel Stamford CT USA 448 The Westin Tabor Center Denver CO USA 430 W Seattle Seattle WA USA 426 22 The Westin South Coast Plaza Costa Mesa CA USA 390 Sheraton Milwaukee Brookfield Hotel Brookfield WI USA 389 Sheraton Braintree Hotel Braintree MA USA 374 Sheraton Parsippany Hotel Parsippany NJ USA 370 The Westin Waltham-Boston Waltham MA USA 346 The Westin Grand, Washington, D.C. Washington DC USA 263 Sheraton Suites Tampa Airport Tampa FL USA 259 Sheraton Needham Hotel Needham MA USA 247 St. Regis Hotel, Houston Houston TX USA 232 Sheraton Tucson Hotel & Suites Tucson AZ USA 216 Sheraton Providence Airport Hotel Warwick RI USA 206 Capitol Hill Suites Washington DC USA 152 Total—Domestic Hotels 13,174 International Hotels Sheraton Roma Hotel & Conference Center(1) Rome Italy 634 The Westin Palace, Madrid, a Luxury Collection Hotel(1) Madrid Spain 468 Sheraton Santiago Hotel and Convention Center Santiago Chile 379 Sheraton Skyline Hotel & Conference Centre(1) Hayes United Kingdom 350 Sheraton Warsaw Hotel & Towers(1) Warsaw Poland 350 Sheraton Fiji Resort Nadi Fiji 281 The Westin Denarau Island Resort & Spa Nadi Fiji 267 The Westin Palace, Milan, a Luxury Collection Hotel(1) Milan Italy 228 The Westin Europa & Regina(1) Venice Italy 185 San Cristobal Tower, a Luxury Collection Hotel Santiago Chile 139 Total—International Hotels 3,281 Total 16,455 (1) We anticipate that these properties will be owned by the European joint venture after the initial closing.
  • 21. OVERVIEW Corporate: This is the benchmark rate which a hotel pub- ■ lishes and offers to the general public. It is typically the Structure and Business second highest category, and is for travelers that do not As of March 1, 2006, we own 103 full-service luxury and upper- have access to negotiate or discount rates. upscale hotel properties and we are the largest hotel Real Estate Special Corporate: This is a negotiated rate offered to ■ Investment Trust, or REIT, in the National Association of Real companies and organizations that provide significant lev- Estate Investment Trust’s composite index. A REIT is a legal els of room night demand to the hotel. These rates are entity that holds real estate interests and, through payments of typically negotiated annually, at a discount to the antici- dividends to stockholders, is permitted to reduce or avoid fed- pated corporate rate. eral income taxes at the corporate level. Host operates as a self- managed and self-administered REIT and owns approximately Discount: This encompasses all discount programs, such ■ 95% of the partnership interests of Host Marriott, L.P., (Host as AAA and AARP discounts, government per diem, LP, or the Operating Partnership). rooms booked through internet distribution and whole- Our hotels are operated under brand names that are among sale channels, frequent guest program redemptions, and the most respected and widely recognized in the lodging indus- promotional rates and packages offered by a hotel. try—including Marriott®, Ritz-Carlton®, Hyatt®, Four Group demand represents clusters of guestrooms booked Seasons®, Fairmont®, Hilton® and Westin®. Approximately together, usually with a minimum of 10 rooms. Examples 85% of our hotels (as measured by sales) are currently managed include a company training session or a social event such as a by Marriott International or its affiliates and branded under the family reunion. Group business is segmented into the following Marriott or Ritz-Carlton brand names. The majority of our three key sub-categories: properties are located in central business districts of major Association: Group business related to national and ■ cities, near airports and in resort/conference destinations. The regional association meetings and conventions. target profile for our portfolio includes luxury and upper- Corporate: Group business related to corporate meetings ■ upscale full-service properties in urban and resort/conference (e.g., product launches, training programs, contract nego- destinations that benefit from significant barriers to entry by tiations, and presentations). competitors. Though hotels meeting this target profile will still host hotels & resorts 2005 be subject to competitive pressures, we believe this will allow us Other: Group business predominately related to social, mil- ■ to maintain room rate and occupancy premiums over our com- itary, education, religious, fraternity and youth and ama- petitors. We also seek to maximize the value of our portfolio teur sports teams, otherwise known as SMERF business. through aggressive asset management by assisting the managers The final segment is contract demand, which refers to of our hotels in maximizing property operations and by com- blocks of rooms sold to a specific company for an extended pleting strategic capital improvements. period of time at significantly discounted rates. Contract rates The majority of our customers fall into three broad groups: are usually utilized by hotels that are located in markets that are 23 transient business, group business, and contract business, experiencing consistently low levels of demand. Airline crews approximately 57%, 41% and 2%, respectively, of our business are typical generators of contract demand for our hotels. in 2005. Similar to the majority of the lodging industry, we fur- Our hotels are operated by third-party managers under ther categorize business within these segments based on charac- long-term agreements under which they typically earn base and teristics they have in common as follows: incentive management fees related to the revenues and prof- Transient demand broadly represents individual business or itability of each individual hotel. We provide operating funds, leisure travelers and is divided into four key sub-categories: or working capital, which the managers use to operate the premium, corporate, special corporate and discount. Overall, property, including purchasing inventory and paying wages, business travelers make up approximately 80% of transient utilities, property taxes and other expenses. We generally receive demand at our hotels, with leisure travelers making up the a cash distribution, which reflects hotel-level sales less property- remainder. Therefore, our business will be more significantly level operating expenses (excluding depreciation), from our affected by trends in business travel versus leisure demand: hotel managers each four week or monthly accounting period, Premium: Sometimes referred to as “rack rate,” typically depending on the manager. ■ consists of rooms booked close to arrival during high Hotel revenue is approximately 97% of our total revenue. demand periods and is the highest rate category available. The following table presents the components of our hotel rev- Room rates will fluctuate depending on anticipated enue as a percentage of our total revenue: demand levels (e.g. seasonality, weekday vs. weekend stays). % OF 2005 REVENUES Rooms revenue. Occupancy and average daily room rate are the major drivers of rooms revenue. The business mix of the hotel (group versus transient and premium versus discount business) is the key driver of room rates. 60% Food and beverage revenue. Occupancy and the type of customer staying at the hotel are the major drivers of food and beverage revenue (i.e., group business typically generates more food and beverage business through catering functions when compared to transient business, which may or may not utilize the hotel’s restaurants). 30% Other revenue. Occupancy, the nature of the property (i.e., resort, etc.) and its price point are the main drivers of other ancillary revenue, such as parking, golf course, spa, telephone, entertainment and other guest services. 7%
  • 22. Hotel operating expenses are approximately 98% of our total operating costs and expenses. The following table presents the components of our hotel operating expenses as a percentage of our total operating costs and expenses: % OF 2005 OPERATING COSTS AND EXPENSES Rooms expense. These costs include housekeeping, reservation systems, room supplies, laundry services and front desk costs. Occupancy is the major driver of rooms expense. These costs can increase based on increases in salaries and wages, as well as the level of service and amenities that are provided. 17% Food and beverage expense. These expenses primarily include food, beverage and labor costs. Occupancy and the type of customer staying at the hotel (i.e., catered functions generally are more profitable than outlet sales) are the major drivers of food and beverage expense, which correlates closely with food and beverage revenue. 26% Hotel departmental expense. These expenses include labor and other costs associated with the other ancillary revenues such as parking, golf courses, spas, telephones, entertainment and other guest services, as well as labor and other costs associated with administrative departments, sales and marketing, repairs and minor maintenance and utility costs. 30% Management fees. Base management fees are computed as a percentage of gross revenue as set forth in our management contracts. Incentive management fees generally are paid when operating profits exceed threshold levels established in our management agreements. 5% Other property-level expenses. These expenses consist primarily of real and personal property taxes, ground rent, equipment rent and property insurance. Many of these expenses are relatively inflexible and do not necessarily change in tandem with changes in revenues at our hotels. 9% Depreciation and amortization expense. This is a non-cash expense that is relatively inflexible and changes primarily based on the acquisition and disposition of hotel properties and the level of post-acquisition capital expenditures. 11% The expense components listed above are based on those property’s market share. For example, a RevPAR penetration host hotels & resorts 2005 presented in our consolidated statement of operations. It is also index of 100 would indicate that a hotel’s RevPAR is, on aver- worth noting that wage and benefit costs are spread among var- age, the same as its competitors. A RevPAR penetration index ious line items, however, taken separately these costs represent exceeding 100 would indicate that a hotel maintains a RevPAR approximately 50% of our total expenses, making wages and premium in relation to its competitive set, while a RevPAR pen- benefits the most significant component of our cost structure. etration index below 100 would be an indicator that a hotel is underperforming its competitive set. One critical component in Key Performance Indicators this calculation is the determination of a hotel’s competitive set. We have several key indicators that we use to evaluate the per- Factors that we consider include geographic proximity, as well 24 formance of our business. Revenue per available room, or as the level of service provided at the property. For example, a RevPAR, is a commonly used measure within the hotel industry hotel located near a convention center might have a competitive to evaluate hotel operations. RevPAR is defined as the product set that includes other hotels located in close proximity to the of the average daily room rate charged and the average daily convention center. Additionally, a luxury hotel might include occupancy achieved. RevPAR does not include revenues from other luxury or upper-upscale hotels in its competitive set but food and beverage or parking, telephone, or other guest services not economy hotels. Competitive set determinations are highly generated by the property. Although RevPAR does not include subjective, however, and our methodology for determining a these ancillary revenues, it is generally considered the leading hotel’s competitive set may differ materially from those used by indicator of core revenues for many hotels. We also use RevPAR other owners and/or managers. to evaluate the results of individual hotels between periods and We assess profitability by measuring changes in our operat- our comparable hotels. See “Comparable Hotel Operating ing margin, which is operating profit as a percentage of total Statistics” for further discussion of what we consider to be our revenue. Another key profitability indicator we use is hotel comparable hotels. adjusted operating profit which is a non-GAAP measure, and RevPAR changes driven predominately by occupancy have which is used to evaluate the profitability of our comparable different implications on overall revenue levels as well as incre- hotels. Hotel adjusted operating profit measures property-level mental operating profit than do changes driven predominately results before debt service and is a supplemental measure of by average room rate. For example, increases in occupancy at a individual property-level profitability. The comparable hotel hotel would lead to increases in rooms revenues and ancillary adjusted operating profit that we discuss is an aggregation of revenues, such as food and beverage, as well as additional incre- the adjusted operating profit for each of our comparable hotels. mental costs (including housekeeping services, utilities and See “Non-GAAP Financial Measures—Comparable Hotel room amenity costs). RevPAR increases due to higher room Operating Results” for further discussion. We also use, among rates, however, would not result in these additional room-related other things, FFO per diluted share as a supplemental measure costs. For this reason, while operating profit typically increases of company-wide profitability. See “Non-GAAP Financial when occupancy rises, RevPAR increases due to higher room Measures—FFO per Diluted Share” for further discussion. rates would have a greater impact on our profitability. Each of the non-GAAP measures should be considered by A related revenue measure for our hotels is the RevPAR investors as supplemental measures to accounting principles penetration index. The RevPAR penetration index reflects generally accepted in the United States of America, or GAAP, each property’s RevPAR in relation to the RevPAR for that prop- performance measures such as total revenues, operating profit erty’s competitive set. We use the measure as an indicator of a and earnings per unit.
  • 23. expired in 2004. One outcome of these negotiations could be Outlook potential increases in labor costs (by increased wages, benefits For 2005, RevPAR for our comparable hotels increased 9.5% as and/or changes in work rules that increase costs). Any increases compared to 2004. Improvements in RevPAR at our comparable in labor costs are likely to increase labor costs in these markets hotels for 2005 were primarily driven by significant increases in generally, including at non-union hotels, because of competi- average room rates, and, to a lesser extent, by increases in occu- tive pressure to pay market wages. Other potential affects of pancy. This is a result of a number of positive trends, such as these negotiations could include temporary disruptions in strong United States Gross Domestic Product, or GDP, growth, group bookings and/or hotel operations and it is difficult to low growth in the supply of new luxury and upper-upscale predict their outcome at this time, although we do not believe hotels and the strengthening in the group and transient seg- the outcome of these negotiations will have a material effect on ments of our business. As a result of these trends, we expect our 2006 results of operations. comparable hotel RevPAR to increase approximately 7% to 10% Operating margins are also affected by our food and bever- for full year 2006. age operations, which represented 30% of our 2005 revenues. We expect the supply growth of luxury and upper-upscale During 2005, food and beverage revenue growth at our compa- hotels to continue to be low for the next two to three years. rable hotels was 5.6%, with a food and beverage margin Although always subject to uncertainty, supply growth is increase of 0.9 percentage points. As the economy continues to relatively easier to forecast than demand growth due to the long grow, we expect food and beverage revenue to continue to permit, approval and development lead-times associated with increase, in particular catering revenue, which should result in building new full-service hotels or expanding existing full- further improvement in our operating margins. service hotels. Based on data provided by Lodging Econometrics, We also expect to see improvements in RevPAR and operat- luxury and upper-upscale hotel supply growth in the top 25 ing margins as we continue our strategy of recycling assets. U.S. markets is expected to increase by approximately 1.4% and Over the past two years, we have acquired individual luxury 1.9% in 2006 and 2007, respectively. and upper-upscale properties in urban and resort/convention The performance of our portfolio is also significantly affected destinations, where further large-scale lodging development by the results of our large hotels, including our convention typically is limited, and have disposed of individual assets pri- hotels, the majority of which are located in major urban markets. host hotels & resorts 2005 marily in suburban and secondary markets. The assets we have Convention hotels have historically outperformed in the early acquired have higher RevPAR, higher margins and, we believe, stages of an industry downturn; however, they also lag the indus- higher growth potential than those we have sold. Over time, try in performance in the early stages of recovery. This primarily these assets should contribute to improvements in overall is due to the longer booking lead-time for large group business RevPAR and margins, as well as an increase in the average per and the need for transient demand in a market to recover to room replacement cost of our portfolio. The expected RevPAR more substantial levels given a greater capacity of rooms. In for the Starwood Portfolio is roughly comparable to the 2005, we saw significant improvement in the operations of our RevPAR for our current hotel portfolio. 25 convention hotels in certain markets, such as New York City and During 2005, the average RevPAR penetration index for our Washington D.C. Our large hotels situated in weaker markets comparable hotels declined slightly as we continued to work continue to lag the portfolio, but we are beginning to see signs of with our managers to optimize the market positioning and improving market strength in several of these markets including business mix of our hotels. We believe that this decline in mar- Boston and to a lesser extent San Francisco. We have also recently ket share has occurred because: initiated major projects at our convention hotels in Atlanta and Orlando with the intention of enhancing their competitive mar- many of our hotels occupy the number one or number ■ ket position and improving performance. We expect increasing two positions in their competitive set and achieve mean- demand to continue to improve operations at our large conven- ingful RevPAR premiums. In several markets lower- tion hotels as markets strengthen, which should positively affect ranked hotels have improved their competitive position margin and RevPAR growth. (through renovation or other means) resulting in a nar- Operating margins improved in 2005, as the average room rowing of our RevPAR premium. rate increases at our hotels significantly exceeded the rate of our hotels generally have a higher percentage of their rev- ■ inflation, a trend we expect to continue. Operating margins enues generated by corporate group and corporate tran- continue to be affected, however, by certain costs, primarily sient customers than many of our competitors and that wages, benefits, utilities and sales and marketing, which business in the luxury and upper-upscale segment did not increased at a rate greater than inflation, a trend that we also begin to significantly increase until the second half of 2004; expect to continue in the near term. We expect utility costs to we have a significant number of large hotels in our port- ■ increase by over 10% in 2006, although these costs represent folio, including nine convention hotels with greater than only approximately 3.6% of our revenues. Additionally, as a 1,000 rooms, which require longer periods of time to result of the large-scale devastation due to hurricanes this year, achieve optimal group bookings and business mix. we expect insurance costs, which were approximately 1% of our As lodging demand continues to grow and, in particular, as total costs and expenses in 2005, to increase in 2006 at a rate corporate group and corporate transient business strengthens, that significantly exceeds inflation. we believe our RevPAR penetration index will improve. In addition, several markets have union contracts that While we believe the combination of improving demand expire in 2006, including New York, Hawaii, Chicago, Toronto, trends and low supply trends in the lodging industry discussed Boston and Los Angeles. The union contracts in San Francisco