1. 2002
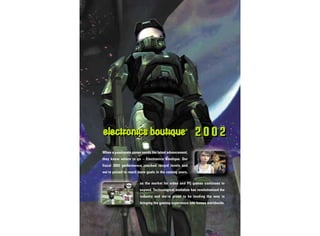
When a passionate gamer needs the latest advancement,
they know where to go – Electronics Boutique. Our
fiscal 2002 performance reached record levels and
we’re poised to reach more goals in the coming years,
as the market for video and PC games continues to
expand. Technological evolution has revolutionized the
industry and we’re proud to be leading the way in
bringing the gaming experience into homes worldwide.
2. Corporate Profile Table of Contents [03]
> > > > > > > > > > > > > > > 20
>>>>>>>>>>>>>
Electronics Boutique is celebrating its 25th birthday this year and the
party will be global. We are one of the most recognized and trusted
specialty retailers of video and PC game products in the world. At the
end of fiscal 2002, we operated 937 stores located on four continents,
which represented a 27% increase in our store base from the previ-
ous year. Our fiscal 2002 sales topped the $1 billion mark and comp
store sales increased more than 20%.
$1 billion
As we move forward, we are devoting 100% of our energy to the
market for video game and PC entertainment, which is expected to
produce annual double digit growth over the next several years. We
know the hot new game titles, and more importantly, we have those Corporate Profile. . . . . . . . . . . . . . . . . . . . . . . . . . . . . . . . . . . . . . . . . . . . . . . . . 2
titles on our shelves. This singular focus makes us the retailer of Financial Highlights . . . . . . . . . . . . . . . . . . . . . . . . . . . . . . . . . . . . . . . . . . . . . . 5
choice to the discerning gamer. Our core customers, who routinely Letter to Our Shareholders . . . . . . . . . . . . . . . . . . . . . . . . . . . . . . . . . . . . . . . . 6
The Industry Evolves . . . . . . . . . . . . . . . . . . . . . . . . . . . . . . . . . . . . . . . . . . . . . 12
visit our stores once a week, are extremely loyal because we give
Evolution Inspires Revolution . . . . . . . . . . . . . . . . . . . . . . . . . . . . . . . . . . . . . . 16
them a level of service that can’t be achieved by mass retailers.
EB Takes Leadership Role . . . . . . . . . . . . . . . . . . . . . . . . . . . . . . . . . . . . . . . . . 20
Increasing Customer Demographics . . . . . . . . . . . . . . . . . . . . . . . . . . . . . . . . 24
We combine state-of-the-art inventory management and distribution
International Expansion . . . . . . . . . . . . . . . . . . . . . . . . . . . . . . . . . . . . . . . . . . . 28
systems with highly knowledgeable sales associates, most of whom Selected Financial Data . . . . . . . . . . . . . . . . . . . . . . . . . . . . . . . . . . . . . . . . . . . 32
share a passion for games with our customers. We also have one of Management’s Discussion and Analysis of
Financial Condition and Results of Operations . . . . . . . . . . . . . . . . . . . . . . . . 36
the most cohesive and experienced senior management teams in the
Independent Auditors’ Report . . . . . . . . . . . . . . . . . . . . . . . . . . . . . . . . . . . . . . 54
industry. Combined, our senior management team has 40 years of
Consolidated Statements of Income. . . . . . . . . . . . . . . . . . . . . . . . . . . . . . . . . 55
service with Electronics Boutique. We believe these competitive Consolidated Balance Sheets . . . . . . . . . . . . . . . . . . . . . . . . . . . . . . . . . . . . . . 56
strengths, in an industry where evolution continues to fuel revolution, Consolidated Statements of Stockholders’ Equity . . . . . . . . . . . . . . . . . . . . . 58
Consolidated Statements of Cash Flows . . . . . . . . . . . . . . . . . . . . . . . . . . . . . 60
produce an outlook for the next 25 years that is looking very bright!
25 years Notes to Consolidated Financial Statements. . . . . . . . . . . . . . . . . . . . . . . . . . 64
Market for Registrant’s Common Equity and
Related Stockholder Matters . . . . . . . . . . . . . . . . . . . . . . . . . . . . . . . . . . . . . . 80
3. Financial Highlights [05]
>>>>>>>>>>>>>>>
$1,200 $50
1,000
40
800
30
600
20
400
10
200
[ Growth ]
0 0
’98 ’99 ’00 ’01 ’02 ’98 ’99 ’00 ’01 ’02*
Total Revenues Income from Operations
(dollars in millions) (dollars in millions)
*Excludes $14.9 million of restructuring and asset impairment charges.
[ ]
Operating Data 2002 2001 2000 1999 1998
Stores open at end
of period 937 737 619 528 452
Comparable store sales 20.8% (4.5%) 11.6% 14.1% 15.3%
02/02 02/03 01/29 01/30 01/31
Balance Sheet Data 2002 2001 2000 1999 1998
Total assets $425,838 $267,239 $275,513 $172,047 $142,791
Total liabilities $188,678 $136,019 $159,026 $123,205 $114,392
Stockholders’ equity $237,160 $131,220 $116,487 $ 48,842 $ 28,399
4. Letter to Our Shareholders [07]
>>>>>>>>>>>>>>>
$1.0 billion in sales
James J. Kim Sales increased 32% in fiscal 2002.
Chairman of the Board
[ ]
Evolution is often a gradual process. However, what happens when evolution fuels the of the PlayStation 2, which was released in late 2000, total industry hardware sales for
exact opposite of gradual change? What happens when evolution inspires revolution? 2001 exceeded 13 million systems.
Take one look at Pong as compared with Microsoft’s Halo and there’s no denying that In turn, we believe Electronics Boutique’s fiscal 2002 financial results are indicative of
the video game industry is on the fast track to becoming a “dominant species.” Simply our leadership position in the rapidly growing sector. Our total sales increased 32%
put, the evolution of video game technology has revolutionized the industry. The days from $770.8 million to a record $1.0 billion, with a 20.8% increase in comparable store
of two paddles and a ball are a distant memory. In their place is an industry that sales worldwide. We increased our store base by 200 stores and ended the year with
generates more than $9 billion in domestic annual sales and is expected to produce 937 stores in operation. We also completed a public stock offering that generated
annual double digit growth over the next several years. $68 million to fund our continued growth.
More than just technical advancements, today’s video games have become a lifestyle. Our strength and future success is based on selling video game and PC game products
Industry growth isn’t coming solely from the dedication of teenage boys, but rather a and therefore we have made this our sole focus. As a result, we have announced a
broader demographic of people are flocking to video games as an entertainment form. plan to sell our BC Sports Collectibles memorabilia business, as well as the elimination
Video games are revolutionizing the way entire families choose to spend their free of our EBKids store concept, which had a broader range of children’s products.
time. In the scope of things to come, video game technology is in its infancy. The Excluding the resulting $14.9 million pre-tax charge due to the sale and elimination,
revolution has just begun and that creates tremendous opportunities for Electronics net income for fiscal 2002 increased 79% to $26.9 million, or $1.11 per diluted share,
Boutique and our shareholders. compared with $14.9 million, or $0.66 per diluted share for fiscal 2001 (including the
charge, net income for fiscal 2002 was $17.7 million or $0.73 per diluted share).
During the past 18 months, Sony, Nintendo and Microsoft have all successfully
launched a new generation hardware system. Calendar 2001 was the largest The successful launches of the new PlayStation 2, GameCube, Xbox and Game Boy
hardware launch year in history with the Xbox, GameCube and Game Boy Advance Advance systems have resulted in an installed base of more than 14 million units,
selling a combined total of more than 7 million systems. When combined with sales collectively. This number is expected to grow upwards to approximately 37 million
5. Letter to Our Shareholders (cont.) > > > > > > > > > > > > > > > [09]
1,000th store
Jeffrey W. Griffiths Plan to open 200 new stores in fiscal 2003.
President and CEO
[ ]
units in the coming year. Combined with previous generation systems, it’s estimated and create demand at our stores. The pre-sell and reserve list programs ensure
that there are more than 93 million video game consoles in the United States today. that customers will get the new product on the first day it is available, because the
knowledge we gain from building the lists guides our purchasing decisions and helps
The next phase in the lifecycle of these new systems is ramped up software sales.
us secure allocations.
In other words, now that our customer has his Xbox, what’s he going to play on it?
In calendar 2002, more than 500 video-game software titles will be released into the Our trade-in program is particularly attractive to our core customers, which play an
marketplace, which is a total significantly higher than the previous year. This is an average of 19 hours per week and tend to quickly reach the highest level of a game.
enticing proposition for us given the higher margins associated with software versus Once the challenges of a game are mastered, our trade-in program encourages a
hardware and our expertise in software sales. We’ve spent decades building our customer to trade in a used game for credit towards the purchase of a new game.
operational infrastructure, honing our sales approach and listening to our customers. This creates a means for our customers to get the latest games at a lower price, a
No retailer knows the video game market better than Electronics Boutique, as significant advantage over most of our competition. We then repackage the games for
demonstrated by our above average tie ratios of 10.4 pieces of software for every resale in our stores at lower prices than new games and at more profitable margins.
piece of hardware sold, compared with an industry average of 6.7 during 2001. We
The explosive nature of the industry is creating a highly profitable market for
know what our customers want and we know how to sell it to them.
pre-owned software. In addition to the compelling economics, our involvement in the
Electronic Boutique’s specialty is getting the hot game titles, whether it’s a game for a pre-owned segment enables us to expand our reach beyond the avid gamer to the
console system or a home PC, into the hands of customers on the first day of release. more casual gamer. Casual and “first-time” gamers are often attracted to the lower
We’re successful at this goal, because unlike many competitors, our sole focus price of used games. It’s our strategy to earn the loyalty of the casual gamer as they
is on the game market. Correspondingly, we typically have a very high market share develop their love of the video game culture and graduate into our core customer
early in a new products lifecycle. One of our differentiating strengths is that we base. Approximately 75% of our planned domestic store expansion in fiscal 2003 is
have built strong pre-sell, reserve list and trade-in programs that attract avid gamers slated for stores that are best suited for the casual gaming segment.
6. Letter to Our Shareholders (cont.) > > > > > > > > > > > > > > > [11]
1 brand
Senior Management Team Implementing a master brand for all store formats.
(left to right) John Panichello, Seth Levy,
Jeffrey Griffiths, Steven Morgan, James Smith
[ ]
Electronics Boutique is a proven market leader and we are confident that we can applying a singular brand name, EB Games, to all of our operations. EB Games capital-
translate our success worldwide. We’ve operated in Canada, Australia, and New izes on the EB name and communicates our dedicated focus on the gaming business.
Zealand for several years and have recently started expansion in Europe. The The move to a master brand for all store formats within our portfolio will simplify our
European market is at a younger stage than the United States market, and is therefore brand recognition with consumers and enable us to leverage marketing dollars.
expected to grow faster. The European market is also expected to soon surpass Japan
We’d like to take this opportunity to thank all of our customers, associates and vendors
to become the world’s second largest video game market. The fragmented nature of
for helping us achieve the milestones of this past year. We’d also like to thank our
this market makes it ripe for expansion of the Electronics Boutique store model. The
shareholders for your continued support.
value of the Electronics Boutique brand is known in Europe and, as a result, during our
search for expansion channels, potential investment opportunities and partnerships With the higher profitability of software versus hardware sales, increasing demand in
often come to us. During the past year, we made a significant foothold by acquiring higher margin pre-owned segment and expansion of the international markets, we
and opening a total of 36 stores in Italy, Germany and Scandinavia. Of our goal to open have significant opportunities to grow Electronics Boutique physically and financially
200 new stores in fiscal 2003, 70 are planned for existing international markets. in the coming year.
Electronics Boutique, or EB as we’re known to the majority of our customers, is one of
the most trusted names in video game retailing worldwide. Gamers see the EB name
and they know exactly what to expect: the highest level of customer service and
satisfaction. In line with our expansion strategy, we have begun the process of
James J. Kim Jeffrey W. Griffiths
Chairman of the Board President and CEO
7. [13]
Sony PlayStation 2
2000
[ Technology ] THE FOUNDATION IS LAID: THE INDUSTRY EVOLVES
Atari didn’t create the world’s first home video game system – that
milestone belongs to the Magnavox Odyssey system. Atari does lay
claim, however, to the creation of the world’s first video game
phenomenon. Originally an arcade game, Pong invaded homes in
1974, as Atari was well on its way to becoming the fastest growing
company in the United States. To think of it today may be somewhat
astonishing, but the simplicity of a ball bouncing between two square
paddles captivated the imaginations of thousands and launched
what is today over a $9 billion industry in the United States.
Fashioned after the arcade games that inspired them, the first home
video game systems played one or two games that were built into the
system. In 1977, Atari introduced its first cartridge based system,
known as the Atari 2600, which enabled gamers to play a variety of
different games sold separately from the systems. With the creation
8. The Industry Evolves > > > > > > > > > > > > > > > [15]
Then… …Now
Atari 2600 Nintendo Sega Genesis Sony PlayStation Madden 2002 Final Fantasy X
1977 1985 1989 1995 2001 2001
[ ]
of the cartridge systems, success was not solely based on the technology of the During the next decade, technology evolved from 8-bit to 16-bit and Nintendo’s Mario
hardware, but rather the consumer appeal of…and the developers commitment battled with Sega’s Sonic the Hedgehog for market dominance. However, the next truly
to…software titles. In other words, the systems were only as successful as the games defining entrant into the market was the release of Sony’s 32-bit PlayStation in 1995.
you could play on them. As the 1970s came to a close, Atari was the dominant player in The PlayStation is widely responsible for broadening the demographics of the market
home systems with titles such as Asteroids, Missile Command and Space Invaders. because it was the first video game system that was clearly not a child’s toy. The
PlayStation was quickly adopted by college students and young adults, who were
The dawn of the 1980s saw the rise of historic arcade games such as Pac-Man,
attracted to the intellectual nature of role playing games, such as Final Fantasy, as
Donkey Kong and Frogger, just to name a few. These games eventually made
well as enhanced realistic sports games.
their way onto competing home systems from Atari, ColecoVision, Intellivision and
others. Yet it was 1985 when Nintendo, with its 8-bit NES system, ushered in the Regardless of which manufacturer’s technology became the market leader, with
next generation of systems that reinvigorated the business. each generation of system, the size of the market expanded. This is a phenomenon
that continues with the current generation of 128-bit systems. Today’s technology
In addition to having widely popular games, such as Super Mario Bros. and Tetris,
allows games to utilize special effects, such as 3D graphics, live video, and life-like
Nintendo’s NES system revolutionized the controller. Previous systems used a joystick
animations, to enhance game action. The newest generation of systems also offer
to control the action of a game, where the NES used buttons controlled by thumbs.
Internet connectivity, which enables gamers around the world to play together.
A more natural style of playing, the new controllers enabled gamers to access more
As broadband access continues to expand, the Internet connectivity feature of the
buttons, resulting in more intense action. The new style, which is the basis for today’s
latest consoles provides significant potential to increase the number of people
controllers, combined with the enhanced graphics of the new technology attracted
playing video games.
a whole new generation of gamers to the market.
9. [17]
Nintendo GameCube
2001
[ Revolution ] THE PUBLIC EMBRACES TECHNOLOGY: EVOLUTION INSPIRES REVOLUTION
Technological change in and of itself doesn’t constitute a revolution.
It’s the frenzied embrace of the technological advancements by the
masses that have turned the evolution of the video game industry into
a movement. There are upwards of 40 million video game players
in the United States, creating a market that generates more than
$9 billion in annual sales and is expected to increase to more than
$12 billion in size by the end of 2003. More importantly, these numbers
are growing, and growing very rapidly. Calendar 2001 was the largest
new system release year in history with the Xbox, GameCube and
Game Boy Advance systems selling a combined total of more than
7 million units. The Xbox and GameCube were released late in the
year and should therefore continue to sell solidly throughout 2002. As
a result, the video game segment is expected to post a double digit
annual growth from 2001 through 2003. As the retailer of choice to the
10. Evolution Inspires Revolution > > > > > > > > > > > > > > > [19]
The future
Three Major Installed Base Software Sales Positioned to capitalize on industry growth.
Hardware System Reaches New Expected to Soar
Launches Heights
[ ]
largest segment of video game consumers, Electronics Boutique is positioned to When the video game segment growth projections are broken down into hardware
capitalize on the growth dynamics of the industry. and software sales, Electronics Boutique’s outlook for the coming years is even more
compelling. Our specialty is the sale of new release software titles to avid gamers.
You don’t need to “trust” the predictions if you’re a doubting type, because the empirical For the next several years, software sales will grow faster than hardware sales. This is
evidence is strong. From 1994 to 1999, a period which includes the lifecycle of the the natural lifecycle of a new game system. Next generation software sales are
previous generation of games, such as Sega Genesis, PlayStation and Nintendo 64, expected to increase rapidly over the next several years. It’s estimated that approxi-
the compounded annual growth rate for the video game segment was 22%. mately 500 titles, or 145 million pieces of software, will be sold this year industry wide.
Highly profitable sales of pre-owned software is also expanding as a percentage of
With each generation of game consoles the market continues to expand, as new
our business.
gamers are introduced to compelling characters like Lara Croft, Zelda and Luigi and
existing gamers scramble for the latest advancements. At 2001 year end, the installed It’s logical that when the current generation of systems have reached maturity, there
base of 7 million PlayStation 2 units was achieved in half the time it took the original will be new ones ready to dazzle consumers, in a market significantly larger than
PlayStation to reach that mark. By the end of 2002, the installed base of PlayStation 2 today’s. Video games have rivaled movies as a form of American entertainment for the
units is expected to top 16 million. These expected sales trends bode well for last several years and are clearly here to stay. We will continue to exploit our growth
Electronics Boutique in the coming year, because we have high market share and tie opportunities and extend Electronics Boutique’s position in the marketplace.
ratios for software in the early stages of a new system’s lifecycle.
11. [21]
Xbox
2001
[ Leadership ] THE INDUSTRY IS GROWING: EB TAKES LEADERSHIP ROLE
Without a leader, revolution is just chaos. At Electronics Boutique,
we employ a first to market strategy that differentiates us from the
competition. Our operating strategy targets game enthusiasts, or as
we refer to them, avid gamers. It’s estimated that avid gamers repre-
sent only 11% of users, yet a whopping 53% of industry sales. These
avid gamers purchase an average of 12 game titles per year, own
multiple hardware systems, and visit our Electronics Boutique stores
an average of once a week. Because of the high volume of new titles
that they purchase, avid gamers are also highly motivated by our
trade-in program. Electronics Boutique is one of the only retailers
that offers an extensive trade-in program.
12. EB Takes Leadership Role > > > > > > > > > > > > > > > [23]
Provides Immediate Extensive Trade-in Dynamic Allocation
Access to Key Titles Program and Distribution
Systems
[ ]
Perhaps the most important characteristic of the avid gamer is that they demand Since excess inventory results in decreased profit, we have very dynamic allocation
immediate access to new release titles. This is no small feat in the video game and distribution systems that manage more than 1,200 titles from over 70 vendors in
world of double digit weekly release schedules and competitive allocations. We do each of our stores at any given time. The avid gamer doesn’t know that our leading
extensive research on new releases, determining projected demand for first week edge distribution management and replenishment system, which was updated in 2000,
sales. Our savvy in this respect is a combination of art and science, with experienced has maximized sales of new releases and diminished markdowns as titles mature. He’s
merchandising managers armed with state-of-the-art forecasting tools. We have the not impressed that the system has also reduced freight costs and improved in-stock
“know how” and relationships to make sure the right quantity of a new release is positions. The avid gamer only knows that when he wants a new game, Electronics
waiting on our shelves when the customer walks in. Boutique is the place to go.
Avid gamers
They know we have the hottest titles in stock!
13. [ Demographics ] NOT A CHILD’S TOY ANYMORE: INCREASING CUSTOMER DEMOGRAPHICS
NOT A CHILD’S TOY ANYMORE: INCREASING CUSTOMER DEMOGRAPHICS
14. Increasing Customer Demographics > > > > > > > > > > > > > > > [27]
The traditional demographic of our customer is steadily expanding. Video games are more than a product or an industry, they’re a lifestyle.
[ ]
Video games are more than a product or an industry. They’ve become a lifestyle. played endless hours of Donkey Kong after Mom finally gave into months of begging
Movies are made based on video and PC game characters. Music CDs are “inspired” for a Nintendo, are now young adults with their own disposable income. The bottom
by video games. Toys, cereals, clothing and you name it, all sport video game icons line is that video games are fun and the hectic pace of our society has placed a
and references. The logical result of the mass introduction of video games into the premium on fun.
public consciousness is that more consumers are attracted to the medium. The tradi-
Wise to the possibilities of every family that owns a car or TV just as naturally owning
tional demographic of a gamer…the teenage, tech savvy, male…is steadily expanding.
a video game system or PC, developers are stepping up production of games that
Video games have always appealed to the young, but now the appeal is steadily appeal to children, girls, young women and adult men.
attracting young adults as well. The teenage boys who fed countless quarters into
Our primary focus continues to be the avid gamer. However, we do reach out to the
Galaga, Missile Command and Pole Position games are now 35 year old executives
casual gamer through our stores that are focused on the pre-owned segment.
anxious to unwind after a stressful day at the office. Perhaps facing off on the family
Additionally, as the casual gamer matures into an avid gamer, he or she will likely
PlayStation 2 with their own children. The first generation of boys and girls who
gravitate away from mass retailers to the expertise of Electronics Boutique.
15. [29]
Game Boy Advance
2001
[ Expansion ] STRONG GROWTH OPPORTUNITIES WORLDWIDE: INTERNATIONAL EXPANSION
The explosion of the video game industry is by no means an
American phenomenon and we intend for Electronics Boutique to
be a leader in the globalization of video game retailing. We have
developed a strong international model in the decade since opening
our first store outside the United States. At fiscal 2002 year end, our
international portfolio included 92 stores in Canada, 69 stores in
Australia and 11 stores in New Zealand. We also stepped up the
expansion of our international model in fiscal 2002 to include coun-
tries such as Germany, Italy, Sweden, Norway and Denmark and
ended the year with a total of 36 stores in Europe.
The European market is particularly attractive to us because the
video game “culture” is not yet as prevalent a part of society in
Europe as compared to the United States, but that is rapidly chang-
ing. The industry is simply at a younger stage, giving us a significant
16. International Expansion > > > > > > > > > > > > > > >
new markets
Plan to open 70 international stores in fiscal 2003.
[ ]
opportunity to benefit from the expected growth in demand as Europe surpasses
WITH EB AT THE FOREFRONT
Japan to become the second largest market. Our mall-based strategy also matches
well with the high foot traffic shopping districts found in European markets.
Our goal is to open approximately 70 international stores, including 30 in Europe,
during fiscal 2003 and we will continue to be on the lookout for additional acquisition
opportunities.
It’s a very dynamic time for the industry and Electronics Boutique. More people are
playing video and computer games than ever before and the numbers are growing as
technology continues to push the boundaries of the gaming experience. We are one of
the leading speciality retailer in the electronic game segment and are positioned to
further extend our market position as the market expands worldwide. As the industry
continues to evolve, Electronics Boutique will be at the forefront of the revolution.
All industry data provided by International Development Group and Ziff Davis Media Game Group.
17. Selected Financial Data [33]
>>>>>>>>>>>>>>>
The following table sets forth for the periods indicated selected financial and other statements. This information should be read in conjunction with “Management’s
data for Electronics Boutique for periods subsequent to its initial public offering Discussion and Analysis of Financial Condition and Results of Operations” and the
on July 28, 1998. Prior periods reflect financial data of Electronics Boutique’s prede- Consolidated Financial Statements and Notes thereto included elsewhere in this
cessors, The Electronics Boutique, Inc. (“EB”) and subsidiaries and EB Services Form 10-K. The pro forma data, in the opinion of management, include all adjust-
Company LLP (“EB Services”). The statement of income data and balance sheet data, ments necessary to present fairly the information set forth therein including the
which follow, have been derived from Electronics Boutique’s consolidated financial matters referred to in footnotes 3 and 4.
Year Ended
January 31, January 30, January 29, February 3, February 2,
1998 1999 2000 2001 2002
(in thousands, except per share data and operating data)
Statement of Income Data:
Net sales $449,180 $571,042 $725,522 $766,335 $1,009,220
Management fees 4,792 3,405 4,873 4,425 5,889
Total revenues 453,972 574,447 730,395 770,760 1,015,109
Cost of goods sold 338,498 432,272 548,172 590,423 776,481
Gross profit 115,474 142,175 182,223 180,337 238,628
Operating expenses 87,003 99,972 133,534 144,466 179,464
Restructuring and asset impairment charge (1) - - - - 12,638
Depreciation and amortization 7,997 9,775 12,278 15,855 19,750
Income from operations 20,474 32,428 36,411 20,016 26,776
Equity in earnings (loss) of affiliates 2,903 (161) - - -
Other income - - - 1,550 -
Interest (income) expense, net 1,380 289 (1,427) (3,096) (1,884)
Preacquisition loss of subsidiaries (2) 913 - - - -
Income before income tax expense 22,910 31,978 37,838 24,662 28,660
Income tax expense (3) 846 11,693 15,008 9,791 10,948
Net income $ 22,064 $ 20,285 $ 22,830 $ 14,871 $ 17,712
Net income per share – basic $ 1.11 $ 0.67 $ 0.74
Weighted average shares outstanding – basic 20,559 22,254 23,868
Net income per share – diluted $ 1.10 $ 0.66 $ 0.73
Weighted average shares outstanding – diluted 20,762 22,466 24,230
18. Selected Financial Data [35]
>>>>>>>>>>>>>>>
Year Ended
January 31, January 30, January 29, February 3, February 2,
1998 1999 2000 2001 2002
Pro forma Income Data: (unaudited) (in thousands, except per share data and operating data)
Income before income taxes $ 22,910 $ 31,978
Pro forma income taxes (4) 9,415 11,866
Pro forma net income (4) $ 13,495 $ 20,112
Pro forma net income per share – basic $ 0.85 $ 1.12
Pro forma weighted average shares outstanding – basic (5) 15,794 18,030
Pro forma net income per share – diluted $ 0.85 $ 1.11
Pro forma weighted average shares outstanding – diluted (5) 15,794 18,084
Operating Data: (6) (unaudited)
Stores open at end of period 452 528 619 737 937
Comparable store sales increase (7) 15.3% 14.1% 11.6% (4.5%) 20.8%
As of
January 31, January 30, January 29, February 3, February 2,
1998 1999 2000 2001 2002
Balance Sheet Data:
Working capital (deficit) $ (17,728) $ (3,091) $ 42,567 $ 30,133 $121,446
Total assets 142,791 172,047 275,513 267,239 425,838
Total liabilities 114,392 123,205 159,026 136,019 188,678
Stockholders’ equity 28,399 48,842 116,487 131,220 237,160
(1) In fiscal 2002, Electronics Boutique adopted a plan to close its EB Kids operations and sell income taxes. Additionally, a predecessor to us elected to be treated as an S Corporation for
its BC Sports Collectibles business. The charge represents the write-down of fixed assets, some states, while remaining subject to corporate tax in other states and, as a result, the
lease termination costs, and related expenses associated with the restructuring. In addition, financial statements prior to July 28, 1998, provide for certain state income taxes. After the
a charge of $2.3 million was included in cost of goods sold for the write-down of inventory initial public offering, both federal and state taxes as a C Corporation have been reflected.
related to the restructuring. (4) The pro forma net income gives effect to the application of the pro forma income tax
(2) The results of operations of two subsidiaries, Electronics Boutique International, Inc. and expense that would have been reported had EB and EB Services been subject to federal and
Electronics Boutique Canada, Inc. have been consolidated since the beginning of the year all state income taxes for fiscal years 1998 and 1999.
ended January 31, 1998. Preacquisition loss of subsidiaries represents losses in Electronics (5) Pro forma weighted average shares outstanding gives effect to the number of shares that
Boutique International, Inc. and Electronics Boutique Canada, Inc. prior to their acquisition by would have been outstanding upon completion of the initial public offering and related
Electronics Boutique. transactions for periods prior to the initial public offering.
(3) Prior to our initial public offering, our predecessors were taxed as an S Corporation and a (6) Does not reflect stores operated by EB-UK and WaldenSoftware for which we currently
partnership. As a result, their taxable income was passed through to their partners and provide or have provided management services.
stockholders for federal income tax purposes. Accordingly, for periods prior to the initial pub- (7) Comparable store sales are based on stores in operation for over one year. Comparable store
lic offering on July 28, 1998, the financial statements do not include a provision for federal sales results for fiscal 2001 represents the 52-week period ending January 27, 2001.
19. Management’s Discussion and Analysis of Financial Condition [37]
and Results of Operations > > > > > > > > > > > > > > >
Overview Year Ended
We believe that we are among the world’s largest specialty retailers of electronic January 29, February 3, February 2,
2000 2001 2002
games. Our primary products are video games and PC entertainment software, sup-
ported by the sale of video game hardware, PC productivity software and acces- Income from operations 5.0% 2.6% 2.6%
sories. As of February 2, 2002, we operated a total of 937 stores in 46 states, Puerto Other income - 0.2 -
Rico, Australia, Canada, Denmark, Germany, New Zealand, Norway, Italy, Sweden and Interest income 0.2 0.4 0.2
South Korea – primarily under the names Electronics Boutique and EB GameWorld. Income before income tax expense 5.2 3.2 2.8
In addition, we operated a commercial web site under the URL address of Income tax expense 2.1 1.3 1.1
ebgames.com. As of such date, we also provided management services for Net income 3.1% 1.9% 1.7%
Electronics Boutique Plc (“EB-UK”), which operated over 300 stores and department
store-based concessions in the United Kingdom, Spain, France, Sweden and Ireland.
Fiscal 2002 Compared to Fiscal 2001
We are a holding company and do not have any significant assets or liabilities, other
than all of the outstanding capital stock of our subsidiaries. Net sales (including shipping and handling fees) increased by 31.7% from $766.3
million in fiscal 2001 to $1,009.2 million in fiscal 2002. Fiscal 2001 included 53
Our fiscal year ends on the Saturday nearest January 31. Accordingly the financial
weeks of net sales compared to 52 weeks in fiscal 2002 partially offsetting the
statements for the years ended January 29, 2000 (“fiscal 2000”) and February 2,
increase. The increase in net sales was primarily attributable to the additional sales
2002 (“fiscal 2002”) each include 52 weeks of operations and the year ending
volume from 200 net new stores opened during fiscal 2002 and a comparable store
February 3, 2001 (“fiscal 2001”) includes 53 weeks of operations.
sales increase of 20.8%. The increase was driven by continuing strong sales of
Sony’s PlayStation 2 hardware and related software, as well as the introduction of
Results of Operations
Nintendo’s GameBoy Advance in June 2001 and GameCube in November 2001, and
The following table sets forth certain income statement items as a percentage of Microsoft’s Xbox in November 2001.
total revenues for the periods indicated:
Management fees increased 33.1% from $4.4 million in fiscal 2001 to $5.9 million in
Year Ended
fiscal 2002. The increase in management fees earned from EB-UK in fiscal 2002 was
January 29, February 3, February 2,
due to an increase in EB-UK’s sales.
2000 2001 2002
Net sales 99.3% 99.4% 99.4% Cost of goods sold increased by 31.5% from $590.4 million in fiscal 2001 to $776.5
Management fees 0.7 0.6 0.6 million in fiscal 2002. As a percentage of net sales, cost of goods sold decreased from
77.0% in fiscal 2001 to 76.9% in fiscal 2002. The decrease in cost of goods sold, as
Total revenues 100.0 100.0 100.0
a percentage of net sales was primarily attributable to several factors such as an
Cost of goods sold 75.0 76.6 76.5
increase in high margin pre-owned sales, reduced freight costs, increased margins
Gross profit 25.0 23.4 23.5
on PC products and a successful tiered pricing strategy. These improvements were
Operating expenses 18.3 18.7 17.7
partially offset by the increased sales of low margin hardware sales and the $2.3
Restructuring and asset impairment charge - - 1.2
million charge related to the write-down of inventory associated with our decision to
Depreciation and amortization 1.7 2.1 2.0
discontinue our EB Kids operations and sell our BC Sports Collectibles business.
20. Management’s Discussion and Analysis of Financial Condition [39]
and Results of Operations (continued) > > > > > > > > > > > > > > >
Selling, general and administrative expense increased 24.2% from $144.5 million in Interest income, net, decreased by 39.2% from $3.1 million in fiscal 2001 to $1.9
fiscal 2001 to $179.5 million in fiscal 2002. The $35.0 million increase was primarily million in fiscal 2002. The decrease was due to lower interest rates on short-
attributable to the increase in our domestic and international stores base and the term investments.
associated increases in store, distribution, and headquarter expenses, which was
As a result of all the above factors, our income before income taxes increased by
partially offset by an increase in promotional and marketing reimbursements. As a
16.2% from $24.7 million in fiscal 2001 to $28.7 million in fiscal 2002.
percentage of total revenues, selling, general and administrative expense decreased
from 18.7% in fiscal 2001 to 17.7% in fiscal 2002. The decrease in selling, general Income tax expense increased by 11.8% from $9.8 million in fiscal 2001 to $10.9
and administrative expense as a percentage of total revenues was primarily attribut- million in fiscal 2002. As a percentage of pre-tax income, income tax expense
able to the increase in comparable store sales. decreased from 39.7% in fiscal 2001 to 38.2% in fiscal 2002. Our effective tax rate
has decreased from the prior year principally as a result of a reduction of state tax
Depreciation and amortization expense increased by 24.6% from $15.9 million in
expense as well as an increase in operations in foreign jurisdictions that have a
fiscal 2001 to $19.8 million in fiscal 2002. The increase was primarily attributable to
lower tax rate than the United States.
capitalized expenditures for leasehold improvements and furniture and fixtures for
new store openings, remodeling of existing stores, and capital improvements,
Fiscal 2001 Compared to Fiscal 2000
furniture and fixtures and computer software at corporate headquarters. In addition,
Net sales (including shipping and handling fees) increased by 5.6% from $725.5
in fiscal 2002, we had a full year of depreciation on our fiscal 2001 purchases of our
million in fiscal 2000 to $766.3 million in fiscal 2001. The increase in net sales was
corporate headquarters and distribution facility in West Chester, Pennsylvania,
primarily attributable to the additional sales volume from 118 net new stores opened
relocated to a larger distribution facility in Louisville, Kentucky, and built new distri-
during fiscal 2001 and that fiscal 2001 included 53 weeks of net sales compared to
bution and office facilities in Australia and Canada.
52 weeks in fiscal 2000. Offsetting the increase was a decrease in comparable
The restructuring and asset impairment charge of $12.6 million resulted from our stores sales of 4.5% for the 52-week period ending January 27, 2001. Comparable
adoption of a plan to close the operations of all 29 EB Kids stores and sell the 22 store store sales were negatively impacted primarily by declines in sales of PlayStation
BC Collectibles business. The charge represents the write-down of fixed assets, One software, Pokemon related toys and trading cards, and PC education and
lease termination costs and related expenses associated with the restructuring. productivity software, which was partially offset by increases in new generation
video game hardware and software for the Sega Dreamcast and PlayStation 2 and
Operating income increased by 33.8% from $20.0 million in fiscal 2001 to $26.8
GameBoy software.
million in fiscal 2002. As a percentage of total revenues, operating income was
unchanged at 2.6% in fiscal 2001 and 2002. Excluding the $2.3 million charge to cost Management fees decreased 9.2% from $4.9 million in fiscal 2000 to $4.4 million in
of goods sold and the $12.6 million restructuring and asset impairment charge, fiscal 2001. The decrease was primarily attributable to no performance bonus being
operating income would have been $41.7 million or 4.1% of total revenues. earned in fiscal 2001 under a consulting agreement with Border’s Group, Inc.
whereas $791,000 was recorded in fiscal 2000. In addition, lower fees were earned
Other income of $1.6 million was recorded in fiscal 2001. This income was the result
in fiscal 2001 under this agreement as fewer stores were managed in the last year
of a termination fee on the acquisition of Funco, Inc. of $3.5 million, net of associ-
of this agreement. As of February 3, 2001, the contract expired as the remaining
ated expenses of $1.9 million.
store leases ended in January 2001. Offsetting these decreases were additional
management fees earned from EB-UK in fiscal 2001 of $516,000 due to increased
sales by EB-UK.
21. Management’s Discussion and Analysis of Financial Condition [41]
and Results of Operations (continued) > > > > > > > > > > > > > > >
Cost of goods sold increased by 7.7% from $548.2 million in fiscal 2000 to $590.4 Operating income decreased by 45.0% from $36.4 million in fiscal 2000 to $20.0
million in fiscal 2001. As a percentage of net sales, cost of goods sold increased million in fiscal 2001. As a percentage of total revenues, operating income
from 75.6% in fiscal 2000 to 77.0% in fiscal 2001. The increase in cost of goods sold, decreased from 5.0% in fiscal 2000 to 2.6% in fiscal 2001, due to the increases in
as a percentage of net sales was primarily attributable to several factors such as an cost of goods sold and selling, general and administrative expense as a percentage
increase in low margin video hardware sales, particularly Sega Dreamcast and Sony of total revenues.
PlayStation 2, a decrease in sales of high margin Pokemon related toys and trading
Other income of $1.6 million was recorded in fiscal 2001. This income was the
cards, and a decrease in the gross margin on video game software. In addition,
result of a termination fee on the acquisition of Funco, Inc. of $3.5 million, net of
freight expense as a percentage of net sales increased due to the higher cost of
associated expenses of $1.9 million.
shipping large quantities of video game hardware than in the prior year and the
expediting of strong selling goods to stores to achieve maximum sell-through. Interest income, net, increased by 117% from $1.4 million in fiscal 2000 to $3.1
million in fiscal 2001. The increase was primarily due to income earned on short-
Selling, general and administrative expense increased 8.2% from $133.5 million in
term investments of the proceeds from our secondary offering completed in
fiscal 2000 to $144.5 million in fiscal 2001. As a percentage of total revenues,
November 1999.
selling, general and administrative expense increased from 18.3% in fiscal 2000 to
18.7% in fiscal 2001. The $10.9 million increase was primarily attributable to the As a result of all the above factors, our income before income taxes decreased by
increase in our domestic and international stores base and the associated increases 34.8% from $37.8 million in fiscal 2000 to $24.7 million in fiscal 2001.
in store, distribution, and headquarter expenses, which was partially offset by an
Income tax expense decreased by 34.8% from $15.0 million in fiscal 2000 to $9.8
increase in promotional and marketing reimbursements. The increase in selling,
million in fiscal 2001. As a percentage of pre-tax income, income tax expense
general and administrative expense as a percentage of total revenues was primarily
remained at 39.7% in both fiscal 2001 and fiscal 2000.
attributable to the increase in operating expenses for the factors noted above and
the decline in comparable store sales, partially offset by an increase in overall net
Seasonality and Quarterly Results
sales due to the additional new stores.
Our business, like that of most retailers, is highly seasonal. A significant portion of
Depreciation and amortization expense increased by 29.1% from $12.3 million in our net sales, management fees and profits are generated during our fourth fiscal
fiscal 2000 to $15.9 million in fiscal 2001. The increase was primarily attributable to quarter, which includes the holiday selling season. Results for any quarter are not
capitalized expenditures for leasehold improvements and furniture and fixtures for necessarily indicative of the results that may be achieved for a full fiscal year.
new store openings, remodeling of existing stores, and leasehold improvements, Quarterly results may fluctuate materially depending upon, among other factors, the
furniture and fixtures, and computer software at corporate headquarters. In addition, timing of new product introductions and new store openings, net sales contributed
in fiscal 2001, we purchased our corporate headquarters and distribution facility in by new stores, increases or decreases in comparable store sales, adverse weather
West Chester, Pennsylvania, relocated to a larger distribution facility in Louisville, conditions, shifts in the timing of certain holidays or promotions and changes in our
Kentucky, and built new distribution and office facilities in Australia and Canada. merchandise mix.
22. Management’s Discussion and Analysis of Financial Condition [43]
and Results of Operations (continued) > > > > > > > > > > > > > > >
The following table sets forth certain unaudited quarterly income statement informa- A gain of $1.6 million ($1.0 million after-tax or $0.04 per diluted share) resulting
tion for fiscal 2001 and fiscal 2002. The unaudited quarterly information includes all from the termination fee on the acquisition of Funco, Inc. was recorded in other
normal recurring adjustments that management considers necessary for a fair pres- income in the second quarter of fiscal 2001. Net loss for the 13-week period ending
entation of the information shown. July 29, 2000, excluding this charge, was $3.0 million or $0.13 per diluted share. The
Fiscal 2001 $28.0 million of operating income in the fourth quarter of fiscal 2002 includes
a $14.9 million pre-tax charge ($9.2 million after-tax or $0.35 per diluted share)
1st 2nd 3rd 4th
related to costs associated with our decision to close our EB Kids operations and sell
Quarter Quarter Quarter Quarter
our BC Sports Collectibles business. The pre-tax charge was recorded as follows:
(in thousands, except for earnings per share
$2.3 million related to a write-down of inventory within cost of goods sold and
and number of stores)
$12.6 million as a restructuring and asset impairment charge. Net income for the
Total revenues $151,479 $126,128 $159,166 $333,987
Gross profit 38,592 31,658 36,936 73,152 13-week period ended February 2, 2002, excluding this charge, was $27.0 million or
Operating income (loss) 2,938 (5,633) 1,950 20,761 $1.02 per diluted share.
Net income (loss) 2,404 (2,006) 1,394 13,080
Earnings (loss) per share
Liquidity and Capital Resources
– Basic 0.11 (0.09) 0.06 0.59
We have historically financed operations through a combination of cash generated
– Diluted 0.11 (0.09) 0.06 0.58
from operations, equity offerings and bank debt. On November 23, 1999, we com-
Stores open at quarter end 628 645 694 737
pleted a public offering of 3,500,000 shares of common stock. Of the 3,500,000
Fiscal 2002
shares sold, 2,000,000 shares were for the account of Electronics Boutique and
1st 2nd 3rd 4th 1,500,000 shares were for the account of EB Nevada Inc., a selling shareholder. The
Quarter Quarter Quarter Quarter transaction resulted in net proceeds (after offering expenses) to us of approximately
(in thousands, except for earnings per share $40.0 million.
and number of stores)
On August 14, 2001, we completed a public offering of 4,600,000 shares of common
Total revenues $179,860 $175,430 $169,282 $490,537
stock. Of the 4,600,000 shares sold, 2,500,000 shares were for the account of the
Gross profit 41,734 45,938 46,762 104,194
Operating income (loss) (2,842) (2,704) 4,289 28,033 Electronics Boutique and 2,100,000 shares were for the account of EB Nevada Inc.,
Net income (loss) (1,418) (1,532) 2,920 17,742 a selling shareholder. The transaction resulted in net proceeds (after offering
Earnings (loss) per share expenses) to us of approximately $68.2 million.
– Basic (0.06) (0.07) 0.12 0.69
– Diluted (0.06) (0.07) 0.11 0.67
Stores open at quarter end 763 813 878 937
23. Management’s Discussion and Analysis of Financial Condition [45]
and Results of Operations (continued) > > > > > > > > > > > > > > >
We generated $31.4 million in cash from operations in fiscal 2002 and $0.8 million in On March 16, 1998, our predecessor, The Electronics Boutique, Inc. (“EB”), entered
fiscal 2001. The $31.4 million of cash generated from operations in fiscal 2002 was into a credit agreement with Fleet Capital Corporation, pursuant to which Fleet
primarily the result of $17.7 million of net income, $20.0 million of non-cash charges agreed to make available an asset based revolving credit and term loan facility in an
to net income, a $32.8 million increase in accounts payable, an increase of $10.2 amount up to $50.0 million. The revolving credit facility was assigned to Electronics
million in accrued expenses and deferred rent, and a $14.1 million increase in taxes Boutique by EB. The revolving credit facility was renewed for a one-year term
payable, partially offset by a $3.6 million increase in accounts receivable, a $47.0 expiring on March 16, 2003. Interest accrues on borrowings at a per annum rate
million increase in merchandise inventories, a $9.8 million increase in deferred equal to either LIBOR plus 250 basis points or Fleet’s base rate of interest, at our
taxes, a $2.3 million increase in prepaid expenses, and a $0.7 million increase in option. The revolving credit facility is secured by certain assets, including accounts
intangible and other long-term assets. In fiscal 2002, merchandise inventories and receivable, inventory, fixtures and equipment. As of February 2, 2002, we had no
related accounts payable increased primarily due to the higher average cost of outstanding borrowings under the revolving credit facility.
products associated with the new console systems introduced in the year and also
Letters of credit outstanding with various financial institutions were $1.8 million at
due to a 27% increase in our store base over the prior year. The $0.8 million of cash
February 2, 2002.
generated from operations in fiscal 2001 was primarily the result of $14.9 million of
net income, $16.2 million of non-cash charges to net income, a $3.6 million decrease We believe that cash generated from our operating activities and available bank
in accounts receivable, and an increase of $1.3 million in accrued expenses and borrowings will be sufficient to fund our operations and store expansion programs
deferred rent, partially offset by a $19.5 million decrease in accounts payable, a for the next fiscal year.
$10.8 million increase in merchandise inventories, a $4.5 million decrease in taxes
payable, and a $0.6 million increase in prepaid expenses. The primary reason for the Related Party Transactions
decrease in accounts payable from the prior year is due to additional payments being
Transactions with Affiliates
made in January 2001 as a result of the 53-week fiscal year and our election to take
In fiscal 1996, EB entered into a services agreement with EB-UK to provide consult-
advantage of early payment discounts offered by some of our vendors.
ing, management, training, and advertising assistance, which expires on January 31,
We made capital expenditures of $23.7 million in fiscal 2002, primarily to open new 2006. The agreement was assigned to EB Services Company, LLP (“EB Services”).
stores, to remodel existing stores, to purchase and install a new inventory system in The agreement prohibits EB Services from competing in the United Kingdom or
the Louisville distribution center and to renovate and expand the Pennsylvania corpo- Ireland during the term of the agreement, and for one year after its termination. The
rate headquarters. In fiscal 2002, we also made investments of $9.2 million to agreement provides for a fee to be paid to EB Services based on a formula of 1% of
acquire various assets and businesses in several European countries including 32 adjusted sales and if budgeted profits are exceeded for the year, a bonus equal to
retail stores, distribution centers, and mail order and internet businesses. In fiscal 25% of such excess. The management fee receivable at February 3, 2001 was
2001, we made capital expenditures of $44.8 million, primarily to open new stores, $363,000 and at February 2, 2002 was $573,000; both were included in accounts
to remodel existing stores, to purchase our corporate headquarters and distribution receivable – trade and vendors. Management fees received from EB-UK for fiscal
center in West Chester, Pennsylvania, to build new distribution and office centers in 2000, fiscal 2001 and fiscal 2002 was $3,850,000, $4,366,000 and $5,955,000,
Canada and Australia, and to purchase and install new software to enhance inven- respectively. Additionally, the agreement provides that EB Services is to be reim-
tory management and allocation. bursed by EB-UK for all reasonable travel and subsistence expenses incurred during
performance of the agreement. At February 3, 2001 and February 3, 2002, there were
no outstanding balances due from EB-UK.
24. Management’s Discussion and Analysis of Financial Condition [47]
and Results of Operations (continued) > > > > > > > > > > > > > > >
Currently EB and EB Services are defendants in a lawsuit pending before the In August 2001, the FASB issued Statement No. 143 “Accounting for Asset
Chancery Division of the High Court of Justice in the United Kingdom filed by EB-UK Retirement Obligations.” This statement establishes standards for accounting for an
on March 25, 2002. EB-UK claims that, as result of certain events, including our obligation associated with the retirement of a long-lived asset. The statement is
August 2001 secondary offering, a change in control has occurred allowing it to effective for our fiscal year ending January 31, 2004. We are finalizing our review of
terminate the services agreement between EB Services and EB-UK prior to its this statement and are not expecting a material impact on our consolidated results of
expiration in 2006. No monetary damages are being sought by EB-UK. We believe we operations or financial condition.
have meritorious defenses against the suit and intend to defend the suit vigorously.
In October 2001, the FASB issued Statement No. 144, “Accounting for the Impairment
However, if EB-UK prevails and terminates the services agreement, our earnings
or Disposal of Long-Lived Assets.” This statement provides guidance for the impair-
could be significantly impacted.
ment or disposal of long-lived assets. This statement is effective for our fiscal
In June 2000, we purchased our headquarters and its primary distribution center, year ending February 1, 2003. We are finalizing our review of this statement and
which are located in a single 140,000 square foot building on several acres in West are not expecting a material impact on our consolidated results of operations or
Chester, Pennsylvania, from EB Nevada Inc. for $6,700,000. financial condition.
Recent Accounting Pronouncements Critical Accounting Policies and Estimates
In July 2001, the Financial Accounting Standards Board (“FASB”) issued Statement The discussion and analysis of our financial condition and results of operations are
No. 141, “Business Combinations,” and Statement No. 142, “Goodwill and Other based upon our consolidated financial statements, which have been prepared in
Intangible Assets.” Statement 141 requires that intangible assets acquired in a accordance with accounting principles generally accepted in the United States
purchase method business combination must meet certain criteria to be recognized of America. The preparation of these financial statements requires us to make
and reported apart from goodwill and should be used for all business combinations estimates and assumptions that affect the reported amounts of assets, liabilities,
initiated after June 30, 2001. Statement 142 states that goodwill and intangible revenues and expenses. Actual results may differ from those estimates. Our signifi-
assets with indefinite useful lives no longer be amortized, but instead be tested for cant accounting policies can be found in the Notes to Consolidated Financial
impairment at least annually. Our adoption of Statement 141 in fiscal 2002 did not Statements (Note 1). We consider the following policies to be most critical to the
have a material impact on our financial statements. portrayal of our financial condition and results of operations.
Inventory Valuation
As of February 2, 2002, we had net unamortized goodwill and identifiable intangible
Merchandise inventories are valued at the lower of cost or market. The cost is deter-
assets of $8.7 million, all of which will be subject to the annual impairment test.
mined principally by a weighted average method. The weighted average cost method
$1.0 million of the net goodwill and intangible assets were from previous year’s
attaches a cost to each stock keeping unit (“SKU”) and is a blended average of the
activity and the remaining $7.7 million relates to international acquisitions in fiscal
original purchase price and those of subsequent purchases or other cost adjustments
2002. Amortization of goodwill was $257,000 in fiscal 2002. We are currently
throughout the life cycle of that SKU.
assessing the impact of Statement 142, which will be adopted in fiscal 2003.
25. Management’s Discussion and Analysis of Financial Condition [49]
and Results of Operations (continued) > > > > > > > > > > > > > > >
Inherent in the video game business is the risk of obsolete inventory. As the new Revenues for management services are recorded as earned. In fiscal 2002, all
generation of products is introduced, demand for the prior generation decreases, management fees earned were derived under a services agreement with EB-UK.
thus reducing interest and value of the older games. Some vendors offer us credit to
Restructuring Costs
reduce the cost of products that are selling more slowly thus allowing for a reduction
We announced our plan to close all of our 29 EB Kids stores and sell our 22 store
in the selling price and reducing the possibility for items to become obsolete. We
BC Sports Collectibles business.
monitor the aging of our inventory by item and provide a reserve for product that is
considered “slow moving,” using an established formula based on current inventory We plan to offer alternative job opportunities to associates who may be displaced as
and a trailing sales history. We also monitor the difference between the selling a result of these actions. It is expected that a number of the EB Kids stores will be
(“market”) price of each item and its cost and provide a reserve for any differences converted to the Electronics Boutique format. The converting of the EB Kids stores to
below such cost. the Electronics Boutique format or closing of the remaining stores is expected to be
completed by June 1, 2002.
We perform regular physical inventories and cycle counts in both our stores
and distribution centers to adjust inventory balances and account for shrink and We have retained a financial advisor to assist in the sale of the BC Sports
damaged product. An accrual for estimated loss is recorded between the timing of Collectibles business and expects to complete a transaction by the end of the second
these counts. fiscal quarter. We continue to operate and incur expenses while we seek a purchaser
of these stores. There can be no assurances that we will be able to identify a
Reserves of $1,947,000 and $2,696,000 were recorded against inventory as of
purchaser and close a sale to that purchaser within this, or any, time frame.
February 3, 2001 and February 2, 2002, respectively. Management believes its inven-
tory valuation system results in carrying inventory at the lower of cost or market. As a result of these decisions, we recorded a $14.9 million pre-tax charge in the
fiscal fourth quarter and year ended February 2, 2002, consisting of the write-down
Revenue Recognition and Related Policies
of fixed assets and inventory, estimated lease termination costs, and related
We derive revenue primarily from two sources: (i) product revenue, which includes
expenses. To determine the charge, management made various estimates and
the retail sale of merchandise inventory, warranties, and shipping and handling fees
assumptions regarding the fair values of fixed assets and inventories, as well as
and (ii) management services revenue. Sales are recorded net of estimated amounts
estimating the costs associated with terminating certain leases. Actual costs could
for sales returns and other allowances.
differ from these estimates. If this occurs, we will adjust our accrual accordingly.
Retail sales are recognized as revenue at the point of sale. Mail order and internet
Income Taxes
sales are recognized as revenue upon shipment. Revenues from shipping and
We are subject to income tax in many jurisdictions, including the United States,
handling are recorded in revenue and recognized upon shipment. Warranty revenue
states and localities, and internationally. Income taxes are calculated in accordance
is amortized over the life of the warranty contract.
with Statement of Financial Standard No. 109, “Accounting for Income Taxes,” which
requires the use of the asset and liability method. Deferred tax assets and liabilities
We also engage in the sale and trading of pre-owned video game products. Credit is
are recognized based on the difference between the financial statement carrying
issued for the assigned value of the pre-owned products accepted for trade against
amounts of existing assets and liabilities and their respective tax bases. Inherent in
the purchase of other products. This treatment results in the reporting of lower
the measurement of deferred balances are certain judgments and interpretations
revenue and cost of goods sold. However, there is no impact on gross profit.
of enacted tax law and published guidance with respect to applicability to our
operations. Significant examples of this concept include capitalization policies for
![Corporate Profile Table of Contents [03]
> > > > > > > > > > > > > > > 20
>>>>>>>>>>>>>
Electronics Boutique is celebrating its 25th birthday this year and the
party will be global. We are one of the most recognized and trusted
specialty retailers of video and PC game products in the world. At the
end of fiscal 2002, we operated 937 stores located on four continents,
which represented a 27% increase in our store base from the previ-
ous year. Our fiscal 2002 sales topped the $1 billion mark and comp
store sales increased more than 20%.
$1 billion
As we move forward, we are devoting 100% of our energy to the
market for video game and PC entertainment, which is expected to
produce annual double digit growth over the next several years. We
know the hot new game titles, and more importantly, we have those Corporate Profile. . . . . . . . . . . . . . . . . . . . . . . . . . . . . . . . . . . . . . . . . . . . . . . . . 2
titles on our shelves. This singular focus makes us the retailer of Financial Highlights . . . . . . . . . . . . . . . . . . . . . . . . . . . . . . . . . . . . . . . . . . . . . . 5
choice to the discerning gamer. Our core customers, who routinely Letter to Our Shareholders . . . . . . . . . . . . . . . . . . . . . . . . . . . . . . . . . . . . . . . . 6
The Industry Evolves . . . . . . . . . . . . . . . . . . . . . . . . . . . . . . . . . . . . . . . . . . . . . 12
visit our stores once a week, are extremely loyal because we give
Evolution Inspires Revolution . . . . . . . . . . . . . . . . . . . . . . . . . . . . . . . . . . . . . . 16
them a level of service that can’t be achieved by mass retailers.
EB Takes Leadership Role . . . . . . . . . . . . . . . . . . . . . . . . . . . . . . . . . . . . . . . . . 20
Increasing Customer Demographics . . . . . . . . . . . . . . . . . . . . . . . . . . . . . . . . 24
We combine state-of-the-art inventory management and distribution
International Expansion . . . . . . . . . . . . . . . . . . . . . . . . . . . . . . . . . . . . . . . . . . . 28
systems with highly knowledgeable sales associates, most of whom Selected Financial Data . . . . . . . . . . . . . . . . . . . . . . . . . . . . . . . . . . . . . . . . . . . 32
share a passion for games with our customers. We also have one of Management’s Discussion and Analysis of
Financial Condition and Results of Operations . . . . . . . . . . . . . . . . . . . . . . . . 36
the most cohesive and experienced senior management teams in the
Independent Auditors’ Report . . . . . . . . . . . . . . . . . . . . . . . . . . . . . . . . . . . . . . 54
industry. Combined, our senior management team has 40 years of
Consolidated Statements of Income. . . . . . . . . . . . . . . . . . . . . . . . . . . . . . . . . 55
service with Electronics Boutique. We believe these competitive Consolidated Balance Sheets . . . . . . . . . . . . . . . . . . . . . . . . . . . . . . . . . . . . . . 56
strengths, in an industry where evolution continues to fuel revolution, Consolidated Statements of Stockholders’ Equity . . . . . . . . . . . . . . . . . . . . . 58
Consolidated Statements of Cash Flows . . . . . . . . . . . . . . . . . . . . . . . . . . . . . 60
produce an outlook for the next 25 years that is looking very bright!
25 years Notes to Consolidated Financial Statements. . . . . . . . . . . . . . . . . . . . . . . . . . 64
Market for Registrant’s Common Equity and
Related Stockholder Matters . . . . . . . . . . . . . . . . . . . . . . . . . . . . . . . . . . . . . . 80](data:image/gif;base64,R0lGODlhAQABAIAAAAAAAP///yH5BAEAAAAALAAAAAABAAEAAAIBRAA7)