1. Clear Channel Reports First Quarter 2005 Results
San Antonio, Texas April 29, 2005…Clear Channel Communications, Inc. (NYSE: CCU) today reported
results for its first quarter ended March 31, 2005. The Company will hold a conference call today at 9:00 a.m.
Eastern/8:00 a.m. Central Time to discuss first quarter results and its strategic realignment plan also
announced separately today.
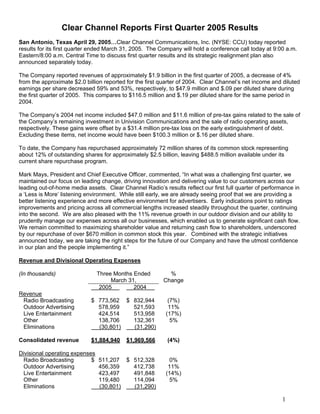
The Company reported revenues of approximately $1.9 billion in the first quarter of 2005, a decrease of 4%
from the approximate $2.0 billion reported for the first quarter of 2004. Clear Channel’s net income and diluted
earnings per share decreased 59% and 53%, respectively, to $47.9 million and $.09 per diluted share during
the first quarter of 2005. This compares to $116.5 million and $.19 per diluted share for the same period in
2004.
The Company’s 2004 net income included $47.0 million and $11.6 million of pre-tax gains related to the sale of
the Company’s remaining investment in Univision Communications and the sale of radio operating assets,
respectively. These gains were offset by a $31.4 million pre-tax loss on the early extinguishment of debt.
Excluding these items, net income would have been $100.3 million or $.16 per diluted share.
To date, the Company has repurchased approximately 72 million shares of its common stock representing
about 12% of outstanding shares for approximately $2.5 billion, leaving $488.5 million available under its
current share repurchase program.
Mark Mays, President and Chief Executive Officer, commented, “In what was a challenging first quarter, we
maintained our focus on leading change, driving innovation and delivering value to our customers across our
leading out-of-home media assets. Clear Channel Radio’s results reflect our first full quarter of performance in
a ‘Less is More’ listening environment. While still early, we are already seeing proof that we are providing a
better listening experience and more effective environment for advertisers. Early indications point to ratings
improvements and pricing across all commercial lengths increased steadily throughout the quarter, continuing
into the second. We are also pleased with the 11% revenue growth in our outdoor division and our ability to
prudently manage our expenses across all our businesses, which enabled us to generate significant cash flow.
We remain committed to maximizing shareholder value and returning cash flow to shareholders, underscored
by our repurchase of over $670 million in common stock this year. Combined with the strategic initiatives
announced today, we are taking the right steps for the future of our Company and have the utmost confidence
in our plan and the people implementing it.”
Revenue and Divisional Operating Expenses
Three Months Ended %
(In thousands)
March 31, Change
2005 2004
Revenue
Radio Broadcasting $ 773,562 $ 832,944 (7%)
Outdoor Advertising 578,959 521,593 11%
Live Entertainment 424,514 513,958 (17%)
Other 138,706 132,361 5%
Eliminations (30,801) (31,290)
Consolidated revenue $1,884,940 $1,969,566 (4%)
Divisional operating expenses
Radio Broadcasting $ 511,207 $ 512,328 0%
Outdoor Advertising 456,359 412,738 11%
Live Entertainment 423,497 491,848 (14%)
Other 119,480 114,094 5%
Eliminations (30,801) (31,290)
1
2. Consolidated divisional
operating expenses $1,479,742 $1,499,718 (1%)
Included in the Company’s 2005 revenue and divisional operating expenses are foreign exchange increases of
approximately $25.1 million and $23.3 million for the first quarter of 2005 as compared to the same period of
2004.
Radio Broadcasting
The Company’s radio broadcasting revenues declined 7% during the first quarter of 2005 as compared to the
first quarter of 2004. The decline is primarily due to a reduction in overall commercial minutes, offset by
average rate increases. The Company experienced an equivalent decline on a percentage basis in both local
and national advertising. Most of the advertising categories were down for the first quarter, with the largest
dollar declines coming from automotive, telecommunications and entertainment. In addition, non-cash trade
revenues declined during the first quarter of 2005 as compared to the first quarter of 2004. Clear Channel
Radio continued the implementation of the Less is More initiative in the first quarter of 2005. As part of the
Less is More initiative, the Company is reshaping the radio business model with a shift from primarily offering
the traditional 60-second commercial to shorter length commercials. Adoption by advertisers of the shorter
length commercials has varied by market with the overall adoption rate slower than originally anticipated. The
Company expects that this will improve as the year continues.
The Company’s radio broadcasting divisional operating expenses were essentially flat for the first quarter of
2005 as compared to the first quarter of last year. Clear Channel Radio saw declines in both trade and bonus
expenses, associated with the decline in revenue, partially offset by an increase in programming expenses.
Programming expenses were up primarily as a result of an increase in music license fees.
Outdoor Advertising
Clear Channel Outdoor advertising revenue increased $57.4 million during the first quarter of 2005 as
compared to the same quarter of 2004. The growth includes approximately $18.8 million from foreign
exchange increases. Both of the Company’s domestic and international operations contributed to the revenue
growth. The Company’s domestic revenue growth was lead by bulletins as well as gains from mall, airport,
and taxi advertisements. Driving the growth in bulletin revenue was an increase in average rate, with
occupancy slightly down. Both rate and occupancy for posters were up for the first quarter as compared to the
same quarter of 2004. Strong domestic advertising categories for the first quarter of 2005 included automotive,
entertainment, financial services, retail and telecommunications.
The Company’s first quarter international revenue growth was lead by street furniture and transit revenues,
with billboard revenues essentially flat as compared to the first quarter of 2004. The street furniture business
was particularly strong in Italy, Australia, the United Kingdom and Belgium. Driving the first quarter increase in
street furniture and transit revenues were increases in average revenue per display, as well as the number of
street furniture and transit displays being up slightly as compared to the same quarter of 2004. Billboards saw
a slight increase in the average revenue per display during the first quarter of 2005 as compared to the same
quarter of the prior year.
Divisional operating expenses increased $43.6 million during the first quarter of 2005 as compared to the same
quarter of 2004. The growth includes approximately $17.4 million from foreign exchange increases. The
remainder of the increase is primarily associated with an increase in production and site lease expenses.
Live Entertainment
Live entertainment revenue decreased 17% during the first quarter of 2005 as compared to the first quarter of
2004 primarily as a result of a decline in ticket revenue. Ticket revenues were down as a result of significantly
fewer arena shows and due to the mix of events in the current quarter compared to the first quarter of the prior
year. During the first quarter of 2004, the Company had large arena shows like Bette Midler and Britney
2
3. Spears, with no comparable events in the first quarter of 2005. Ancillary revenues from concessions and
merchandising were also down as a result of a lower number of shows. The declines were partially offset by
an increase of $6.3 million related to foreign exchange.
Divisional operating expenses declined 14% for the quarter ended March 31, 2005 as compared to the
same quarter of 2004. The decline was associated with the decline in revenues. The decrease was
partially offset by an increase of $5.9 million related to foreign exchange.
Selected Balance Sheet Information
Selected balance sheet information for 2005 and 2004 was:
March 31, December 31,
2005 2004
(In millions)
Cash $ 271.3 $ 210.5
Total Current Assets $ 2,316.6 $ 2,269.9
Net Property, Plant and Equipment $ 4,040.5 $ 4,124.3
Total Assets $ 19,769.7 $ 19,927.9
Current Liabilities (excluding current portion of long-term debt) $ 1,897.0 $ 1,767.3
Long-Term Debt (including current portion of long-term debt) $ 7,732.8 $ 7,379.8
Shareholders’ Equity $ 8,850.0 $ 9,488.1
Capital Expenditures
Capital expenditures for the first quarter of 2005 and 2004 were:
March 31, 2005 March 31, 2004
(In millions)
Non-revenue producing $ 46.0 $ 30.6
Revenue producing 35.5 40.2
Total capital expenditures $ 81.5 $ 70.8
The Company defines non-revenue producing capital expenditures as those expenditures that are required on
a recurring basis. Revenue producing capital expenditures are discretionary capital investments for new
revenue streams, similar to an acquisition.
Liquidity and Financial Position
For the quarter ended March 31, 2005, cash flow from operating activities was $380.0 million, cash flow used
by investing activities was $65.5 million, and cash flow used in financing activities was $253.7 million for a net
increase in cash of $60.8 million.
At March 31, 2005, Clear Channel had long-term debt of:
March 31, 2005
(In millions)
Bank Credit Facilities $ 764.6
Public Notes 6,804.4
Other Debt 163.8
Total $ 7,732.8
3
4. Leverage, defined as debt * , net of cash, divided by the trailing 12-month pro forma EBITDA ** , was 3.3x at
March 31, 2005.
As of March 31, 2005, 72% of the Company’s debt bears interest at fixed rates while 28% of the Company’s
debt bears interest at floating rates based upon LIBOR. The Company’s weighted average cost of debt at
March 31, 2005 was 5.6%.
As of April 29, 2005, the Company had approximately $600.4 million available on its bank credit facility. The
Company has €195.6 million of public debt maturing during 2005. The Company may utilize existing capacity
under its bank facility and other available funds for general working capital purposes including funding capital
expenditures, acquisitions, stock repurchases and the refinancing of certain public debt securities. Capacity
under the facility can also be used to support commercial paper programs. Redemptions or repurchases of
securities will occur through open market purchases, privately negotiated transactions, or other means.
Conference Call
The Company will host a teleconference to discuss its results today at 9:00 a.m. Eastern Time. The conference
call number is 888-578-6632 and the pass code is 6664378. Please call ten minutes in advance to ensure that
you are connected prior to the presentation. The teleconference will also be available via a live audio cast on
the Company's website, located at www.clearchannel.com. A replay of the call will be available for 72 hours
after the live conference call. The replay number is 888-203-1112 and the pass code is 6664378. The audio
cast will also be archived on the Company's website and will be available beginning 24 hours after the call for a
period of one week.
*
As defined by Clear Channel’s credit facility, debt is long-term debt of $7,732.8 million plus letters of credit of $155 million; guarantees of third party
debt of $14 million; net original issue discount/premium of $10 million; deferred purchase consideration of $11 million included in other long-term
liabilities; plus the fair value of interest rate swaps of $23 million; and less purchase accounting premiums of $13 million.
**
As defined by Clear Channel’s credit facility, pro forma EBITDA is the trailing twelve-month EBITDA adjusted to include EBITDA of any assets
acquired in the trailing twelve-month period.
4
5. FINANCIAL HIGHLIGHTS
Clear Channel Communications, Inc. and Subsidiaries
(Unaudited)
(In thousands, except per share data)
Three Months Ended
March 31, %
2005 Change
2004
$ 1,969,566
Revenue $ 1,884,940 (4.3%)
1,479,742
Divisional operating expenses 1,499,718
51,417
Corporate expenses 49,364
1,764
Non-cash compensation expense 918
173,392
Depreciation and amortization 173,158
178,625 (27.5%)
Operating Income 246,408
106,783
Interest expense 89,805
(1,073)
Gain (loss) on marketable securities 49,723
6,143
Equity in earnings of nonconsolidated affiliates 6,675
2,231
Other income (expense) - net (17,270)
79,143
Income before income taxes 195,731
Income tax benefit (expense):
(1,339)
Current (145,985)
(29,922)
Deferred 66,714
$ 47,882 (58.9%)
Net Income $ 116,460
Basic and Diluted earnings per share:
$0.19
Basic: $.09 (52.6%)
Diluted: $.09 $0.19 (52.6%)
Weighted average shares outstanding - Diluted 560,956 619,628
The Company’s 2004 net income included $47.0 million and $11.6 million of pre-tax gains related to the sale of
the Company’s remaining investment in Univision Communications and the sale of radio operating assets,
respectively. These gains were offset by a $31.4 million pre-tax loss on the early extinguishment of debt.
Excluding these items, net income would have been $100.3 million or $.16 per diluted share.
During the first quarter of 2004, current tax expense included $199.4 million related to the Company’s sale of
its remaining investment in Univision and certain radio operating assets. Also, included in current tax expense
for the first quarter of 2004 is a tax benefit of approximately $67.5 million related to the tax loss on the
Company’s early extinguishment of debt.
Deferred taxes for the first quarter of 2004 include the reversal of $176.0 million related to the Company’s sale
of its remaining investment in Univision and a $54.3 million expense related to its early extinguishment of debt.
5
6. Supplemental Disclosure Regarding Non-GAAP Financial Information
Operating Income before Depreciation and Amortization (D&A) and Non-cash Compensation Expense
The following tables set forth Clear Channel's Operating Income, D&A and Non-cash compensation expense
for the three months ended March 31, 2005 and 2004. The Company defines quot;Operating Income before D&A
and Non-cash compensation expense” as net income adjusted to exclude the following line items presented in
its Statement of Operations: Income tax benefit (expense); Other income (expense) - net; Equity in earnings of
nonconsolidated affiliates; Gain (loss) on marketable securities; Interest expense; D&A; and, Non-cash
compensation expense.
The Company uses Operating Income before D&A and Non-cash compensation expense, among other things,
to evaluate the Company's operating performance. This measure is among the primary measures used by
management for planning and forecasting of future periods, as well as for measuring performance for
compensation of executives and other members of management. This measure is an important indicator of the
Company's operational strength and performance of its business because it provides a link between
profitability and cash flows from operating activities. It is also a primary measure used by management in
evaluating companies as potential acquisition targets.
The Company believes the presentation of this measure is relevant and useful for investors because it allows
investors to view performance in a manner similar to the method used by the Company's management. It helps
improve investors’ ability to understand the Company's operating performance and makes it easier to compare
the Company's results with other companies that have different capital structures or tax rates. In addition, this
measure is also among the primary measures used externally by the Company's investors, analysts and peers
in its industry for purposes of valuation and comparing the operating performance of the Company to other
companies in its industry. Additionally, the Company’s bank credit facilities use this measure for compliance
with leverage covenants.
Since Operating Income before D&A and Non-cash compensation expense is not a measure calculated in
accordance with GAAP, it should not be considered in isolation of, or as a substitute for, net income as an
indicator of operating performance and may not be comparable to similarly titled measures employed by other
companies. Operating Income, D&A and Non-cash compensation expense are all financial statement line
items included on the Company’s statement of earnings. Operating Income before D&A and Non-cash
compensation expense is not necessarily a measure of the Company's ability to fund its cash needs. As it
excludes certain financial information compared with operating income and net income (loss), the most directly
comparable GAAP financial measure, users of this financial information should consider the types of events
and transactions, which are excluded.
As required by the SEC, the Company provides reconciliations below of Operating Income before D&A and
Non-cash compensation expense for each segment to such segment's operating income; Operating Income
before D&A and Non-cash compensation expense to net income, the most directly comparable amounts
reported under GAAP; and, Net Income and Diluted Earnings Per Share excluding certain items discussed
earlier.
6
7. Non-cash Operating Income before
Operating compensation Depreciation D&A and Non-cash
(In thousands)
income (loss) expense and amortization compensation expense
Three Months Ended March 31, 2005
Radio Broadcasting $ 226,449 $ 212 $ 35,694 $ 262,355
⎯
Outdoor Advertising 24,334 98,266 122,600
⎯
Live Entertainment (16,520) 17,537 1,017
⎯
Other 2,016 17,210 19,226
Corporate (57,654) 1,552 4,685 (51,417)
Consolidated $ 178,625 $ 1,764 $ 173,392 $ 353,781
Three Months Ended March 31, 2004
Radio Broadcasting $ 282,564 $ 261 $ 37,791 $ 320,616
⎯
Outdoor Advertising 9,105 99,750 108,855
⎯
Live Entertainment 6,562 15,548 22,110
⎯
Other 3,541 14,726 18,267
Corporate (55,364) 657 5,343 (49,364)
Consolidated $ 246,408 $ 918 $ 173,158 $ 420,484
Reconciliation of Net Income and Diluted Earnings Per Share (“EPS”)
Quarter Ended March 31, Quarter Ended March 31,
(In millions, except per share data)
2005 2004
Net Income EPS Net Income EPS
Reported Amounts $ 47.9 $ .09 $ 116.5 $ 0.19
(Gain) on asset sales (11.6) (0.02)
(Gain) on UVN (47.0) (0.08)
Loss on early extinguishment of
debt 31.4 0.05
Current and deferred tax effects 11.0 0.02
Amounts excluding certain items $ 47.9 $ .09 $ 100.3 $ 0.16
UVN = Univision Communications Inc.
7
8. Reconciliation of Operating Income before Depreciation and amortization (D&A) and Non-cash
compensation expense to Net income
(In thousands) Three Months Ended
March 31,
2005 2004
Operating Income before D&A and Non-cash
compensation expense 353,781 $ 420,484
Non-cash compensation expense 1,764 918
Depreciation & amortization 173,392 173,158
Operating Income 178,625 246,408
Interest expense 106,783 89,805
Gain (loss) on marketable securities (1,073) 49,723
Equity in earnings of nonconsolidated affiliates 6,143 6,675
Other income (expense) – net 2,231 (17,270)
Income before income taxes 79,143 195,731
Income tax (expense) benefit:
Current (1,339) (145,985)
Deferred (29,922) 66,714
Net Income $ 47,882 $ 116,460
About Clear Channel Communications
Clear Channel Communications, Inc. (NYSE:CCU) is a global media and entertainment company specializing
in quot;gone from homequot; entertainment and information services for local communities and premiere opportunities
for advertisers. Based in San Antonio, Texas, the company's businesses include radio, outdoor displays, live
entertainment events and venues, and television stations. See us on the web at www.clearchannel.com.
For further information contact:
Investors - Randy Palmer, Senior Vice President of Investor Relations, (210) 832-3315 or
Media – Lisa Dollinger, Senior Vice President of Corporate Communications, (210) 832-3474
or visit our web-site at http://www.clearchannel.com.
Certain statements in this document constitute “forward-looking statements” within the meaning of the Private
Securities Litigation Reform Act of 1995. Such forward-looking statements involve known and unknown risks,
uncertainties and other factors which may cause the actual results, performance or achievements of Clear
Channel Communications to be materially different from any future results, performance or achievements
expressed or implied by such forward-looking statements. The words or phrases “guidance,” “believe,”
“expect,” “anticipate,” “estimates” and “forecast” and similar words or expressions are intended to identify such
forward-looking statements. In addition, any statements that refer to expectations or other characterizations of
future events or circumstances are forward-looking statements. The Company cannot provide any assurance
that the IPO of Clear Channel Outdoor, the spin-off of Clear Channel Entertainment or the payment of the one-
time/special dividend will be completed, or the terms of which all of the transactions will be consummated.
Various risks that could cause future results to differ from those expressed by the forward-looking statements
included in this document include, but are not limited to: risks inherent in the contemplated IPO, spin-off, cash
dividends or borrowings; costs related to the proposed transactions; distraction of the Company and its
management team as a result of the proposed transactions; changes in business, political and economic
conditions in the U.S. and in other countries in which Clear Channel Communications currently does business
(both general and relative to the advertising and entertainment industries); fluctuations in interest rates; changes
in operating performance; shifts in population and other demographics; changes in the level of competition for
advertising dollars; fluctuations in operating costs; technological changes and innovations; changes in labor
8
9. conditions; changes in governmental regulations and policies and actions of regulatory bodies; fluctuations in
exchange rates and currency values; changes in tax rates; and changes in capital expenditure requirements;
access to capital markets and changes in credit ratings. Other unknown or unpredictable factors also could have
material adverse effects on Clear Channel Communications’, Clear Channel Outdoor’s and Clear Channel
Entertainment’s future results, performance or achievements. In light of these risks, uncertainties, assumptions
and factors, the forward-looking events discussed in this document may not occur. You are cautioned not to
place undue reliance on these forward-looking statements, which speak only as of the date stated, or if no date is
stated, as of the date of this document. Other key risks are described in Clear Channel Communications’ reports
filed with the U.S. Securities and Exchange Commission, including in the section entitled “Item 1. Business –
Risk Factors” of the Company’s Annual Report on Form 10-K for the year ended December 31, 2004. Except as
otherwise stated in this document, Clear Channel Communications does not undertake any obligation to publicly
update or revise any forward-looking statements because of new information, future events or otherwise.
A registration statement relating to the IPO of Clear Channel Outdoor common stock and an information
statement relating to the spin-off of Clear Channel Entertainment will be filed with the Securities and Exchange
Commission.
This document shall not constitute an offer to sell or the solicitation of an offer to buy any securities, nor shall
there be any sale of Clear Channel Outdoor common stock in any state in which such offer, solicitation or sale
would be unlawful prior to registration or qualification under the securities laws of any such state. Any such
offering of securities will be made only by means of a prospectus included in the registrations statement filed
with the Securities and Exchange Commission.
9