Famous No1 Amil Baba Love marriage Astrologer Specialist Expert In Pakistan a...
United Health Group [PDF Document] Consolidated Financial Statements
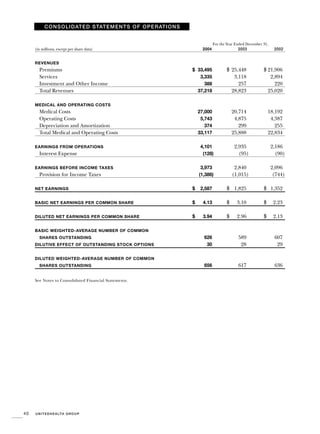
1. C O N S O L I D AT E D S TAT E M E N T S O F O P E R AT I O N S
For the Year Ended December 31,
2004 2003 2002
(in millions, except per share data)
REVENUES
$ 25,448 $ 21,906
Premiums $ 33,495
Services 3,118 2,894
3,335
Investment and Other Income 257 220
388
Total Revenues 28,823 25,020
37,218
MEDICAL AND OPERATING COSTS
Medical Costs 20,714 18,192
27,000
Operating Costs 4,875 4,387
5,743
Depreciation and Amortization 299 255
374
Total Medical and Operating Costs 25,888 22,834
33,117
2,935 2,186
4,101
EARNINGS FROM OPERATIONS
Interest Expense (95) (90)
(128)
2,840 2,096
3,973
EARNINGS BEFORE INCOME TAXES
Provision for Income Taxes (1,015) (744)
(1,386)
$ 1,825 $ 1,352
$ 2,587
NET EARNINGS
$ $
3.10 2.23
$ 4.13
BASIC NET EARNINGS PER COMMON SHARE
$
$ 2.96 2.13
$ 3.94
DILUTED NET EARNINGS PER COMMON SHARE
BASIC WEIGHTED-AVERAGE NUMBER OF COMMON
589 607
626
SHARES OUTSTANDING
28 29
30
DILUTIVE EFFECT OF OUTSTANDING STOCK OPTIONS
DILUTED WEIGHTED-AVERAGE NUMBER OF COMMON
617 636
656
SHARES OUTSTANDING
See Notes to Consolidated Financial Statements.
40 U N I T E D H E A LT H G R O U P
2. C O N S O L I D AT E D B A L A N C E S H E E T S
As of December 31,
2004 2003
(in millions, except per share data)
ASSETS
Current Assets
$
Cash and Cash Equivalents 2,262
$ 3,991
Short-Term Investments 486
514
Accounts Receivable, net of allowances of $101 and $88 745
906
Assets Under Management 2,019
1,930
Deferred Income Taxes 269
353
Other Current Assets 339
547
Total Current Assets 6,120
8,241
Long-Term Investments 6,729
7,748
Property, Equipment and Capitalized Software, net of accumulated
depreciation and amortization of $660 and $538 1,032
1,139
Goodwill 3,509
9,470
Other Intangible Assets, net of accumulated amortization of $103 and $43 180
1,205
Other Assets 64
76
$ 17,634
$ 27,879
TOTAL ASSETS
LIABILITIES AND SHAREHOLDERS’ EQUITY
Current Liabilities
$
Medical Costs Payable 4,152
$ 5,540
Accounts Payable and Accrued Liabilities 1,575
2,107
Other Policy Liabilities 2,117
1,933
Commercial Paper and Current Maturities of Long-Term Debt 229
673
Unearned Premiums 695
1,076
Total Current Liabilities 8,768
11,329
Long-Term Debt, less current maturities 1,750
3,350
Future Policy Benefits for Life and Annuity Contracts 1,517
1,669
Deferred Income Taxes and Other Liabilities 471
814
Commitments and Contingencies (Note 12)
Shareholders’ Equity
Common Stock, $0.01 par value – 1,500 shares authorized;
643 and 583 shares outstanding 6
6
Additional Paid-In Capital 58
3,095
Retained Earnings 4,915
7,484
Accumulated Other Comprehensive Income:
Net Unrealized Gains on Investments, net of tax effects 149
132
5,128
10,717
TOTAL SHAREHOLDERS’ EQUITY
$ 17,634
$ 27,879
TOTAL LIABILITIES AND SHAREHOLDERS’ EQUITY
See Notes to Consolidated Financial Statements.
41
U N I T E D H E A LT H G R O U P
3. CONSOLIDATED STATEMENTS OF CHANGES IN SHAREHOLDERS’ EQUITY
Additional Net Unrealized Total
Common Stock Paid-In Retained Gains on Shareholders’ Comprehensive
(in millions) Shares Amount Capital Earnings Investments Equity Income
$ $ $ 3,805 $ $ 3,891
617 6 36 44
BALANCE AT DECEMBER 31, 2001
Issuances of Common Stock,
and related tax benefits 26 – 905 – – 905
Common Stock Repurchases (44) – (771) (1,044) – (1,815)
Comprehensive Income
$ 1,352
Net Earnings – – – 1,352 – 1,352
Other Comprehensive Income Adjustments
Change in Net Unrealized Gains
on Investments, net of tax effects – – – – 104 104 104
$1,456
Comprehensive Income
Common Stock Dividend – – – (9) – (9)
599 6 170 4,104 148 4,428
BALANCE AT DECEMBER 31, 2002
Issuances of Common Stock,
and related tax benefits 17 – 490 – – 490
Common Stock Repurchases (33) – (602) (1,005) – (1,607)
Comprehensive Income
$ 1,825
Net Earnings – – – 1,825 – 1,825
Other Comprehensive Income Adjustments
Change in Net Unrealized Gains
on Investments, net of tax effects – – – – 1 1 1
$ 1,826
Comprehensive Income
Common Stock Dividend – – – (9) – (9)
583 6 58 4,915 149 5,128
BALANCE AT DECEMBER 31, 2003
Issuances of Common Stock,
and related tax benefits 111 1 6,482 – – 6,483
Common Stock Repurchases (51) (1) (3,445) – – (3,446)
Comprehensive Income
Net Earnings – – – 2,587 – 2,587 $ 2,587
Other Comprehensive Income Adjustments
Change in Net Unrealized Gains
on Investments, net of tax effects – – – – (17) (17) (17)
Comprehensive Income $ 2,570
Common Stock Dividend – – – (18) – (18)
643 $ 6 $ 3,095 $ 7,484 $ 132 $10,717
BALANCE AT DECEMBER 31, 2004
See Notes to Consolidated Financial Statements.
42 U N I T E D H E A LT H G R O U P
4. C O N S O L I D AT E D S TAT E M E N T S O F C A S H F L O W S
For the Year Ended December 31,
2004 2003 2002
(in millions)
OPERATING ACTIVITIES
$ $
Net Earnings 1,825 1,352
$ 2,587
Noncash Items
Depreciation and Amortization 299 255
374
Deferred Income Taxes and Other 91 154
125
Net Change in Other Operating Items, net of effects
from acquisitions, and changes in AARP balances
Accounts Receivable and Other Current Assets (46) 83
(30)
Medical Costs Payable 276 74
322
Accounts Payable and Accrued Liabilities 460 423
586
Other Policy Liabilities 87 70
37
Unearned Premiums 11 12
134
3,003 2,423
4,135
CASH FLOWS FROM OPERATING ACTIVITIES
INVESTING ACTIVITIES
Cash Paid for Acquisitions, net of cash assumed and other effects (590) (302)
(2,225)
Purchases of Property, Equipment and Capitalized Software (352) (419)
(350)
Purchases of Investments (2,583) (3,246)
(3,190)
Maturities and Sales of Investments 2,780 2,576
4,121
(745) (1,391)
(1,644)
CASH FLOWS USED FOR INVESTING ACTIVITIES
FINANCING ACTIVITIES
Proceeds from (Payments of) Commercial Paper, net (382) (223)
194
Proceeds from Issuance of Long-Term Debt 950 400
2,000
Payments for Retirement of Long-Term Debt (350) –
(150)
Common Stock Repurchases (1,607) (1,815)
(3,446)
Proceeds from Common Stock Issuances 268 205
583
Dividends Paid (9) (9)
(18)
Other 4 –
75
(1,126) (1,442)
(762)
CASH FLOWS USED FOR FINANCING ACTIVITIES
1,132 (410)
1,729
INCREASE (DECREASE) IN CASH AND CASH EQUIVALENTS
1,130 1,540
2,262
CASH AND CASH EQUIVALENTS, BEGINNING OF PERIOD
$ $
2,262 1,130
$ 3,991
CASH AND CASH EQUIVALENTS, END OF PERIOD
SUPPLEMENTAL SCHEDULE OF NONCASH INVESTING AND FINANCING ACTIVITIES
$ $
Common Stock Issued for Acquisitions – 567
$ 5,557
See Notes to Consolidated Financial Statements.
43
U N I T E D H E A LT H G R O U P