SlideShare a Scribd company logo
1 of 4
Download to read offline
Consolidated Balance Sheets

     As of December 31 (In thousands, except share amounts)                                                                                                                                                                                                                                                                                                                                                                                                                                      2001             2000

                                                                                                                                                                                                                                                                                       Assets

     Current assets
         Cash and cash equivalents . .             .   .   .   .   .   .   .   .   .   .   .   .   .   .   .   .   .   .   .   .   .   .   .   .   .   .   .   .   .   .   .   .   .   .   .   .   .   .   .   .   .   .   .   .   .   .   .   .   .   .   .   .   .   .   .   .   .   .   .   .   .   .   .   .   .   .   .   .   .   .   .   .   .   .   .   .   .   .   .   .   .   .   .   .   .   .   .   .   .   .   .   .   .   .   .   .   .   .   .   .   .   .   .   .   .   .$     208,971     $    227,968
         Accounts receivable, net . . .            .   .   .   .   .   .   .   .   .   .   .   .   .   .   .   .   .   .   .   .   .   .   .   .   .   .   .   .   .   .   .   .   .   .   .   .   .   .   .   .   .   .   .   .   .   .   .   .   .   .   .   .   .   .   .   .   .   .   .   .   .   .   .   .   .   .   .   .   .   .   .   .   .   .   .   .   .   .   .   .   .   .   .   .   .   .   .   .   .   .   .   .   .   .   .   .   .   .   .   .   .   .   .   .   .   .      144,374          236,650
         Inventories . . . . . . . . . . . . .     .   .   .   .   .   .   .   .   .   .   .   .   .   .   .   .   .   .   .   .   .   .   .   .   .   .   .   .   .   .   .   .   .   .   .   .   .   .   .   .   .   .   .   .   .   .   .   .   .   .   .   .   .   .   .   .   .   .   .   .   .   .   .   .   .   .   .   .   .   .   .   .   .   .   .   .   .   .   .   .   .   .   .   .   .   .   .   .   .   .   .   .   .   .   .   .   .   .   .   .   .   .   .   .   .   .       78,037           86,279
         Income tax receivable . . . . .           .   .   .   .   .   .   .   .   .   .   .   .   .   .   .   .   .   .   .   .   .   .   .   .   .   .   .   .   .   .   .   .   .   .   .   .   .   .   .   .   .   .   .   .   .   .   .   .   .   .   .   .   .   .   .   .   .   .   .   .   .   .   .   .   .   .   .   .   .   .   .   .   .   .   .   .   .   .   .   .   .   .   .   .   .   .   .   .   .   .   .   .   .   .   .   .   .   .   .   .   .   .   .   .   .   .       12,077           11,264
         Deferred income taxes . . . . .           .   .   .   .   .   .   .   .   .   .   .   .   .   .   .   .   .   .   .   .   .   .   .   .   .   .   .   .   .   .   .   .   .   .   .   .   .   .   .   .   .   .   .   .   .   .   .   .   .   .   .   .   .   .   .   .   .   .   .   .   .   .   .   .   .   .   .   .   .   .   .   .   .   .   .   .   .   .   .   .   .   .   .   .   .   .   .   .   .   .   .   .   .   .   .   .   .   .   .   .   .   .   .   .   .   .      148,845          162,934
         Prepaid expenses and other .              .   .   .   .   .   .   .   .   .   .   .   .   .   .   .   .   .   .   .   .   .   .   .   .   .   .   .   .   .   .   .   .   .   .   .   .   .   .   .   .   .   .   .   .   .   .   .   .   .   .   .   .   .   .   .   .   .   .   .   .   .   .   .   .   .   .   .   .   .   .   .   .   .   .   .   .   .   .   .   .   .   .   .   .   .   .   .   .   .   .   .   .   .   .   .   .   .   .   .   .   .   .   .   .   .   .       69,623           70,549
            Total current assets . . . . .         .   .   .   .   .   .   .   .   .   .   .   .   .   .   .   .   .   .   .   .   .   .   .   .   .   .   .   .   .   .   .   .   .   .   .   .   .   .   .   .   .   .   .   .   .   .   .   .   .   .   .   .   .   .   .   .   .   .   .   .   .   .   .   .   .   .   .   .   .   .   .   .   .   .   .   .   .   .   .   .   .   .   .   .   .   .   .   .   .   .   .   .   .   .   .   .   .   .   .   .   .   .   .   .   .   .      661,927          795,644

     Property and equipment, net. . . . . . . . . . . . . . . . . . . . . . . . . . . . . . . . . . . . . . . . . . . . . . . . . . . . . . . . . . . . . . . . . . . . . . . . . . . . . . . . . . . . . . . . . . . . . . . . . . . . . . . . . . . .                                                                                                                                                                                                                                     8,891,645         9,064,233

     Other assets
         Investment in unconsolidated affiliates                               .   .   .   .   .   .   .   .   .   .   .   .   .   .   .   .   .   .   .   .   .   .   .   .   .   .   .   .   .   .   .   .   .   .   .   .   .   .   ......                  .   .   .   .   .   .   .   .   .   .   .   .   .   .   .   .   .   .   .   .   .   .   .   .   .   .   .   .   .   .   .   .   .   .   .   .   .   .   .   .   .   .   .   .   .   .   .   .   .   .   .   .   .   .   .      632,949          521,807
         Goodwill, net . . . . . . . . . . . . . . . . . . .                   .   .   .   .   .   .   .   .   .   .   .   .   .   .   .   .   .   .   .   .   .   .   .   .   .   .   .   .   .   .   .   .   .   .   .   .   .   .   ......                  .   .   .   .   .   .   .   .   .   .   .   .   .   .   .   .   .   .   .   .   .   .   .   .   .   .   .   .   .   .   .   .   .   .   .   .   .   .   .   .   .   .   .   .   .   .   .   .   .   .   .   .   .   .   .      103,059           54,281
         Deposits and other assets, net . . . . . .                            .   .   .   .   .   .   .   .   .   .   .   .   .   .   .   .   .   .   .   .   .   .   .   .   .   .   .   .   .   .   .   .   .   .   .   .   .   .   ......                  .   .   .   .   .   .   .   .   .   .   .   .   .   .   .   .   .   .   .   .   .   .   .   .   .   .   .   .   .   .   .   .   .   .   .   .   .   .   .   .   .   .   .   .   .   .   .   .   .   .   .   .   .   .   .      207,863          298,636
            Total other assets. . . . . . . . . . . . . .                      .   .   .   .   .   .   .   .   .   .   .   .   .   .   .   .   .   .   .   .   .   .   .   .   .   .   .   .   .   .   .   .   .   .   .   .   .   .   ......                  .   .   .   .   .   .   .   .   .   .   .   .   .   .   .   .   .   .   .   .   .   .   .   .   .   .   .   .   .   .   .   .   .   .   .   .   .   .   .   .   .   .   .   .   .   .   .   .   .   .   .   .   .   .   .      943,871          874,724
                                                                                                                                                                                                                                                                                                                                                                                                                                                                                           $10,497,443    $ 10,734,601

                                                                                                                                                                                                                                       Liabilities and Stockholders’ Equity

     Current liabilities
         Accounts payable . . . . . . . . . . . . .                    .   .   .   .   .   .   .   .   .   .   .   .   .   .   .   .   .   .   .   .   .   .   .   .   .   .   .   .   .   .   .   .   .   .   .   .   .   .   .   .   .   .   .   .   .   .   .   .   .   .   .   .   .   .   .   .   .   .   .   .   .   .   .   .   .   .   .   .   .   .   .   .   .   .   .   .   .   .   .   .   .   .   .   .   .   .   .   .   .   .   .   .   .   .   .   .   .   .   .   .   .$      75,787     $      65,317
         Current portion of long-term debt . .                         .   .   .   .   .   .   .   .   .   .   .   .   .   .   .   .   .   .   .   .   .   .   .   .   .   .   .   .   .   .   .   .   .   .   .   .   .   .   .   .   .   .   .   .   .   .   .   .   .   .   .   .   .   .   .   .   .   .   .   .   .   .   .   .   .   .   .   .   .   .   .   .   .   .   .   .   .   .   .   .   .   .   .   .   .   .   .   .   .   .   .   .   .   .   .   .   .   .   .   .   .      168,079           521,308
         Accrued interest on long-term debt .                          .   .   .   .   .   .   .   .   .   .   .   .   .   .   .   .   .   .   .   .   .   .   .   .   .   .   .   .   .   .   .   .   .   .   .   .   .   .   .   .   .   .   .   .   .   .   .   .   .   .   .   .   .   .   .   .   .   .   .   .   .   .   .   .   .   .   .   .   .   .   .   .   .   .   .   .   .   .   .   .   .   .   .   .   .   .   .   .   .   .   .   .   .   .   .   .   .   .   .   .   .       78,938            77,738
         Other accrued liabilities . . . . . . . . .                   .   .   .   .   .   .   .   .   .   .   .   .   .   .   .   .   .   .   .   .   .   .   .   .   .   .   .   .   .   .   .   .   .   .   .   .   .   .   .   .   .   .   .   .   .   .   .   .   .   .   .   .   .   .   .   .   .   .   .   .   .   .   .   .   .   .   .   .   .   .   .   .   .   .   .   .   .   .   .   .   .   .   .   .   .   .   .   .   .   .   .   .   .   .   .   .   .   .   .   .   .      565,106           568,842
            Total current liabilities . . . . . . . .                  .   .   .   .   .   .   .   .   .   .   .   .   .   .   .   .   .   .   .   .   .   .   .   .   .   .   .   .   .   .   .   .   .   .   .   .   .   .   .   .   .   .   .   .   .   .   .   .   .   .   .   .   .   .   .   .   .   .   .   .   .   .   .   .   .   .   .   .   .   .   .   .   .   .   .   .   .   .   .   .   .   .   .   .   .   .   .   .   .   .   .   .   .   .   .   .   .   .   .   .   .      887,910         1,233,205

     Deferred income taxes. . . . . . . . . . . . . . . . . . . . . . . . . . . . . . . . . . . . . . . . . . . . . . . . . . . . . . . . . . . . . . . . . . . . . . . . . . . . . . . . . . . . . . . . . . . . . . . . . . . . . . . . . . . . . . . . .                                                                                                                                                                                                                                 1,746,272         1,730,158
     Long-term debt. . . . . . . . . . . . . . . . . . . . . . . . . . . . . . . . . . . . . . . . . . . . . . . . . . . . . . . . . . . . . . . . . . . . . . . . . . . . . . . . . . . . . . . . . . . . . . . . . . . . . . . . . . . . . . . . . . . . . .                                                                                                                                                                                                                              5,295,313         5,348,320
     Other long-term obligations . . . . . . . . . . . . . . . . . . . . . . . . . . . . . . . . . . . . . . . . . . . . . . . . . . . . . . . . . . . . . . . . . . . . . . . . . . . . . . . . . . . . . . . . . . . . . . . . . . . . . . . . . . . .                                                                                                                                                                                                                                       57,248           40,473


     Commitments and contingencies

     Stockholders’ equity
         Common stock, $.01 par value: authorized 300,000,000 shares, issued 163,685,876
            and 163,189,205 shares; outstanding 157,396,176 and 159,130,205 shares . . . . . . . . . . . . . . . . . . . .                                                                                                                                                             .   .   .   .   .   .   .   ...         .   .   .   .   .   .   .   .   .   .   .   .   .   .   .   .   .   .   .   .   .   .   .   .   .   .   .   .   .   .   .   .   .   .   .   .   .   .   .         1,637           1,632
         Capital in excess of par value . . . . . . . . . . . . . . . . . . . . . . . . . . . . . . . . . . . . . . . . . . . . . . . . . . . . . . . . .                                                                                                                              .   .   .   .   .   .   .   ...         .   .   .   .   .   .   .   .   .   .   .   .   .   .   .   .   .   .   .   .   .   .   .   .   .   .   .   .   .   .   .   .   .   .   .   .   .   .   .    2,049,841        2,041,820
         Treasury stock, at cost (6,289,700 and 4,059,000 shares) . . . . . . . . . . . . . . . . . . . . . . . . . . . . . . . . . . . .                                                                                                                                              .   .   .   .   .   .   .   ...         .   .   .   .   .   .   .   .   .   .   .   .   .   .   .   .   .   .   .   .   .   .   .   .   .   .   .   .   .   .   .   .   .   .   .   .   .   .   .      (129,399)        (83,683)
         Retained earnings . . . . . . . . . . . . . . . . . . . . . . . . . . . . . . . . . . . . . . . . . . . . . . . . . . . . . . . . . . . . . . . . .                                                                                                                           .   .   .   .   .   .   .   ...         .   .   .   .   .   .   .   .   .   .   .   .   .   .   .   .   .   .   .   .   .   .   .   .   .   .   .   .   .   .   .   .   .   .   .   .   .   .   .       597,771         427,956
         Other comprehensive loss . . . . . . . . . . . . . . . . . . . . . . . . . . . . . . . . . . . . . . . . . . . . . . . . . . . . . . . . . . .                                                                                                                                .   .   .   .   .   .   .   ...         .   .   .   .   .   .   .   .   .   .   .   .   .   .   .   .   .   .   .   .   .   .   .   .   .   .   .   .   .   .   .   .   .   .   .   .   .   .   .        (9,150)         (5,280)
            Total stockholders’ equity . . . . . . . . . . . . . . . . . . . . . . . . . . . . . . . . . . . . . . . . . . . . . . . . . . . . . . . . . .                                                                                                                             .   .   .   .   .   .   .   ...         .   .   .   .   .   .   .   .   .   .   .   .   .   .   .   .   .   .   .   .   .   .   .   .   .   .   .   .   .   .   .   .   .   .   .   .   .   .   .    2,510,700        2,382,445
                                                                                                                                                                                                                                                                                                                                                                                                                                                                                           $10,497,443    $ 10,734,601
     The accompanying notes are an integral part of these consolidated financial statements.


30
Consolidated Statements of Income

Year ended December 31 (In thousands, except per share amounts)                                                                                                                                                                                                                                                                                                                               2001             2000             1999

Revenues
    Casino . . . . . . . . . . . . . . . . . . . . . .           .   .   .   .   .   .   .   .   .   .   .   .   .   .   .   .   .   .   .   .   .   .   .   .   .   .   .   .   .   .   .   .   .   .   .   .   .   .   .   ......                  .   .   .   .   .   .   .   .   .   .   .   .   .   .   .   .   .   .   .   .   .   .   .   .   .   .   .   .   .   .   .   .
                                                                                                                                                                                                      . $ 2,163,808                                                                                                                                                                                    $ 1,785,978      $     818,992
    Rooms . . . . . . . . . . . . . . . . . . . . . .            .   .   .   .   .   .   .   .   .   .   .   .   .   .   .   .   .   .   .   .   .   .   .   .   .   .   .   .   .   .   .   .   .   .   .   .   .   .   .   ......                  .   .   .   .   .   .   .   .   .   .   .   .   .   .   .   .   .   .   .   .   .   .   .   .   .   .   .   .   .   .   .   .
                                                                                                                                                                                                      .     846,215                                                                                                                                                                                        614,707            258,364
    Food and beverage . . . . . . . . . . . . .                  .   .   .   .   .   .   .   .   .   .   .   .   .   .   .   .   .   .   .   .   .   .   .   .   .   .   .   .   .   .   .   .   .   .   .   .   .   .   .   ......                  .   .   .   .   .   .   .   .   .   .   .   .   .   .   .   .   .   .   .   .   .   .   .   .   .   .   .   .   .   .   .   .
                                                                                                                                                                                                      .     723,745                                                                                                                                                                                        511,180            178,300
    Entertainment, retail and other . . . . .                    .   .   .   .   .   .   .   .   .   .   .   .   .   .   .   .   .   .   .   .   .   .   .   .   .   .   .   .   .   .   .   .   .   .   .   .   .   .   .   ......                  .   .   .   .   .   .   .   .   .   .   .   .   .   .   .   .   .   .   .   .   .   .   .   .   .   .   .   .   .   .   .   .
                                                                                                                                                                                                      .     646,105                                                                                                                                                                                        457,898            187,803
    Income from unconsolidated affiliate .                       .   .   .   .   .   .   .   .   .   .   .   .   .   .   .   .   .   .   .   .   .   .   .   .   .   .   .   .   .   .   .   .   .   .   .   .   .   .   .   ......                  .   .   .   .   .   .   .   .   .   .   .   .   .   .   .   .   .   .   .   .   .   .   .   .   .   .   .   .   .   .   .   .
                                                                                                                                                                                                      .      36,816                                                                                                                                                                                         22,068              6,084
                                                                                                                                                                                                          4,416,689                                                                                                                                                                                      3,391,831          1,449,543
    Less – promotional allowances . . . . . . . . . . . . . . . . . . . . . . . . . . . . . . . . . . . . . . . . . . . . . . . . . . . . . . . . . . . . . . . . . . . . . . . . . . . . . . . . . . .     407,071                                                                                                                                                                                        286,343            112,606
                                                                                                                                                                                                          4,009,618                                                                                                                                                                                      3,105,488          1,336,937
Expenses
    Casino . . . . . . . . . . . . . . . . . .   .   .   .   .   .   .   .   .   .   .   .   .   .   .   .   .   .   .   .   .   .   .   .   .   .   .   .   .   .   .   .   .   .   .   .   .   .   .   .   .   .   .   .   .   .   .   .   .   .   .   .   .   .   .   .   .   .   .   .   .   .   .   .   .   .   .   .   .   .   .   .   .   .   .   .   .   .   .   .   .   .   .    1,127,065          859,305          392,174
    Rooms . . . . . . . . . . . . . . . . . .    .   .   .   .   .   .   .   .   .   .   .   .   .   .   .   .   .   .   .   .   .   .   .   .   .   .   .   .   .   .   .   .   .   .   .   .   .   .   .   .   .   .   .   .   .   .   .   .   .   .   .   .   .   .   .   .   .   .   .   .   .   .   .   .   .   .   .   .   .   .   .   .   .   .   .   .   .   .   .   .   .   .      239,725          183,760           82,862
    Food and beverage . . . . . . . . .          .   .   .   .   .   .   .   .   .   .   .   .   .   .   .   .   .   .   .   .   .   .   .   .   .   .   .   .   .   .   .   .   .   .   .   .   .   .   .   .   .   .   .   .   .   .   .   .   .   .   .   .   .   .   .   .   .   .   .   .   .   .   .   .   .   .   .   .   .   .   .   .   .   .   .   .   .   .   .   .   .   .      415,015          297,602          103,022
    Entertainment, retail and other .            .   .   .   .   .   .   .   .   .   .   .   .   .   .   .   .   .   .   .   .   .   .   .   .   .   .   .   .   .   .   .   .   .   .   .   .   .   .   .   .   .   .   .   .   .   .   .   .   .   .   .   .   .   .   .   .   .   .   .   .   .   .   .   .   .   .   .   .   .   .   .   .   .   .   .   .   .   .   .   .   .   .      425,536          287,665          113,848
    Provision for doubtful accounts.             .   .   .   .   .   .   .   .   .   .   .   .   .   .   .   .   .   .   .   .   .   .   .   .   .   .   .   .   .   .   .   .   .   .   .   .   .   .   .   .   .   .   .   .   .   .   .   .   .   .   .   .   .   .   .   .   .   .   .   .   .   .   .   .   .   .   .   .   .   .   .   .   .   .   .   .   .   .   .   .   .   .       71,244           42,016           19,597
    General and administrative . . . .           .   .   .   .   .   .   .   .   .   .   .   .   .   .   .   .   .   .   .   .   .   .   .   .   .   .   .   .   .   .   .   .   .   .   .   .   .   .   .   .   .   .   .   .   .   .   .   .   .   .   .   .   .   .   .   .   .   .   .   .   .   .   .   .   .   .   .   .   .   .   .   .   .   .   .   .   .   .   .   .   .   .      597,899          438,082          203,775
    Preopening expenses and other                .   .   .   .   .   .   .   .   .   .   .   .   .   .   .   .   .   .   .   .   .   .   .   .   .   .   .   .   .   .   .   .   .   .   .   .   .   .   .   .   .   .   .   .   .   .   .   .   .   .   .   .   .   .   .   .   .   .   .   .   .   .   .   .   .   .   .   .   .   .   .   .   .   .   .   .   .   .   .   .   .   .        5,106            5,624           71,496
    Restructuring costs . . . . . . . . .        .   .   .   .   .   .   .   .   .   .   .   .   .   .   .   .   .   .   .   .   .   .   .   .   .   .   .   .   .   .   .   .   .   .   .   .   .   .   .   .   .   .   .   .   .   .   .   .   .   .   .   .   .   .   .   .   .   .   .   .   .   .   .   .   .   .   .   .   .   .   .   .   .   .   .   .   .   .   .   .   .   .       23,721           23,519               —
    Write-downs and impairments .                .   .   .   .   .   .   .   .   .   .   .   .   .   .   .   .   .   .   .   .   .   .   .   .   .   .   .   .   .   .   .   .   .   .   .   .   .   .   .   .   .   .   .   .   .   .   .   .   .   .   .   .   .   .   .   .   .   .   .   .   .   .   .   .   .   .   .   .   .   .   .   .   .   .   .   .   .   .   .   .   .   .       47,955          102,225               —
    Depreciation and amortization .              .   .   .   .   .   .   .   .   .   .   .   .   .   .   .   .   .   .   .   .   .   .   .   .   .   .   .   .   .   .   .   .   .   .   .   .   .   .   .   .   .   .   .   .   .   .   .   .   .   .   .   .   .   .   .   .   .   .   .   .   .   .   .   .   .   .   .   .   .   .   .   .   .   .   .   .   .   .   .   .   .   .      390,726          293,181          126,610
                                                                                                                                                                                                                                                                                                                                                                                          3,343,992        2,532,979        1,113,384
Operating profit . . . . . . . . . . . . . . . . . . . . . . . . . . . . . . . . . . . . . . . . . . . . . . . . . . . . . . . . . . . . . . . . . . . . . . . . . . . . . . . . . . . . . . . . . . . . . .                                                                                                                                                                               665,626          572,509          223,553
Corporate expense . . . . . . . . . . . . . . . . . . . . . . . . . . . . . . . . . . . . . . . . . . . . . . . . . . . . . . . . . . . . . . . . . . . . . . . . . . . . . . . . . . . . . . . . . . . . . .                                                                                                                                                                               37,724           34,793           13,685
Operating income . . . . . . . . . . . . . . . . . . . . . . . . . . . . . . . . . . . . . . . . . . . . . . . . . . . . . . . . . . . . . . . . . . . . . . . . . . . . . . . . . . . . . . . . . . . . . .                                                                                                                                                                               627,902          537,716          209,868
Non-operating income (expense)
    Interest income . . . . . . . . . . . . . . . . . . . . . .                          .   .   .   .   .   .   .   .   .   .   .   .   .   .   .   .   .   .   .   .   .   .   .   .   .   .   .   .   .   .   .   .   .   ........                        .   .   .   .   .   .   .   .   .   .   .   .   .   .   .   .   .   .   .   .   .   .   .   .   .   .   .   .   .   .   .        6,106           12,964            2,142
    Interest expense, net . . . . . . . . . . . . . . . . . .                            .   .   .   .   .   .   .   .   .   .   .   .   .   .   .   .   .   .   .   .   .   .   .   .   .   .   .   .   .   .   .   .   .   ........                        .   .   .   .   .   .   .   .   .   .   .   .   .   .   .   .   .   .   .   .   .   .   .   .   .   .   .   .   .   .   .     (349,478)        (272,856)         (59,853)
    Interest expense from unconsolidated affiliate                                       .   .   .   .   .   .   .   .   .   .   .   .   .   .   .   .   .   .   .   .   .   .   .   .   .   .   .   .   .   .   .   .   .   ........                        .   .   .   .   .   .   .   .   .   .   .   .   .   .   .   .   .   .   .   .   .   .   .   .   .   .   .   .   .   .   .       (2,370)          (2,043)          (1,058)
    Other, net . . . . . . . . . . . . . . . . . . . . . . . . . .                       .   .   .   .   .   .   .   .   .   .   .   .   .   .   .   .   .   .   .   .   .   .   .   .   .   .   .   .   .   .   .   .   .   ........                        .   .   .   .   .   .   .   .   .   .   .   .   .   .   .   .   .   .   .   .   .   .   .   .   .   .   .   .   .   .   .       (4,571)            (741)            (946)
                                                                                                                                                                                                                                                                                                                                                                                           (350,313)        (262,676)         (59,715)

Income before income taxes, extraordinary item and cumulative effect of change in accounting principle . . . . . . . . . . . . . . . . . . . . . . . . . . . . .                                                                                                                                                                                                                            277,589          275,040         150,153
    Provision for income taxes . . . . . . . . . . . . . . . . . . . . . . . . . . . . . . . . . . . . . . . . . . . . . . . . . . . . . . . . . . . . . . . . . . . . . . . . . . . . . . . . . . . . . .                                                                                                                                                                                 (106,996)        (108,880)        (55,029)

Income before extraordinary item and cumulative effect of change in accounting principle . . . . . . . . . . . . . . . . . . . . . . . . . . . . . . . . . . . . . . .                                                                                                                                                                                                                     170,593          166,160           95,124
Extraordinary item
   Loss on early retirements of debt, net of income tax benefits of $419, $2,983 and $484. . . . . . . . . . . . . . . . . . . . . . . . . . . . . . . . . . . . . . . . . .                                                                                                                                                                                                                   (778)          (5,416)           (898)
Cumulative effect of change in accounting principle
  Preopening costs, net of income tax benefit of $4,399 . . . . . . . . . . . . . . . . . . . . . . . . . . . . . . . . . . . . . . . . . . . . . . . . . . . . . . . . . . . . . . . . . .                                                                                                                                                                                                      —                —            (8,168)
Net income . . . . . . . . . . . . . . . . . . . . . . . . . . . . . . . . . . . . . . . . . . . . . . . . . . . . . . . . . . . . . . . . . . . . . . . . . . . . . . . . . . . . . . . . . . . . . . . . . . . $                                                                                                                                                                         169,815     $    160,744     $     86,058
Basic Income Per Share of Common Stock
    Income before extraordinary item and cumulative effect of change in accounting principle .                                                                                                                               .   .   .   .   .....               .   .   .   .   .   .   .   .   .   .   .   .   .   .   .   .   .   .   .   .   .   .   .   .   .   .   .   .   .   .$        1.07    $        1.15    $        0.82
    Extraordinary item – loss on early retirements of debt, net. . . . . . . . . . . . . . . . . . . . . . . . .                                                                                                             .   .   .   .   .....               .   .   .   .   .   .   .   .   .   .   .   .   .   .   .   .   .   .   .   .   .   .   .   .   .   .   .   .   .   .           —             (0.04)           (0.01)
    Cumulative effect of change in accounting principle – preopening costs, net . . . . . . . . . . .                                                                                                                        .   .   .   .   .....               .   .   .   .   .   .   .   .   .   .   .   .   .   .   .   .   .   .   .   .   .   .   .   .   .   .   .   .   .   .           —                —             (0.07)
    Net income per share . . . . . . . . . . . . . . . . . . . . . . . . . . . . . . . . . . . . . . . . . . . . . . . . . .                                                                                                 .   .   .   .   .....               .   .   .   .   .   .   .   .   .   .   .   .   .   .   .   .   .   .   .   .   .   .   .   .   .   .   .   .   .   .$        1.07    $        1.11    $        0.74
Diluted Income Per Share of Common Stock
    Income before extraordinary item and cumulative effect of change in accounting principle .                                                                                                                               .   .   .   .   .....               .   .   .   .   .   .   .   .   .   .   .   .   .   .   .   .   .   .   .   .   .   .   .   .   .   .   .   .   .   .$        1.06    $        1.13    $        0.80
    Extraordinary item – loss on early retirements of debt, net. . . . . . . . . . . . . . . . . . . . . . . . .                                                                                                             .   .   .   .   .....               .   .   .   .   .   .   .   .   .   .   .   .   .   .   .   .   .   .   .   .   .   .   .   .   .   .   .   .   .   .           —             (0.04)           (0.01)
    Cumulative effect of change in accounting principle – preopening costs, net . . . . . . . . . . .                                                                                                                        .   .   .   .   .....               .   .   .   .   .   .   .   .   .   .   .   .   .   .   .   .   .   .   .   .   .   .   .   .   .   .   .   .   .   .           —                —             (0.07)
    Net income per share . . . . . . . . . . . . . . . . . . . . . . . . . . . . . . . . . . . . . . . . . . . . . . . . . .                                                                                                 .   .   .   .   .....               .   .   .   .   .   .   .   .   .   .   .   .   .   .   .   .   .   .   .   .   .   .   .   .   .   .   .   .   .   .$        1.06    $        1.09    $        0.72

The accompanying notes are an integral part of these consolidated financial statements.


                                                                                                                                                                                                                                                                                                                                                                                                                                         31
Consolidated Statements of Cash Flows

     Year ended December 31 (In thousands)                                                                                                                                                                                                                                                                                            2001              2000            1999

     Cash flows from operating activities
         Net income . . . . . . . . . . . . . . . . . . . . . . . . . . . . . . . . . . . . . . . . . . . . . . . . . . .                                          .............................................. $                                                                                                                169,815     $     160,744     $    86,058
         Adjustments to reconcile net income to net cash provided by operating activities:
            Depreciation and amortization . . . . . . . . . . . . . . . . . . . . . . . . . . . . . . . . . . .                                                    .   .   .   .   .   ..............                  .   .   .   .   .   .   .   .   .   .   .   .   .   .   .   .   .   .   .   .   .   .   .   .   .   .   .   390,726           293,181         126,610
            Amortization of debt discount and issuance costs . . . . . . . . . . . . . . . . . . . . .                                                             .   .   .   .   .   ..............                  .   .   .   .   .   .   .   .   .   .   .   .   .   .   .   .   .   .   .   .   .   .   .   .   .   .   .    30,505            31,257           1,958
            Provision for doubtful accounts . . . . . . . . . . . . . . . . . . . . . . . . . . . . . . . . . .                                                    .   .   .   .   .   ..............                  .   .   .   .   .   .   .   .   .   .   .   .   .   .   .   .   .   .   .   .   .   .   .   .   .   .   .    71,244            42,016          19,597
            Loss on early retirements of debt . . . . . . . . . . . . . . . . . . . . . . . . . . . . . . . . .                                                    .   .   .   .   .   ..............                  .   .   .   .   .   .   .   .   .   .   .   .   .   .   .   .   .   .   .   .   .   .   .   .   .   .   .     1,197             8,399           1,382
            Cumulative effect of change in accounting principle. . . . . . . . . . . . . . . . . . . .                                                             .   .   .   .   .   ..............                  .   .   .   .   .   .   .   .   .   .   .   .   .   .   .   .   .   .   .   .   .   .   .   .   .   .   .        —                 —           12,567
            Write-downs and impairments . . . . . . . . . . . . . . . . . . . . . . . . . . . . . . . . . . .                                                      .   .   .   .   .   ..............                  .   .   .   .   .   .   .   .   .   .   .   .   .   .   .   .   .   .   .   .   .   .   .   .   .   .   .    47,955           102,225              —
            Income from unconsolidated affiliate. . . . . . . . . . . . . . . . . . . . . . . . . . . . . . .                                                      .   .   .   .   .   ..............                  .   .   .   .   .   .   .   .   .   .   .   .   .   .   .   .   .   .   .   .   .   .   .   .   .   .   .   (34,446)          (20,025)         (5,026)
            Distributions from unconsolidated affiliate . . . . . . . . . . . . . . . . . . . . . . . . . . .                                                      .   .   .   .   .   ..............                  .   .   .   .   .   .   .   .   .   .   .   .   .   .   .   .   .   .   .   .   .   .   .   .   .   .   .    36,000            24,000              —
            Deferred income taxes . . . . . . . . . . . . . . . . . . . . . . . . . . . . . . . . . . . . . . . . .                                                .   .   .   .   .   ..............                  .   .   .   .   .   .   .   .   .   .   .   .   .   .   .   .   .   .   .   .   .   .   .   .   .   .   .    65,619            35,595          27,489
         Changes in assets and liabilities:
            Accounts receivable . . . . . . . . . . . . . . . . . . . . . . . . . . . . . . . . . . . . . . . . . .                                                .   .   .   .   .   .   .   .   .   .........   .   .   .   .   .   .   .   .   .   .   .   .   .   .   .   .   .   .   .   .   .   .   .   .   .   .   .   .    23,726           (57,281)        (13,884)
            Inventories . . . . . . . . . . . . . . . . . . . . . . . . . . . . . . . . . . . . . . . . . . . . . . . . .                                          .   .   .   .   .   .   .   .   .   .........   .   .   .   .   .   .   .   .   .   .   .   .   .   .   .   .   .   .   .   .   .   .   .   .   .   .   .   .     7,464             4,293          (4,067)
            Income taxes receivable and payable . . . . . . . . . . . . . . . . . . . . . . . . . . . . . .                                                        .   .   .   .   .   .   .   .   .   .........   .   .   .   .   .   .   .   .   .   .   .   .   .   .   .   .   .   .   .   .   .   .   .   .   .   .   .   .    (8,512)           71,754          (5,966)
            Prepaid expenses . . . . . . . . . . . . . . . . . . . . . . . . . . . . . . . . . . . . . . . . . . . .                                               .   .   .   .   .   .   .   .   .   .........   .   .   .   .   .   .   .   .   .   .   .   .   .   .   .   .   .   .   .   .   .   .   .   .   .   .   .   .     1,070            (2,731)         (9,332)
            Accounts payable, accrued liabilities and other . . . . . . . . . . . . . . . . . . . . . . .                                                          .   .   .   .   .   .   .   .   .   .........   .   .   .   .   .   .   .   .   .   .   .   .   .   .   .   .   .   .   .   .   .   .   .   .   .   .   .   .    (8,617)          100,611          52,491
               Net cash provided by operating activities . . . . . . . . . . . . . . . . . . . . . . . . .                                                         .   .   .   .   .   .   .   .   .   .........   .   .   .   .   .   .   .   .   .   .   .   .   .   .   .   .   .   .   .   .   .   .   .   .   .   .   .   .   793,746           794,038         289,877

     Cash flows from investing activities
         Purchases of property and equipment. . . . . . . . . . . . . . . . . . . . . . . . . . . . . . . . . . . . . . . . . . . . . . . . . . . .                                                                        .   .   .   .   .   .   .   .   .   .   .   .   .   .   .   .   .   .   .   .   .   .   .   .   .   .   (327,936)         (336,499)       (375,260)
         Acquisition of Primadonna Resorts, Inc., net of cash acquired . . . . . . . . . . . . . . . . . . . . . . . . . . . . . . . . . .                                                                                 .   .   .   .   .   .   .   .   .   .   .   .   .   .   .   .   .   .   .   .   .   .   .   .   .   .         —                 —          (13,346)
         Acquisition of Mirage Resorts, Incorporated, net of cash acquired . . . . . . . . . . . . . . . . . . . . . . . . . . . . . . . .                                                                                 .   .   .   .   .   .   .   .   .   .   .   .   .   .   .   .   .   .   .   .   .   .   .   .   .   .         —         (5,315,466)             —
         Dispositions of property and equipment. . . . . . . . . . . . . . . . . . . . . . . . . . . . . . . . . . . . . . . . . . . . . . . . . . .                                                                       .   .   .   .   .   .   .   .   .   .   .   .   .   .   .   .   .   .   .   .   .   .   .   .   .   .     26,840           150,172           6,487
         Investment in joint venture . . . . . . . . . . . . . . . . . . . . . . . . . . . . . . . . . . . . . . . . . . . . . . . . . . . . . . . . . . . .                                                               .   .   .   .   .   .   .   .   .   .   .   .   .   .   .   .   .   .   .   .   .   .   .   .   .   .    (38,250)               —               —
         Change in construction payable . . . . . . . . . . . . . . . . . . . . . . . . . . . . . . . . . . . . . . . . . . . . . . . . . . . . . . . .                                                                    .   .   .   .   .   .   .   .   .   .   .   .   .   .   .   .   .   .   .   .   .   .   .   .   .   .      3,368           (14,361)         (9,507)
         Other . . . . . . . . . . . . . . . . . . . . . . . . . . . . . . . . . . . . . . . . . . . . . . . . . . . . . . . . . . . . . . . . . . . . . . . . . . .                                                       .   .   .   .   .   .   .   .   .   .   .   .   .   .   .   .   .   .   .   .   .   .   .   .   .   .    (16,227)          (17,018)          4,933
               Net cash used in investing activities . . . . . . . . . . . . . . . . . . . . . . . . . . . . . . . . . . . . . . . . . . . . . . . . .                                                                     .   .   .   .   .   .   .   .   .   .   .   .   .   .   .   .   .   .   .   .   .   .   .   .   .   .   (352,205)       (5,533,172)       (386,693)

     Cash flows from financing activities
         Net borrowing (repayment) under bank credit facilities . .                        .   .   .   .   .   .   .   .   .   .   .   .   .   .   .   .   .   .   .   .   .   .   .   .   ..............                  .   .   .   .   .   .   .   .   .   .   .   .   .   .   .   .   .   .   .   .   .   .   .   .   .   .   (819,704)       2,182,386          756,045
         Issuance of long-term debt . . . . . . . . . . . . . . . . . . . . . .            .   .   .   .   .   .   .   .   .   .   .   .   .   .   .   .   .   .   .   .   .   .   .   .   ..............                  .   .   .   .   .   .   .   .   .   .   .   .   .   .   .   .   .   .   .   .   .   .   .   .   .   .    400,000        1,547,052               —
         Retirements of debt . . . . . . . . . . . . . . . . . . . . . . . . . . .         .   .   .   .   .   .   .   .   .   .   .   .   .   .   .   .   .   .   .   .   .   .   .   .   ..............                  .   .   .   .   .   .   .   .   .   .   .   .   .   .   .   .   .   .   .   .   .   .   .   .   .   .         —                —          (374,500)
         Debt issuance costs . . . . . . . . . . . . . . . . . . . . . . . . . . .         .   .   .   .   .   .   .   .   .   .   .   .   .   .   .   .   .   .   .   .   .   .   .   .   ..............                  .   .   .   .   .   .   .   .   .   .   .   .   .   .   .   .   .   .   .   .   .   .   .   .   .   .     (8,529)         (75,099)              —
         Purchases of treasury stock . . . . . . . . . . . . . . . . . . . . .             .   .   .   .   .   .   .   .   .   .   .   .   .   .   .   .   .   .   .   .   .   .   .   .   ..............                  .   .   .   .   .   .   .   .   .   .   .   .   .   .   .   .   .   .   .   .   .   .   .   .   .   .    (45,716)         (52,579)        (295,235)
         Sale of treasury stock . . . . . . . . . . . . . . . . . . . . . . . . . .        .   .   .   .   .   .   .   .   .   .   .   .   .   .   .   .   .   .   .   .   .   .   .   .   ..............                  .   .   .   .   .   .   .   .   .   .   .   .   .   .   .   .   .   .   .   .   .   .   .   .   .   .         —           474,720               —
         Cash dividend paid . . . . . . . . . . . . . . . . . . . . . . . . . . .          .   .   .   .   .   .   .   .   .   .   .   .   .   .   .   .   .   .   .   .   .   .   .   .   ..............                  .   .   .   .   .   .   .   .   .   .   .   .   .   .   .   .   .   .   .   .   .   .   .   .   .   .         —           (11,341)              —
         Issuance of common stock . . . . . . . . . . . . . . . . . . . . . .              .   .   .   .   .   .   .   .   .   .   .   .   .   .   .   .   .   .   .   .   .   .   .   .   ..............                  .   .   .   .   .   .   .   .   .   .   .   .   .   .   .   .   .   .   .   .   .   .   .   .   .   .      9,974          780,441           50,072
         Other . . . . . . . . . . . . . . . . . . . . . . . . . . . . . . . . . . . . .   .   .   .   .   .   .   .   .   .   .   .   .   .   .   .   .   .   .   .   .   .   .   .   .   ..............                  .   .   .   .   .   .   .   .   .   .   .   .   .   .   .   .   .   .   .   .   .   .   .   .   .   .      3,437               —                —
               Net cash provided by (used in) financing activities                         .   .   .   .   .   .   .   .   .   .   .   .   .   .   .   .   .   .   .   .   .   .   .   .   ..............                  .   .   .   .   .   .   .   .   .   .   .   .   .   .   .   .   .   .   .   .   .   .   .   .   .   .   (460,538)       4,845,580          136,382

     Cash and cash equivalents
         Net increase (decrease) for the year . . . . . . . . . . . . . . . . . . . . . . . . . . . . . . . . . . . . . . . . . . . . . . . . . . . . . . . . . . . . . . . . . . . . . . . . . . . . . . .                                                                                                                        (18,997)          106,446          39,566
         Balance, beginning of year . . . . . . . . . . . . . . . . . . . . . . . . . . . . . . . . . . . . . . . . . . . . . . . . . . . . . . . . . . . . . . . . . . . . . . . . . . . . . . . . . . . . . .                                                                                                                    227,968           121,522          81,956
         Balance, end of year . . . . . . . . . . . . . . . . . . . . . . . . . . . . . . . . . . . . . . . . . . . . . . . . . . . . . . . . . . . . . . . . . . . . . . . . . . . . . . . . . . . . . . . . . . $                                                                                                                208,971     $     227,968     $   121,522

     Supplemental cash flow disclosures
         Interest paid, net of amounts capitalized . . . . . . . . . . . . . . . . . . . . . . . . . . . . . . . . . . . . . . . . . . . . . . . . . . . . . . . . . . . . . . . . . . . . . . . . . . . . $                                                                                                                       317,773     $     200,716     $    56,035
         State and federal income taxes paid . . . . . . . . . . . . . . . . . . . . . . . . . . . . . . . . . . . . . . . . . . . . . . . . . . . . . . . . . . . . . . . . . . . . . . . . . . . . . . .                                                                                                                          19,342            30,537          26,068

     The accompanying notes are an integral part of these consolidated financial statements.


32
Consolidated Statements of Stockholders’ Equity

Years ended December 31, 2001, 2000 and 1999 (In thousands, except share amounts)

                                                                                                                                                                                                            Other           Total
                                                                                                                 Common Stock                   Capital in Excess        Teasury        Retained   Comprehensive    Stockholders’
                                                                                                    Shares Outstanding              Par Value        of Par Value         Stock         Earnings    Income (Loss)         Equity


Balances, December 31, 1998 . . . . . . . . . . . . . . . . . . . . . . . 104,066,188                                           $      1,161       $    968,199     $   (210,589)   $   192,606     $     (3,146)   $    948,231

   Net income . . . . . . . . . . . . . . . . . . . . . . . . . . . . . . . . . . .                                       —               —                   —               —          86,058               —           86,058
   Currency translation adjustment . . . . . . . . . . . . . . . . . . . .                                                —               —                   —               —              —             1,997           1,997
   Total comprehensive income . . . . . . . . . . . . . . . . . . . . . . .                                               —               —                   —               —              —                —           88,055

  Issuance of common stock pursuant
    to stock option grants . . . . . . . . . . . . . . . . . . . . . . . . . . . 3,358,254                                                33             43,096               —             (16)              —           43,113
  Issuance of common stock for
    Primadonna merger . . . . . . . . . . . . . . . . . . . . . . . . . . . . 19,020,606                                                 190             243,371              —             (95)              —           243,466
  Purchases of treasury stock . . . . . . . . . . . . . . . . . . . . . . . (12,565,200)                                                  —                   —         (295,235)            —                —          (295,235)
  Tax benefit from stock option exercises . . . . . . . . . . . . . . .                 —                                                 —                6,959              —              —                —             6,959
  Dividend payable . . . . . . . . . . . . . . . . . . . . . . . . . . . . . . .        —                                                 —                   —               —         (11,388)              —           (11,388)
Balances, December 31, 1999 . . . . . . . . . . . . . . . . . . . . . . . 113,879,848                                                  1,384           1,261,625        (505,824)       267,165           (1,149)       1,023,201

   Net income . . . . . . . . . . . . . . . . . . . . . . . . . . . . . . . . . . .                                       —               —                   —               —         160,744               —          160,744
   Currency translation adjustment . . . . . . . . . . . . . . . . . . . .                                                —               —                   —               —              —            (4,131)         (4,131)
   Total comprehensive income . . . . . . . . . . . . . . . . . . . . . . .                                               —               —                   —               —              —                —          156,613

  Issuance of common stock pursuant
    to stock option grants . . . . . . . . . . . .      ...............                                             1,244,157             13             16,880               —              —                —           16,893
  Issuance of common stock
    in private placement . . . . . . . . . . . . .      .   .   .   .   . . . . . . . . . . . 46,500,000                                 235             756,368        474,720              —                —         1,231,323
  Purchases of treasury stock . . . . . . . .           .   .   .   .   ...........            (2,493,800)                                —                   —         (52,579)             —                —           (52,579)
  Tax benefit from stock option exercises               .   .   .   .   ...........                    —                                  —                6,947             —               —                —             6,947
  Dividend payment adjustment . . . . . . .             .   .   .   .   ...........                    —                                  —                   —              —               47               —                47
Balances, December 31, 2000 . . . . . . . .             .   .   .   .   . . . . . . . . . . . 159,130,205                              1,632           2,041,820        (83,683)        427,956           (5,280)       2,382,445

   Net income . . . . . . . . . . . . . . . . . . . . . . .         .   .   .   .   .   .   .   .   .   .   .   .         —               —                   —               —         169,815               —          169,815
   Currency translation adjustment . . . . . . . .                  .   .   .   .   .   .   .   .   .   .   .   .         —               —                   —               —              —            (2,086)         (2,086)
   Derivative loss from unconsolidated affiliate                    .   .   .   .   .   .   .   .   .   .   .   .         —               —                   —               —              —            (1,784)         (1,784)
   Total comprehensive income . . . . . . . . . . .                 .   .   .   .   .   .   .   .   .   .   .   .         —               —                   —               —              —                —          165,945

  Issuance of common stock pursuant
    to stock option grants . . . . . . . . . . . .      .   .   .   .   .   .   .   .   .   .   .   .   .   ..      496,671                 5            5,884                —              —                —           5,889
  Purchases of treasury stock . . . . . . . .           .   .   .   .   .   .   .   .   .   .   .   .   .   ..   (2,230,700)              —                 —            (45,716)            —                —         (45,716)
  Tax benefit from stock option exercises               .   .   .   .   .   .   .   .   .   .   .   .   .   ..           —                —              2,137                —              —                —           2,137
Balances, December 31, 2001 . . . . . . . .             .   .   .   .   .   .   .   .   .   .   .   .   .   . . 157,396,176     $      1,637       $ 2,049,841      $   (129,399)   $   597,771     $     (9,150)   $ 2,510,700


The accompanying notes are an integral part of these consolidated financial statements.


                                                                                                                                                                                                                                     33

More Related Content

What's hot

Unidad 5. Energías renovables. Minicentrales hidroelectricas
Unidad 5. Energías renovables. Minicentrales hidroelectricasUnidad 5. Energías renovables. Minicentrales hidroelectricas
Unidad 5. Energías renovables. Minicentrales hidroelectricas
martuki85
 
Libro para web resumen
Libro para web resumenLibro para web resumen
Libro para web resumen
cetae
 
Cartilla empaque todo el documento internet[1]
Cartilla empaque todo el documento   internet[1]Cartilla empaque todo el documento   internet[1]
Cartilla empaque todo el documento internet[1]
karen
 
Breviario presentacion web
Breviario presentacion webBreviario presentacion web
Breviario presentacion web
cetae
 
PLC y electroneumática: Tutorial de programación de AWL con el PLC en Simatic...
PLC y electroneumática: Tutorial de programación de AWL con el PLC en Simatic...PLC y electroneumática: Tutorial de programación de AWL con el PLC en Simatic...
PLC y electroneumática: Tutorial de programación de AWL con el PLC en Simatic...
SANTIAGO PABLO ALBERTO
 
Tabla de contenido fmb
Tabla de contenido fmb Tabla de contenido fmb
Tabla de contenido fmb
Bleakness
 
Dian Cartilla 350 Retefuente 2009
Dian Cartilla 350 Retefuente 2009Dian Cartilla 350 Retefuente 2009
Dian Cartilla 350 Retefuente 2009
Olson Ortiz
 

What's hot (19)

03 puertos rev08
03 puertos rev0803 puertos rev08
03 puertos rev08
 
Pdf 70 puentes de madera
Pdf 70 puentes de maderaPdf 70 puentes de madera
Pdf 70 puentes de madera
 
Espigones crucita memoria técnica
Espigones crucita memoria técnicaEspigones crucita memoria técnica
Espigones crucita memoria técnica
 
Unidad 5. Energías renovables. Minicentrales hidroelectricas
Unidad 5. Energías renovables. Minicentrales hidroelectricasUnidad 5. Energías renovables. Minicentrales hidroelectricas
Unidad 5. Energías renovables. Minicentrales hidroelectricas
 
Antecedentes Y Marco Teorico V2
Antecedentes Y Marco Teorico V2Antecedentes Y Marco Teorico V2
Antecedentes Y Marco Teorico V2
 
Iva 2009
Iva 2009Iva 2009
Iva 2009
 
Libro para web resumen
Libro para web resumenLibro para web resumen
Libro para web resumen
 
Cartilla empaque todo el documento internet[1]
Cartilla empaque todo el documento   internet[1]Cartilla empaque todo el documento   internet[1]
Cartilla empaque todo el documento internet[1]
 
Breviario presentacion web
Breviario presentacion webBreviario presentacion web
Breviario presentacion web
 
PLC y electroneumática: Tutorial de programación de AWL con el PLC en Simatic...
PLC y electroneumática: Tutorial de programación de AWL con el PLC en Simatic...PLC y electroneumática: Tutorial de programación de AWL con el PLC en Simatic...
PLC y electroneumática: Tutorial de programación de AWL con el PLC en Simatic...
 
Cartilla de Declaracion de renta personas naturales No obligado 2012 -Dian
Cartilla de Declaracion de renta personas naturales No obligado 2012 -DianCartilla de Declaracion de renta personas naturales No obligado 2012 -Dian
Cartilla de Declaracion de renta personas naturales No obligado 2012 -Dian
 
Cartilla iva 2011
Cartilla iva 2011Cartilla iva 2011
Cartilla iva 2011
 
Word basico
Word basicoWord basico
Word basico
 
RETENCIÓN EN LA FUENTE 2011
RETENCIÓN EN LA FUENTE  2011RETENCIÓN EN LA FUENTE  2011
RETENCIÓN EN LA FUENTE 2011
 
Actividad economica en la sociedad
Actividad economica en la sociedadActividad economica en la sociedad
Actividad economica en la sociedad
 
Tabla de contenido fmb
Tabla de contenido fmb Tabla de contenido fmb
Tabla de contenido fmb
 
Dian Cartilla 350 Retefuente 2009
Dian Cartilla 350 Retefuente 2009Dian Cartilla 350 Retefuente 2009
Dian Cartilla 350 Retefuente 2009
 
MANUAL DE DISPOSITIVOS DE CONTROL DE TRÁNSITO AUTOMOTOR PARA CALLES Y CARRETE...
MANUAL DE DISPOSITIVOS DE CONTROL DE TRÁNSITO AUTOMOTOR PARA CALLES Y CARRETE...MANUAL DE DISPOSITIVOS DE CONTROL DE TRÁNSITO AUTOMOTOR PARA CALLES Y CARRETE...
MANUAL DE DISPOSITIVOS DE CONTROL DE TRÁNSITO AUTOMOTOR PARA CALLES Y CARRETE...
 
Manual de-s10-2005
Manual de-s10-2005Manual de-s10-2005
Manual de-s10-2005
 

Viewers also liked

energy future holindings TCEH10QJun2008_Final
energy future holindings  TCEH10QJun2008_Finalenergy future holindings  TCEH10QJun2008_Final
energy future holindings TCEH10QJun2008_Final
finance29
 
MGMMIRAGE 93005SuppDataProForma
MGMMIRAGE 93005SuppDataProFormaMGMMIRAGE 93005SuppDataProForma
MGMMIRAGE 93005SuppDataProForma
finance29
 
energy future holindings 050505
energy future holindings 050505energy future holindings 050505
energy future holindings 050505
finance29
 
energy future holindings TCEH10QJun2008_Final
energy future holindings  TCEH10QJun2008_Finalenergy future holindings  TCEH10QJun2008_Final
energy future holindings TCEH10QJun2008_Final
finance29
 
calpine 200310KA2Redline
calpine 200310KA2Redlinecalpine 200310KA2Redline
calpine 200310KA2Redline
finance29
 
.energyfutureholdings txufosummary3q01
.energyfutureholdings txufosummary3q01.energyfutureholdings txufosummary3q01
.energyfutureholdings txufosummary3q01
finance29
 

Viewers also liked (7)

energy future holindings TCEH10QJun2008_Final
energy future holindings  TCEH10QJun2008_Finalenergy future holindings  TCEH10QJun2008_Final
energy future holindings TCEH10QJun2008_Final
 
MGMM ar01
MGMM  ar01MGMM  ar01
MGMM ar01
 
MGMMIRAGE 93005SuppDataProForma
MGMMIRAGE 93005SuppDataProFormaMGMMIRAGE 93005SuppDataProForma
MGMMIRAGE 93005SuppDataProForma
 
energy future holindings 050505
energy future holindings 050505energy future holindings 050505
energy future holindings 050505
 
energy future holindings TCEH10QJun2008_Final
energy future holindings  TCEH10QJun2008_Finalenergy future holindings  TCEH10QJun2008_Final
energy future holindings TCEH10QJun2008_Final
 
calpine 200310KA2Redline
calpine 200310KA2Redlinecalpine 200310KA2Redline
calpine 200310KA2Redline
 
.energyfutureholdings txufosummary3q01
.energyfutureholdings txufosummary3q01.energyfutureholdings txufosummary3q01
.energyfutureholdings txufosummary3q01
 

Similar to MGMM FinState01

Industria metalmecanica informe
Industria metalmecanica   informeIndustria metalmecanica   informe
Industria metalmecanica informe
elmuniola
 

Similar to MGMM FinState01 (20)

กลอน13
กลอน13กลอน13
กลอน13
 
Pedro Espino Vargas, AUSTRAL
Pedro Espino Vargas, AUSTRALPedro Espino Vargas, AUSTRAL
Pedro Espino Vargas, AUSTRAL
 
Industria metalmecanica informe
Industria metalmecanica   informeIndustria metalmecanica   informe
Industria metalmecanica informe
 
Mq d02 dad_l1_improbidade_administrativa_v1
Mq d02 dad_l1_improbidade_administrativa_v1Mq d02 dad_l1_improbidade_administrativa_v1
Mq d02 dad_l1_improbidade_administrativa_v1
 
CV
CVCV
CV
 
Comprensión lectora @cerebritosmed .pdf
Comprensión lectora @cerebritosmed .pdfComprensión lectora @cerebritosmed .pdf
Comprensión lectora @cerebritosmed .pdf
 
Manual civilcad
Manual civilcadManual civilcad
Manual civilcad
 
PROYECTO TERTULIAS LITERARIAS
PROYECTO TERTULIAS LITERARIASPROYECTO TERTULIAS LITERARIAS
PROYECTO TERTULIAS LITERARIAS
 
Modelo gestion preventiva
Modelo gestion preventivaModelo gestion preventiva
Modelo gestion preventiva
 
Evaluación institucional de logro educativo 2013 2014
Evaluación institucional de logro educativo  2013 2014Evaluación institucional de logro educativo  2013 2014
Evaluación institucional de logro educativo 2013 2014
 
Evaluacion institucional 2013 2014-1
Evaluacion institucional 2013 2014-1Evaluacion institucional 2013 2014-1
Evaluacion institucional 2013 2014-1
 
Programa electoral Podemos Madrid
Programa electoral Podemos MadridPrograma electoral Podemos Madrid
Programa electoral Podemos Madrid
 
Historia Mundial III Manual
Historia Mundial III ManualHistoria Mundial III Manual
Historia Mundial III Manual
 
Lenguaje y Comunicación I
Lenguaje y Comunicación ILenguaje y Comunicación I
Lenguaje y Comunicación I
 
Matematica funciones
Matematica funcionesMatematica funciones
Matematica funciones
 
Historia Mundial I Manual
Historia Mundial I ManualHistoria Mundial I Manual
Historia Mundial I Manual
 
Fisica
FisicaFisica
Fisica
 
Adultos historia
Adultos historiaAdultos historia
Adultos historia
 
Módulo de historia 1
Módulo de historia 1Módulo de historia 1
Módulo de historia 1
 
Historia Mundial II Manual
Historia Mundial II ManualHistoria Mundial II Manual
Historia Mundial II Manual
 

More from finance29

Chesapeake Latest_IR_Presentation
Chesapeake Latest_IR_PresentationChesapeake Latest_IR_Presentation
Chesapeake Latest_IR_Presentation
finance29
 
ChesapeakeEnergy07ARFINAL
ChesapeakeEnergy07ARFINALChesapeakeEnergy07ARFINAL
ChesapeakeEnergy07ARFINAL
finance29
 
ChesapeakeEnergy07ARFINAL
ChesapeakeEnergy07ARFINALChesapeakeEnergy07ARFINAL
ChesapeakeEnergy07ARFINAL
finance29
 
Chesapeake Latest_IR_Presentation
Chesapeake Latest_IR_PresentationChesapeake Latest_IR_Presentation
Chesapeake Latest_IR_Presentation
finance29
 
Chesapeake Latest_IR_Presentation
Chesapeake Latest_IR_PresentationChesapeake Latest_IR_Presentation
Chesapeake Latest_IR_Presentation
finance29
 
ChesapeakeEnergy07ARFINAL
ChesapeakeEnergy07ARFINALChesapeakeEnergy07ARFINAL
ChesapeakeEnergy07ARFINAL
finance29
 
Chesapeake Energy07ARFINAL
Chesapeake Energy07ARFINALChesapeake Energy07ARFINAL
Chesapeake Energy07ARFINAL
finance29
 
Chesapeake Latest_IR_Presentation
Chesapeake Latest_IR_PresentationChesapeake Latest_IR_Presentation
Chesapeake Latest_IR_Presentation
finance29
 
MGM MIRAGE MandalayHist
MGM MIRAGE  MandalayHistMGM MIRAGE  MandalayHist
MGM MIRAGE MandalayHist
finance29
 
MGM MIRAGE ProForma
MGM MIRAGE  ProFormaMGM MIRAGE  ProForma
MGM MIRAGE ProForma
finance29
 
MGM MIRAGE Actual
MGM MIRAGE  ActualMGM MIRAGE  Actual
MGM MIRAGE Actual
finance29
 
MGM 93005SuppDataMandalayHistorical
MGM 93005SuppDataMandalayHistoricalMGM 93005SuppDataMandalayHistorical
MGM 93005SuppDataMandalayHistorical
finance29
 
MGMMIRAGE 93005SuppDataActual
MGMMIRAGE 93005SuppDataActualMGMMIRAGE 93005SuppDataActual
MGMMIRAGE 93005SuppDataActual
finance29
 
MGM MIRAGE Mandalayhist_022306
MGM MIRAGE  Mandalayhist_022306MGM MIRAGE  Mandalayhist_022306
MGM MIRAGE Mandalayhist_022306
finance29
 
MGM MIRAGE SuppActual_022306
MGM MIRAGE  SuppActual_022306MGM MIRAGE  SuppActual_022306
MGM MIRAGE SuppActual_022306
finance29
 
MGM MIRAGE SuppProForma_022306
MGM MIRAGE  SuppProForma_022306MGM MIRAGE  SuppProForma_022306
MGM MIRAGE SuppProForma_022306
finance29
 
MGM Mandalay
MGM MandalayMGM Mandalay
MGM Mandalay
finance29
 
MGM ProForma
MGM ProFormaMGM ProForma
MGM ProForma
finance29
 
MGM MIRAGE SuppData05307
MGM MIRAGE  SuppData05307MGM MIRAGE  SuppData05307
MGM MIRAGE SuppData05307
finance29
 

More from finance29 (20)

Chesapeake Latest_IR_Presentation
Chesapeake Latest_IR_PresentationChesapeake Latest_IR_Presentation
Chesapeake Latest_IR_Presentation
 
ChesapeakeEnergy07ARFINAL
ChesapeakeEnergy07ARFINALChesapeakeEnergy07ARFINAL
ChesapeakeEnergy07ARFINAL
 
ChesapeakeEnergy07ARFINAL
ChesapeakeEnergy07ARFINALChesapeakeEnergy07ARFINAL
ChesapeakeEnergy07ARFINAL
 
Chesapeake Latest_IR_Presentation
Chesapeake Latest_IR_PresentationChesapeake Latest_IR_Presentation
Chesapeake Latest_IR_Presentation
 
Chesapeake Latest_IR_Presentation
Chesapeake Latest_IR_PresentationChesapeake Latest_IR_Presentation
Chesapeake Latest_IR_Presentation
 
ChesapeakeEnergy07ARFINAL
ChesapeakeEnergy07ARFINALChesapeakeEnergy07ARFINAL
ChesapeakeEnergy07ARFINAL
 
Chesapeake Energy07ARFINAL
Chesapeake Energy07ARFINALChesapeake Energy07ARFINAL
Chesapeake Energy07ARFINAL
 
Chesapeake Latest_IR_Presentation
Chesapeake Latest_IR_PresentationChesapeake Latest_IR_Presentation
Chesapeake Latest_IR_Presentation
 
MGM MIRAGE MandalayHist
MGM MIRAGE  MandalayHistMGM MIRAGE  MandalayHist
MGM MIRAGE MandalayHist
 
MGM MIRAGE ProForma
MGM MIRAGE  ProFormaMGM MIRAGE  ProForma
MGM MIRAGE ProForma
 
MGM MIRAGE Actual
MGM MIRAGE  ActualMGM MIRAGE  Actual
MGM MIRAGE Actual
 
MGM 93005SuppDataMandalayHistorical
MGM 93005SuppDataMandalayHistoricalMGM 93005SuppDataMandalayHistorical
MGM 93005SuppDataMandalayHistorical
 
MGMMIRAGE 93005SuppDataActual
MGMMIRAGE 93005SuppDataActualMGMMIRAGE 93005SuppDataActual
MGMMIRAGE 93005SuppDataActual
 
MGM MIRAGE Mandalayhist_022306
MGM MIRAGE  Mandalayhist_022306MGM MIRAGE  Mandalayhist_022306
MGM MIRAGE Mandalayhist_022306
 
MGM MIRAGE SuppActual_022306
MGM MIRAGE  SuppActual_022306MGM MIRAGE  SuppActual_022306
MGM MIRAGE SuppActual_022306
 
MGM MIRAGE SuppProForma_022306
MGM MIRAGE  SuppProForma_022306MGM MIRAGE  SuppProForma_022306
MGM MIRAGE SuppProForma_022306
 
MGM Mandalay
MGM MandalayMGM Mandalay
MGM Mandalay
 
MGM ProForma
MGM ProFormaMGM ProForma
MGM ProForma
 
MGM Supp
MGM SuppMGM Supp
MGM Supp
 
MGM MIRAGE SuppData05307
MGM MIRAGE  SuppData05307MGM MIRAGE  SuppData05307
MGM MIRAGE SuppData05307
 

Recently uploaded

tad22.pdf sggwhqhqt1vbwju2u2u1jwy2jjqy1j2jqu
tad22.pdf sggwhqhqt1vbwju2u2u1jwy2jjqy1j2jqutad22.pdf sggwhqhqt1vbwju2u2u1jwy2jjqy1j2jqu
tad22.pdf sggwhqhqt1vbwju2u2u1jwy2jjqy1j2jqu
iceokey158
 
Presentación Seccion 5 -Estado de Resultado Integral y Estado de Resultados.pptx
Presentación Seccion 5 -Estado de Resultado Integral y Estado de Resultados.pptxPresentación Seccion 5 -Estado de Resultado Integral y Estado de Resultados.pptx
Presentación Seccion 5 -Estado de Resultado Integral y Estado de Resultados.pptx
JulissaValderramos
 
PARADIGMA 1.docx paradicma g vmjhhhhhhhhhhhhhhhhhhhhhhh
PARADIGMA 1.docx paradicma g vmjhhhhhhhhhhhhhhhhhhhhhhhPARADIGMA 1.docx paradicma g vmjhhhhhhhhhhhhhhhhhhhhhhh
PARADIGMA 1.docx paradicma g vmjhhhhhhhhhhhhhhhhhhhhhhh
angelorihuela4
 

Recently uploaded (20)

tad22.pdf sggwhqhqt1vbwju2u2u1jwy2jjqy1j2jqu
tad22.pdf sggwhqhqt1vbwju2u2u1jwy2jjqy1j2jqutad22.pdf sggwhqhqt1vbwju2u2u1jwy2jjqy1j2jqu
tad22.pdf sggwhqhqt1vbwju2u2u1jwy2jjqy1j2jqu
 
EL HALVING DEL BITCOIN: REDUCIR A LA MITAD EL MINADO DE LOS MINEROS.
EL HALVING DEL BITCOIN: REDUCIR A LA MITAD EL MINADO DE LOS MINEROS.EL HALVING DEL BITCOIN: REDUCIR A LA MITAD EL MINADO DE LOS MINEROS.
EL HALVING DEL BITCOIN: REDUCIR A LA MITAD EL MINADO DE LOS MINEROS.
 
Lecturas de Historia del Pensamiento Económico (Adrian Ravier).pdf
Lecturas de Historia del Pensamiento Económico (Adrian Ravier).pdfLecturas de Historia del Pensamiento Económico (Adrian Ravier).pdf
Lecturas de Historia del Pensamiento Económico (Adrian Ravier).pdf
 
JOSE URBINA - Presentacion Sistema Endeudamiento.pptx
JOSE URBINA - Presentacion Sistema Endeudamiento.pptxJOSE URBINA - Presentacion Sistema Endeudamiento.pptx
JOSE URBINA - Presentacion Sistema Endeudamiento.pptx
 
Intervención del Estado en la economía y el mercado competitivo.pdf
Intervención del Estado en la economía y el mercado competitivo.pdfIntervención del Estado en la economía y el mercado competitivo.pdf
Intervención del Estado en la economía y el mercado competitivo.pdf
 
Presentación Seccion 5 -Estado de Resultado Integral y Estado de Resultados.pptx
Presentación Seccion 5 -Estado de Resultado Integral y Estado de Resultados.pptxPresentación Seccion 5 -Estado de Resultado Integral y Estado de Resultados.pptx
Presentación Seccion 5 -Estado de Resultado Integral y Estado de Resultados.pptx
 
Compañías aseguradoras presentacion power point
Compañías aseguradoras presentacion power pointCompañías aseguradoras presentacion power point
Compañías aseguradoras presentacion power point
 
Razon de liquidez, endeudamiento y rentabilidad y
Razon de liquidez, endeudamiento y rentabilidad yRazon de liquidez, endeudamiento y rentabilidad y
Razon de liquidez, endeudamiento y rentabilidad y
 
VALUACIÓN AL COSTO-CONTABILIDAD FINANCIERA.pdf
VALUACIÓN AL COSTO-CONTABILIDAD FINANCIERA.pdfVALUACIÓN AL COSTO-CONTABILIDAD FINANCIERA.pdf
VALUACIÓN AL COSTO-CONTABILIDAD FINANCIERA.pdf
 
LAS CULTURAS HIDRAULICAS EN BOLIVIA.pptx
LAS CULTURAS HIDRAULICAS EN BOLIVIA.pptxLAS CULTURAS HIDRAULICAS EN BOLIVIA.pptx
LAS CULTURAS HIDRAULICAS EN BOLIVIA.pptx
 
Inducción Subterranea Mina Florida 2022.ppt
Inducción Subterranea Mina Florida 2022.pptInducción Subterranea Mina Florida 2022.ppt
Inducción Subterranea Mina Florida 2022.ppt
 
titulo valor prate principal y accesoria...................
titulo valor prate principal y accesoria...................titulo valor prate principal y accesoria...................
titulo valor prate principal y accesoria...................
 
PLANEACION-Y-CONTROL-DE-UTILIDADES-.pptx
PLANEACION-Y-CONTROL-DE-UTILIDADES-.pptxPLANEACION-Y-CONTROL-DE-UTILIDADES-.pptx
PLANEACION-Y-CONTROL-DE-UTILIDADES-.pptx
 
El rey que no amaba a los elefantes. Vida y caida de Juan Carlos I, el ultimo...
El rey que no amaba a los elefantes. Vida y caida de Juan Carlos I, el ultimo...El rey que no amaba a los elefantes. Vida y caida de Juan Carlos I, el ultimo...
El rey que no amaba a los elefantes. Vida y caida de Juan Carlos I, el ultimo...
 
EL PROCESO DE FISCALIZACION TRIBUTARIA .pptx
EL PROCESO DE FISCALIZACION TRIBUTARIA .pptxEL PROCESO DE FISCALIZACION TRIBUTARIA .pptx
EL PROCESO DE FISCALIZACION TRIBUTARIA .pptx
 
PARADIGMA 1.docx paradicma g vmjhhhhhhhhhhhhhhhhhhhhhhh
PARADIGMA 1.docx paradicma g vmjhhhhhhhhhhhhhhhhhhhhhhhPARADIGMA 1.docx paradicma g vmjhhhhhhhhhhhhhhhhhhhhhhh
PARADIGMA 1.docx paradicma g vmjhhhhhhhhhhhhhhhhhhhhhhh
 
Desempleo en Chile para el año 2022 según criterios externos
Desempleo en Chile para el año 2022 según criterios externosDesempleo en Chile para el año 2022 según criterios externos
Desempleo en Chile para el año 2022 según criterios externos
 
TEORIA DEL CONSUMIDOR.pptxxxxxxxxxxxxxxxxxxxxxxxx
TEORIA DEL CONSUMIDOR.pptxxxxxxxxxxxxxxxxxxxxxxxxTEORIA DEL CONSUMIDOR.pptxxxxxxxxxxxxxxxxxxxxxxxx
TEORIA DEL CONSUMIDOR.pptxxxxxxxxxxxxxxxxxxxxxxxx
 
Marco conceptual para la información financiera.pdf
Marco conceptual para la información financiera.pdfMarco conceptual para la información financiera.pdf
Marco conceptual para la información financiera.pdf
 
FORMULACION Y EVALUACION DE PLAN DE NEGOCIO
FORMULACION Y EVALUACION DE PLAN DE NEGOCIOFORMULACION Y EVALUACION DE PLAN DE NEGOCIO
FORMULACION Y EVALUACION DE PLAN DE NEGOCIO
 

MGMM FinState01

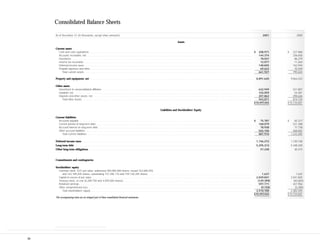
  • 1. Consolidated Balance Sheets As of December 31 (In thousands, except share amounts) 2001 2000 Assets Current assets Cash and cash equivalents . . . . . . . . . . . . . . . . . . . . . . . . . . . . . . . . . . . . . . . . . . . . . . . . . . . . . . . . . . . . . . . . . . . . . . . . . . . . . . . . . . . . . . . . . . . . . . . . . . . . . . . . . . . .$ 208,971 $ 227,968 Accounts receivable, net . . . . . . . . . . . . . . . . . . . . . . . . . . . . . . . . . . . . . . . . . . . . . . . . . . . . . . . . . . . . . . . . . . . . . . . . . . . . . . . . . . . . . . . . . . . . . . . . . . . . . . . . . . . . . 144,374 236,650 Inventories . . . . . . . . . . . . . . . . . . . . . . . . . . . . . . . . . . . . . . . . . . . . . . . . . . . . . . . . . . . . . . . . . . . . . . . . . . . . . . . . . . . . . . . . . . . . . . . . . . . . . . . . . . . . . . . . . . . . . . . 78,037 86,279 Income tax receivable . . . . . . . . . . . . . . . . . . . . . . . . . . . . . . . . . . . . . . . . . . . . . . . . . . . . . . . . . . . . . . . . . . . . . . . . . . . . . . . . . . . . . . . . . . . . . . . . . . . . . . . . . . . . . . . 12,077 11,264 Deferred income taxes . . . . . . . . . . . . . . . . . . . . . . . . . . . . . . . . . . . . . . . . . . . . . . . . . . . . . . . . . . . . . . . . . . . . . . . . . . . . . . . . . . . . . . . . . . . . . . . . . . . . . . . . . . . . . . . 148,845 162,934 Prepaid expenses and other . . . . . . . . . . . . . . . . . . . . . . . . . . . . . . . . . . . . . . . . . . . . . . . . . . . . . . . . . . . . . . . . . . . . . . . . . . . . . . . . . . . . . . . . . . . . . . . . . . . . . . . . . . . 69,623 70,549 Total current assets . . . . . . . . . . . . . . . . . . . . . . . . . . . . . . . . . . . . . . . . . . . . . . . . . . . . . . . . . . . . . . . . . . . . . . . . . . . . . . . . . . . . . . . . . . . . . . . . . . . . . . . . . . . . . . . 661,927 795,644 Property and equipment, net. . . . . . . . . . . . . . . . . . . . . . . . . . . . . . . . . . . . . . . . . . . . . . . . . . . . . . . . . . . . . . . . . . . . . . . . . . . . . . . . . . . . . . . . . . . . . . . . . . . . . . . . . . . . 8,891,645 9,064,233 Other assets Investment in unconsolidated affiliates . . . . . . . . . . . . . . . . . . . . . . . . . . . . . . . . . . . . . . ...... . . . . . . . . . . . . . . . . . . . . . . . . . . . . . . . . . . . . . . . . . . . . . . . . . . . . . . . 632,949 521,807 Goodwill, net . . . . . . . . . . . . . . . . . . . . . . . . . . . . . . . . . . . . . . . . . . . . . . . . . . . . . . . . . ...... . . . . . . . . . . . . . . . . . . . . . . . . . . . . . . . . . . . . . . . . . . . . . . . . . . . . . . . 103,059 54,281 Deposits and other assets, net . . . . . . . . . . . . . . . . . . . . . . . . . . . . . . . . . . . . . . . . . . . . ...... . . . . . . . . . . . . . . . . . . . . . . . . . . . . . . . . . . . . . . . . . . . . . . . . . . . . . . . 207,863 298,636 Total other assets. . . . . . . . . . . . . . . . . . . . . . . . . . . . . . . . . . . . . . . . . . . . . . . . . . . . ...... . . . . . . . . . . . . . . . . . . . . . . . . . . . . . . . . . . . . . . . . . . . . . . . . . . . . . . . 943,871 874,724 $10,497,443 $ 10,734,601 Liabilities and Stockholders’ Equity Current liabilities Accounts payable . . . . . . . . . . . . . . . . . . . . . . . . . . . . . . . . . . . . . . . . . . . . . . . . . . . . . . . . . . . . . . . . . . . . . . . . . . . . . . . . . . . . . . . . . . . . . . . . . . . . . . . . . . . . . . . . . .$ 75,787 $ 65,317 Current portion of long-term debt . . . . . . . . . . . . . . . . . . . . . . . . . . . . . . . . . . . . . . . . . . . . . . . . . . . . . . . . . . . . . . . . . . . . . . . . . . . . . . . . . . . . . . . . . . . . . . . . . . . . . . . 168,079 521,308 Accrued interest on long-term debt . . . . . . . . . . . . . . . . . . . . . . . . . . . . . . . . . . . . . . . . . . . . . . . . . . . . . . . . . . . . . . . . . . . . . . . . . . . . . . . . . . . . . . . . . . . . . . . . . . . . . . 78,938 77,738 Other accrued liabilities . . . . . . . . . . . . . . . . . . . . . . . . . . . . . . . . . . . . . . . . . . . . . . . . . . . . . . . . . . . . . . . . . . . . . . . . . . . . . . . . . . . . . . . . . . . . . . . . . . . . . . . . . . . . . . 565,106 568,842 Total current liabilities . . . . . . . . . . . . . . . . . . . . . . . . . . . . . . . . . . . . . . . . . . . . . . . . . . . . . . . . . . . . . . . . . . . . . . . . . . . . . . . . . . . . . . . . . . . . . . . . . . . . . . . . . . . . . 887,910 1,233,205 Deferred income taxes. . . . . . . . . . . . . . . . . . . . . . . . . . . . . . . . . . . . . . . . . . . . . . . . . . . . . . . . . . . . . . . . . . . . . . . . . . . . . . . . . . . . . . . . . . . . . . . . . . . . . . . . . . . . . . . . . 1,746,272 1,730,158 Long-term debt. . . . . . . . . . . . . . . . . . . . . . . . . . . . . . . . . . . . . . . . . . . . . . . . . . . . . . . . . . . . . . . . . . . . . . . . . . . . . . . . . . . . . . . . . . . . . . . . . . . . . . . . . . . . . . . . . . . . . . 5,295,313 5,348,320 Other long-term obligations . . . . . . . . . . . . . . . . . . . . . . . . . . . . . . . . . . . . . . . . . . . . . . . . . . . . . . . . . . . . . . . . . . . . . . . . . . . . . . . . . . . . . . . . . . . . . . . . . . . . . . . . . . . . 57,248 40,473 Commitments and contingencies Stockholders’ equity Common stock, $.01 par value: authorized 300,000,000 shares, issued 163,685,876 and 163,189,205 shares; outstanding 157,396,176 and 159,130,205 shares . . . . . . . . . . . . . . . . . . . . . . . . . . . ... . . . . . . . . . . . . . . . . . . . . . . . . . . . . . . . . . . . . . . . 1,637 1,632 Capital in excess of par value . . . . . . . . . . . . . . . . . . . . . . . . . . . . . . . . . . . . . . . . . . . . . . . . . . . . . . . . . . . . . . . . ... . . . . . . . . . . . . . . . . . . . . . . . . . . . . . . . . . . . . . . . 2,049,841 2,041,820 Treasury stock, at cost (6,289,700 and 4,059,000 shares) . . . . . . . . . . . . . . . . . . . . . . . . . . . . . . . . . . . . . . . . . . . ... . . . . . . . . . . . . . . . . . . . . . . . . . . . . . . . . . . . . . . . (129,399) (83,683) Retained earnings . . . . . . . . . . . . . . . . . . . . . . . . . . . . . . . . . . . . . . . . . . . . . . . . . . . . . . . . . . . . . . . . . . . . . . . . ... . . . . . . . . . . . . . . . . . . . . . . . . . . . . . . . . . . . . . . . 597,771 427,956 Other comprehensive loss . . . . . . . . . . . . . . . . . . . . . . . . . . . . . . . . . . . . . . . . . . . . . . . . . . . . . . . . . . . . . . . . . . ... . . . . . . . . . . . . . . . . . . . . . . . . . . . . . . . . . . . . . . . (9,150) (5,280) Total stockholders’ equity . . . . . . . . . . . . . . . . . . . . . . . . . . . . . . . . . . . . . . . . . . . . . . . . . . . . . . . . . . . . . . . . . ... . . . . . . . . . . . . . . . . . . . . . . . . . . . . . . . . . . . . . . . 2,510,700 2,382,445 $10,497,443 $ 10,734,601 The accompanying notes are an integral part of these consolidated financial statements. 30
  • 2. Consolidated Statements of Income Year ended December 31 (In thousands, except per share amounts) 2001 2000 1999 Revenues Casino . . . . . . . . . . . . . . . . . . . . . . . . . . . . . . . . . . . . . . . . . . . . . . . . . . . . . . . . . . . . . ...... . . . . . . . . . . . . . . . . . . . . . . . . . . . . . . . . . $ 2,163,808 $ 1,785,978 $ 818,992 Rooms . . . . . . . . . . . . . . . . . . . . . . . . . . . . . . . . . . . . . . . . . . . . . . . . . . . . . . . . . . . . . ...... . . . . . . . . . . . . . . . . . . . . . . . . . . . . . . . . . 846,215 614,707 258,364 Food and beverage . . . . . . . . . . . . . . . . . . . . . . . . . . . . . . . . . . . . . . . . . . . . . . . . . . . . ...... . . . . . . . . . . . . . . . . . . . . . . . . . . . . . . . . . 723,745 511,180 178,300 Entertainment, retail and other . . . . . . . . . . . . . . . . . . . . . . . . . . . . . . . . . . . . . . . . . . . . ...... . . . . . . . . . . . . . . . . . . . . . . . . . . . . . . . . . 646,105 457,898 187,803 Income from unconsolidated affiliate . . . . . . . . . . . . . . . . . . . . . . . . . . . . . . . . . . . . . . . . ...... . . . . . . . . . . . . . . . . . . . . . . . . . . . . . . . . . 36,816 22,068 6,084 4,416,689 3,391,831 1,449,543 Less – promotional allowances . . . . . . . . . . . . . . . . . . . . . . . . . . . . . . . . . . . . . . . . . . . . . . . . . . . . . . . . . . . . . . . . . . . . . . . . . . . . . . . . . . . 407,071 286,343 112,606 4,009,618 3,105,488 1,336,937 Expenses Casino . . . . . . . . . . . . . . . . . . . . . . . . . . . . . . . . . . . . . . . . . . . . . . . . . . . . . . . . . . . . . . . . . . . . . . . . . . . . . . . . . . . . . . . . . . . . . . . . . . . . 1,127,065 859,305 392,174 Rooms . . . . . . . . . . . . . . . . . . . . . . . . . . . . . . . . . . . . . . . . . . . . . . . . . . . . . . . . . . . . . . . . . . . . . . . . . . . . . . . . . . . . . . . . . . . . . . . . . . . . 239,725 183,760 82,862 Food and beverage . . . . . . . . . . . . . . . . . . . . . . . . . . . . . . . . . . . . . . . . . . . . . . . . . . . . . . . . . . . . . . . . . . . . . . . . . . . . . . . . . . . . . . . . . . . 415,015 297,602 103,022 Entertainment, retail and other . . . . . . . . . . . . . . . . . . . . . . . . . . . . . . . . . . . . . . . . . . . . . . . . . . . . . . . . . . . . . . . . . . . . . . . . . . . . . . . . . . . 425,536 287,665 113,848 Provision for doubtful accounts. . . . . . . . . . . . . . . . . . . . . . . . . . . . . . . . . . . . . . . . . . . . . . . . . . . . . . . . . . . . . . . . . . . . . . . . . . . . . . . . . . . 71,244 42,016 19,597 General and administrative . . . . . . . . . . . . . . . . . . . . . . . . . . . . . . . . . . . . . . . . . . . . . . . . . . . . . . . . . . . . . . . . . . . . . . . . . . . . . . . . . . . . . . 597,899 438,082 203,775 Preopening expenses and other . . . . . . . . . . . . . . . . . . . . . . . . . . . . . . . . . . . . . . . . . . . . . . . . . . . . . . . . . . . . . . . . . . . . . . . . . . . . . . . . . . 5,106 5,624 71,496 Restructuring costs . . . . . . . . . . . . . . . . . . . . . . . . . . . . . . . . . . . . . . . . . . . . . . . . . . . . . . . . . . . . . . . . . . . . . . . . . . . . . . . . . . . . . . . . . . . 23,721 23,519 — Write-downs and impairments . . . . . . . . . . . . . . . . . . . . . . . . . . . . . . . . . . . . . . . . . . . . . . . . . . . . . . . . . . . . . . . . . . . . . . . . . . . . . . . . . . . 47,955 102,225 — Depreciation and amortization . . . . . . . . . . . . . . . . . . . . . . . . . . . . . . . . . . . . . . . . . . . . . . . . . . . . . . . . . . . . . . . . . . . . . . . . . . . . . . . . . . . 390,726 293,181 126,610 3,343,992 2,532,979 1,113,384 Operating profit . . . . . . . . . . . . . . . . . . . . . . . . . . . . . . . . . . . . . . . . . . . . . . . . . . . . . . . . . . . . . . . . . . . . . . . . . . . . . . . . . . . . . . . . . . . . . . 665,626 572,509 223,553 Corporate expense . . . . . . . . . . . . . . . . . . . . . . . . . . . . . . . . . . . . . . . . . . . . . . . . . . . . . . . . . . . . . . . . . . . . . . . . . . . . . . . . . . . . . . . . . . . . . . 37,724 34,793 13,685 Operating income . . . . . . . . . . . . . . . . . . . . . . . . . . . . . . . . . . . . . . . . . . . . . . . . . . . . . . . . . . . . . . . . . . . . . . . . . . . . . . . . . . . . . . . . . . . . . . 627,902 537,716 209,868 Non-operating income (expense) Interest income . . . . . . . . . . . . . . . . . . . . . . . . . . . . . . . . . . . . . . . . . . . . . . . . . . . . . . . ........ . . . . . . . . . . . . . . . . . . . . . . . . . . . . . . . 6,106 12,964 2,142 Interest expense, net . . . . . . . . . . . . . . . . . . . . . . . . . . . . . . . . . . . . . . . . . . . . . . . . . . . ........ . . . . . . . . . . . . . . . . . . . . . . . . . . . . . . . (349,478) (272,856) (59,853) Interest expense from unconsolidated affiliate . . . . . . . . . . . . . . . . . . . . . . . . . . . . . . . . . ........ . . . . . . . . . . . . . . . . . . . . . . . . . . . . . . . (2,370) (2,043) (1,058) Other, net . . . . . . . . . . . . . . . . . . . . . . . . . . . . . . . . . . . . . . . . . . . . . . . . . . . . . . . . . . . ........ . . . . . . . . . . . . . . . . . . . . . . . . . . . . . . . (4,571) (741) (946) (350,313) (262,676) (59,715) Income before income taxes, extraordinary item and cumulative effect of change in accounting principle . . . . . . . . . . . . . . . . . . . . . . . . . . . . . 277,589 275,040 150,153 Provision for income taxes . . . . . . . . . . . . . . . . . . . . . . . . . . . . . . . . . . . . . . . . . . . . . . . . . . . . . . . . . . . . . . . . . . . . . . . . . . . . . . . . . . . . . . (106,996) (108,880) (55,029) Income before extraordinary item and cumulative effect of change in accounting principle . . . . . . . . . . . . . . . . . . . . . . . . . . . . . . . . . . . . . . . 170,593 166,160 95,124 Extraordinary item Loss on early retirements of debt, net of income tax benefits of $419, $2,983 and $484. . . . . . . . . . . . . . . . . . . . . . . . . . . . . . . . . . . . . . . . . . (778) (5,416) (898) Cumulative effect of change in accounting principle Preopening costs, net of income tax benefit of $4,399 . . . . . . . . . . . . . . . . . . . . . . . . . . . . . . . . . . . . . . . . . . . . . . . . . . . . . . . . . . . . . . . . . . — — (8,168) Net income . . . . . . . . . . . . . . . . . . . . . . . . . . . . . . . . . . . . . . . . . . . . . . . . . . . . . . . . . . . . . . . . . . . . . . . . . . . . . . . . . . . . . . . . . . . . . . . . . . . $ 169,815 $ 160,744 $ 86,058 Basic Income Per Share of Common Stock Income before extraordinary item and cumulative effect of change in accounting principle . . . . . ..... . . . . . . . . . . . . . . . . . . . . . . . . . . . . . .$ 1.07 $ 1.15 $ 0.82 Extraordinary item – loss on early retirements of debt, net. . . . . . . . . . . . . . . . . . . . . . . . . . . . . ..... . . . . . . . . . . . . . . . . . . . . . . . . . . . . . . — (0.04) (0.01) Cumulative effect of change in accounting principle – preopening costs, net . . . . . . . . . . . . . . . ..... . . . . . . . . . . . . . . . . . . . . . . . . . . . . . . — — (0.07) Net income per share . . . . . . . . . . . . . . . . . . . . . . . . . . . . . . . . . . . . . . . . . . . . . . . . . . . . . . ..... . . . . . . . . . . . . . . . . . . . . . . . . . . . . . .$ 1.07 $ 1.11 $ 0.74 Diluted Income Per Share of Common Stock Income before extraordinary item and cumulative effect of change in accounting principle . . . . . ..... . . . . . . . . . . . . . . . . . . . . . . . . . . . . . .$ 1.06 $ 1.13 $ 0.80 Extraordinary item – loss on early retirements of debt, net. . . . . . . . . . . . . . . . . . . . . . . . . . . . . ..... . . . . . . . . . . . . . . . . . . . . . . . . . . . . . . — (0.04) (0.01) Cumulative effect of change in accounting principle – preopening costs, net . . . . . . . . . . . . . . . ..... . . . . . . . . . . . . . . . . . . . . . . . . . . . . . . — — (0.07) Net income per share . . . . . . . . . . . . . . . . . . . . . . . . . . . . . . . . . . . . . . . . . . . . . . . . . . . . . . ..... . . . . . . . . . . . . . . . . . . . . . . . . . . . . . .$ 1.06 $ 1.09 $ 0.72 The accompanying notes are an integral part of these consolidated financial statements. 31
  • 3. Consolidated Statements of Cash Flows Year ended December 31 (In thousands) 2001 2000 1999 Cash flows from operating activities Net income . . . . . . . . . . . . . . . . . . . . . . . . . . . . . . . . . . . . . . . . . . . . . . . . . . . .............................................. $ 169,815 $ 160,744 $ 86,058 Adjustments to reconcile net income to net cash provided by operating activities: Depreciation and amortization . . . . . . . . . . . . . . . . . . . . . . . . . . . . . . . . . . . . . . . . .............. . . . . . . . . . . . . . . . . . . . . . . . . . . . 390,726 293,181 126,610 Amortization of debt discount and issuance costs . . . . . . . . . . . . . . . . . . . . . . . . . . .............. . . . . . . . . . . . . . . . . . . . . . . . . . . . 30,505 31,257 1,958 Provision for doubtful accounts . . . . . . . . . . . . . . . . . . . . . . . . . . . . . . . . . . . . . . . .............. . . . . . . . . . . . . . . . . . . . . . . . . . . . 71,244 42,016 19,597 Loss on early retirements of debt . . . . . . . . . . . . . . . . . . . . . . . . . . . . . . . . . . . . . . .............. . . . . . . . . . . . . . . . . . . . . . . . . . . . 1,197 8,399 1,382 Cumulative effect of change in accounting principle. . . . . . . . . . . . . . . . . . . . . . . . . .............. . . . . . . . . . . . . . . . . . . . . . . . . . . . — — 12,567 Write-downs and impairments . . . . . . . . . . . . . . . . . . . . . . . . . . . . . . . . . . . . . . . . .............. . . . . . . . . . . . . . . . . . . . . . . . . . . . 47,955 102,225 — Income from unconsolidated affiliate. . . . . . . . . . . . . . . . . . . . . . . . . . . . . . . . . . . . .............. . . . . . . . . . . . . . . . . . . . . . . . . . . . (34,446) (20,025) (5,026) Distributions from unconsolidated affiliate . . . . . . . . . . . . . . . . . . . . . . . . . . . . . . . . .............. . . . . . . . . . . . . . . . . . . . . . . . . . . . 36,000 24,000 — Deferred income taxes . . . . . . . . . . . . . . . . . . . . . . . . . . . . . . . . . . . . . . . . . . . . . . .............. . . . . . . . . . . . . . . . . . . . . . . . . . . . 65,619 35,595 27,489 Changes in assets and liabilities: Accounts receivable . . . . . . . . . . . . . . . . . . . . . . . . . . . . . . . . . . . . . . . . . . . . . . . . . . . ......... . . . . . . . . . . . . . . . . . . . . . . . . . . . . 23,726 (57,281) (13,884) Inventories . . . . . . . . . . . . . . . . . . . . . . . . . . . . . . . . . . . . . . . . . . . . . . . . . . . . . . . . . . ......... . . . . . . . . . . . . . . . . . . . . . . . . . . . . 7,464 4,293 (4,067) Income taxes receivable and payable . . . . . . . . . . . . . . . . . . . . . . . . . . . . . . . . . . . . . . . ......... . . . . . . . . . . . . . . . . . . . . . . . . . . . . (8,512) 71,754 (5,966) Prepaid expenses . . . . . . . . . . . . . . . . . . . . . . . . . . . . . . . . . . . . . . . . . . . . . . . . . . . . . ......... . . . . . . . . . . . . . . . . . . . . . . . . . . . . 1,070 (2,731) (9,332) Accounts payable, accrued liabilities and other . . . . . . . . . . . . . . . . . . . . . . . . . . . . . . . . ......... . . . . . . . . . . . . . . . . . . . . . . . . . . . . (8,617) 100,611 52,491 Net cash provided by operating activities . . . . . . . . . . . . . . . . . . . . . . . . . . . . . . . . . . ......... . . . . . . . . . . . . . . . . . . . . . . . . . . . . 793,746 794,038 289,877 Cash flows from investing activities Purchases of property and equipment. . . . . . . . . . . . . . . . . . . . . . . . . . . . . . . . . . . . . . . . . . . . . . . . . . . . . . . . . . . . . . . . . . . . . . . . . . . . . . (327,936) (336,499) (375,260) Acquisition of Primadonna Resorts, Inc., net of cash acquired . . . . . . . . . . . . . . . . . . . . . . . . . . . . . . . . . . . . . . . . . . . . . . . . . . . . . . . . . . . . — — (13,346) Acquisition of Mirage Resorts, Incorporated, net of cash acquired . . . . . . . . . . . . . . . . . . . . . . . . . . . . . . . . . . . . . . . . . . . . . . . . . . . . . . . . . . — (5,315,466) — Dispositions of property and equipment. . . . . . . . . . . . . . . . . . . . . . . . . . . . . . . . . . . . . . . . . . . . . . . . . . . . . . . . . . . . . . . . . . . . . . . . . . . . . 26,840 150,172 6,487 Investment in joint venture . . . . . . . . . . . . . . . . . . . . . . . . . . . . . . . . . . . . . . . . . . . . . . . . . . . . . . . . . . . . . . . . . . . . . . . . . . . . . . . . . . . . . . (38,250) — — Change in construction payable . . . . . . . . . . . . . . . . . . . . . . . . . . . . . . . . . . . . . . . . . . . . . . . . . . . . . . . . . . . . . . . . . . . . . . . . . . . . . . . . . . 3,368 (14,361) (9,507) Other . . . . . . . . . . . . . . . . . . . . . . . . . . . . . . . . . . . . . . . . . . . . . . . . . . . . . . . . . . . . . . . . . . . . . . . . . . . . . . . . . . . . . . . . . . . . . . . . . . . . . (16,227) (17,018) 4,933 Net cash used in investing activities . . . . . . . . . . . . . . . . . . . . . . . . . . . . . . . . . . . . . . . . . . . . . . . . . . . . . . . . . . . . . . . . . . . . . . . . . . . (352,205) (5,533,172) (386,693) Cash flows from financing activities Net borrowing (repayment) under bank credit facilities . . . . . . . . . . . . . . . . . . . . . . . . . . .............. . . . . . . . . . . . . . . . . . . . . . . . . . . (819,704) 2,182,386 756,045 Issuance of long-term debt . . . . . . . . . . . . . . . . . . . . . . . . . . . . . . . . . . . . . . . . . . . . . . .............. . . . . . . . . . . . . . . . . . . . . . . . . . . 400,000 1,547,052 — Retirements of debt . . . . . . . . . . . . . . . . . . . . . . . . . . . . . . . . . . . . . . . . . . . . . . . . . . . .............. . . . . . . . . . . . . . . . . . . . . . . . . . . — — (374,500) Debt issuance costs . . . . . . . . . . . . . . . . . . . . . . . . . . . . . . . . . . . . . . . . . . . . . . . . . . . .............. . . . . . . . . . . . . . . . . . . . . . . . . . . (8,529) (75,099) — Purchases of treasury stock . . . . . . . . . . . . . . . . . . . . . . . . . . . . . . . . . . . . . . . . . . . . . .............. . . . . . . . . . . . . . . . . . . . . . . . . . . (45,716) (52,579) (295,235) Sale of treasury stock . . . . . . . . . . . . . . . . . . . . . . . . . . . . . . . . . . . . . . . . . . . . . . . . . . .............. . . . . . . . . . . . . . . . . . . . . . . . . . . — 474,720 — Cash dividend paid . . . . . . . . . . . . . . . . . . . . . . . . . . . . . . . . . . . . . . . . . . . . . . . . . . . .............. . . . . . . . . . . . . . . . . . . . . . . . . . . — (11,341) — Issuance of common stock . . . . . . . . . . . . . . . . . . . . . . . . . . . . . . . . . . . . . . . . . . . . . . .............. . . . . . . . . . . . . . . . . . . . . . . . . . . 9,974 780,441 50,072 Other . . . . . . . . . . . . . . . . . . . . . . . . . . . . . . . . . . . . . . . . . . . . . . . . . . . . . . . . . . . . . .............. . . . . . . . . . . . . . . . . . . . . . . . . . . 3,437 — — Net cash provided by (used in) financing activities . . . . . . . . . . . . . . . . . . . . . . . . .............. . . . . . . . . . . . . . . . . . . . . . . . . . . (460,538) 4,845,580 136,382 Cash and cash equivalents Net increase (decrease) for the year . . . . . . . . . . . . . . . . . . . . . . . . . . . . . . . . . . . . . . . . . . . . . . . . . . . . . . . . . . . . . . . . . . . . . . . . . . . . . . . (18,997) 106,446 39,566 Balance, beginning of year . . . . . . . . . . . . . . . . . . . . . . . . . . . . . . . . . . . . . . . . . . . . . . . . . . . . . . . . . . . . . . . . . . . . . . . . . . . . . . . . . . . . . . 227,968 121,522 81,956 Balance, end of year . . . . . . . . . . . . . . . . . . . . . . . . . . . . . . . . . . . . . . . . . . . . . . . . . . . . . . . . . . . . . . . . . . . . . . . . . . . . . . . . . . . . . . . . . . $ 208,971 $ 227,968 $ 121,522 Supplemental cash flow disclosures Interest paid, net of amounts capitalized . . . . . . . . . . . . . . . . . . . . . . . . . . . . . . . . . . . . . . . . . . . . . . . . . . . . . . . . . . . . . . . . . . . . . . . . . . . . $ 317,773 $ 200,716 $ 56,035 State and federal income taxes paid . . . . . . . . . . . . . . . . . . . . . . . . . . . . . . . . . . . . . . . . . . . . . . . . . . . . . . . . . . . . . . . . . . . . . . . . . . . . . . . 19,342 30,537 26,068 The accompanying notes are an integral part of these consolidated financial statements. 32
  • 4. Consolidated Statements of Stockholders’ Equity Years ended December 31, 2001, 2000 and 1999 (In thousands, except share amounts) Other Total Common Stock Capital in Excess Teasury Retained Comprehensive Stockholders’ Shares Outstanding Par Value of Par Value Stock Earnings Income (Loss) Equity Balances, December 31, 1998 . . . . . . . . . . . . . . . . . . . . . . . 104,066,188 $ 1,161 $ 968,199 $ (210,589) $ 192,606 $ (3,146) $ 948,231 Net income . . . . . . . . . . . . . . . . . . . . . . . . . . . . . . . . . . . — — — — 86,058 — 86,058 Currency translation adjustment . . . . . . . . . . . . . . . . . . . . — — — — — 1,997 1,997 Total comprehensive income . . . . . . . . . . . . . . . . . . . . . . . — — — — — — 88,055 Issuance of common stock pursuant to stock option grants . . . . . . . . . . . . . . . . . . . . . . . . . . . 3,358,254 33 43,096 — (16) — 43,113 Issuance of common stock for Primadonna merger . . . . . . . . . . . . . . . . . . . . . . . . . . . . 19,020,606 190 243,371 — (95) — 243,466 Purchases of treasury stock . . . . . . . . . . . . . . . . . . . . . . . (12,565,200) — — (295,235) — — (295,235) Tax benefit from stock option exercises . . . . . . . . . . . . . . . — — 6,959 — — — 6,959 Dividend payable . . . . . . . . . . . . . . . . . . . . . . . . . . . . . . . — — — — (11,388) — (11,388) Balances, December 31, 1999 . . . . . . . . . . . . . . . . . . . . . . . 113,879,848 1,384 1,261,625 (505,824) 267,165 (1,149) 1,023,201 Net income . . . . . . . . . . . . . . . . . . . . . . . . . . . . . . . . . . . — — — — 160,744 — 160,744 Currency translation adjustment . . . . . . . . . . . . . . . . . . . . — — — — — (4,131) (4,131) Total comprehensive income . . . . . . . . . . . . . . . . . . . . . . . — — — — — — 156,613 Issuance of common stock pursuant to stock option grants . . . . . . . . . . . . ............... 1,244,157 13 16,880 — — — 16,893 Issuance of common stock in private placement . . . . . . . . . . . . . . . . . . . . . . . . . . . . 46,500,000 235 756,368 474,720 — — 1,231,323 Purchases of treasury stock . . . . . . . . . . . . ........... (2,493,800) — — (52,579) — — (52,579) Tax benefit from stock option exercises . . . . ........... — — 6,947 — — — 6,947 Dividend payment adjustment . . . . . . . . . . . ........... — — — — 47 — 47 Balances, December 31, 2000 . . . . . . . . . . . . . . . . . . . . . . . 159,130,205 1,632 2,041,820 (83,683) 427,956 (5,280) 2,382,445 Net income . . . . . . . . . . . . . . . . . . . . . . . . . . . . . . . . . . . — — — — 169,815 — 169,815 Currency translation adjustment . . . . . . . . . . . . . . . . . . . . — — — — — (2,086) (2,086) Derivative loss from unconsolidated affiliate . . . . . . . . . . . . — — — — — (1,784) (1,784) Total comprehensive income . . . . . . . . . . . . . . . . . . . . . . . — — — — — — 165,945 Issuance of common stock pursuant to stock option grants . . . . . . . . . . . . . . . . . . . . . . . . . .. 496,671 5 5,884 — — — 5,889 Purchases of treasury stock . . . . . . . . . . . . . . . . . . . . . .. (2,230,700) — — (45,716) — — (45,716) Tax benefit from stock option exercises . . . . . . . . . . . . . .. — — 2,137 — — — 2,137 Balances, December 31, 2001 . . . . . . . . . . . . . . . . . . . . . . . 157,396,176 $ 1,637 $ 2,049,841 $ (129,399) $ 597,771 $ (9,150) $ 2,510,700 The accompanying notes are an integral part of these consolidated financial statements. 33