More Related Content
Similar to MGM MIRAGE SuppData080207 (20)
MGM MIRAGE SuppData080207
- 1. MGM MIRAGE AND SUBSIDIARIES
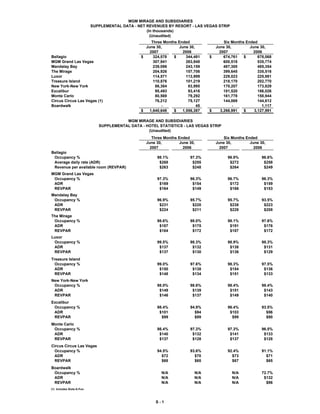
SUPPLEMENTAL DATA - NET REVENUES BY RESORT - LAS VEGAS STRIP
(In thousands)
(Unaudited)
Three Months Ended Six Months Ended
June 30, June 30, June 30, June 30,
2007 2006 2007 2006
Bellagio $ 324,578 $ 344,481 $ 674,761 $ 678,068
MGM Grand Las Vegas 307,941 263,948 600,518 535,774
Mandalay Bay 239,098 243,159 487,300 485,354
The Mirage 204,926 157,706 399,645 335,516
Luxor 114,571 113,999 229,023 225,981
Treasure Island 110,876 101,219 218,170 202,770
New York-New York 86,384 83,995 170,207 173,829
Excalibur 95,493 93,416 181,520 186,026
Monte Carlo 80,569 79,292 161,778 158,944
Circus Circus Las Vegas (1) 76,212 75,127 144,069 144,612
Boardwalk - 45 - 1,117
$ 1,640,648 $ 1,556,387 $ 3,266,991 $ 3,127,991
MGM MIRAGE AND SUBSIDIARIES
SUPPLEMENTAL DATA - HOTEL STATISTICS - LAS VEGAS STRIP
(Unaudited)
Three Months Ended Six Months Ended
June 30, June 30, June 30, June 30,
2007 2006 2007 2006
Bellagio
Occupancy % 98.1% 97.3% 96.9% 96.6%
Average daily rate (ADR) $268 $255 $272 $258
Revenue per available room (REVPAR) $263 $248 $264 $249
MGM Grand Las Vegas
Occupancy % 97.3% 96.3% 96.7% 96.3%
ADR $169 $154 $172 $159
REVPAR $164 $149 $166 $153
Mandalay Bay
Occupancy % 96.9% 95.7% 95.7% 93.5%
ADR $231 $220 $238 $223
REVPAR $224 $211 $228 $208
The Mirage
Occupancy % 98.6% 98.0% 98.1% 97.6%
ADR $187 $175 $191 $176
REVPAR $184 $172 $187 $172
Luxor
Occupancy % 99.5% 98.3% 98.9% 98.3%
ADR $137 $132 $138 $131
REVPAR $137 $130 $136 $129
Treasure Island
Occupancy % 99.0% 97.6% 98.3% 97.5%
ADR $150 $138 $154 $136
REVPAR $148 $134 $151 $133
New York-New York
Occupancy % 98.0% 98.6% 98.4% 98.4%
ADR $149 $139 $151 $143
REVPAR $146 $137 $149 $140
Excalibur
Occupancy % 98.4% 94.9% 96.4% 93.5%
ADR $101 $94 $103 $96
REVPAR $99 $89 $99 $90
Monte Carlo
Occupancy % 98.4% 97.3% 97.3% 96.5%
ADR $140 $132 $141 $133
REVPAR $137 $128 $137 $128
Circus Circus Las Vegas
Occupancy % 94.5% 93.6% 92.4% 91.1%
ADR $72 $70 $73 $71
REVPAR $68 $65 $67 $65
Boardwalk
Occupancy % N/A N/A N/A 72.7%
ADR N/A N/A N/A $132
REVPAR N/A N/A N/A $96
(1) Includes Slots-A-Fun.
S-1
- 2. MGM MIRAGE AND SUBSIDIARIES
SUPPLEMENTAL DATA - PROPERTY EBITDA BY RESORT - LAS VEGAS STRIP
(In thousands)
(Unaudited)
Three Months Ended Six Months Ended
June 30, June 30, June 30, June 30,
2007 2006 2007 2006
Bellagio $ 106,701 $ 131,040 $ 238,315 $ 241,467
MGM Grand Las Vegas 107,505 75,196 203,174 156,029
Mandalay Bay 67,632 76,766 151,287 154,982
The Mirage 58,876 41,746 112,687 107,308
Luxor 44,212 41,433 89,812 85,090
Treasure Island 34,021 28,754 67,708 60,382
New York-New York 37,290 36,276 72,194 75,491
Excalibur 38,381 35,717 69,941 71,542
Monte Carlo 31,634 32,794 65,201 55,169
Circus Circus Las Vegas (1) 23,358 21,383 42,107 40,722
CityCenter (18,386) (2,709) (32,360) (4,846)
Boardwalk - (281) - (1,840)
$ 531,224 $ 518,115 $ 1,080,066 $ 1,041,496
MGM MIRAGE AND SUBSIDIARIES
DETAIL OF CERTAIN CHARGES AFFECTING PROPERTY EBITDA - LAS VEGAS STRIP
(In thousands)
(Unaudited)
Three Months Ended June 30, 2007
Preopening and Property
start-up Restructuring transactions,
expenses costs net Total
Bellagio $ - $ - $ 50 $ 50
MGM Grand Las Vegas 1,018 - - 1,018
Mandalay Bay - - 570 570
The Mirage - - 226 226
Luxor - - 1,684 1,684
Treasure Island - - 10 10
New York-New York - - 2 2
Excalibur - - 6 6
Monte Carlo 107 - 39 146
Circus Circus Las Vegas (1) - - - -
CityCenter 6,006 - - 6,006
Boardwalk - - - -
$ 7,131 $ - $ 2,587 $ 9,718
Three Months Ended June 30, 2006
Preopening and Property
start-up Restructuring transactions,
expenses costs net Total
Bellagio $ - $ - $ 2 $ 2
MGM Grand Las Vegas 5,816 - 1,553 7,369
Mandalay Bay - - 2,758 2,758
The Mirage 4,224 - 153 4,377
Luxor - - 4,230 4,230
Treasure Island 32 - 239 271
New York-New York - - (1) (1)
Excalibur - - 322 322
Monte Carlo - - (183) (183)
Circus Circus Las Vegas (1) - - - -
CityCenter 1,746 - - 1,746
Boardwalk - 231 - 231
$ 11,818 $ 231 $ 9,073 $ 21,122
(1) Includes Slots-A-Fun.
S-2
- 3. MGM MIRAGE AND SUBSIDIARIES
DETAIL OF CERTAIN CHARGES AFFECTING PROPERTY EBITDA - LAS VEGAS STRIP (Continued)
(In thousands)
(Unaudited)
Six Months Ended June 30, 2007
Preopening and Property
start-up Restructuring transactions,
expenses costs net Total
Bellagio $ - $ - $ (225) $ (225)
MGM Grand Las Vegas 1,238 - - 1,238
Mandalay Bay - - 587 587
The Mirage - - 226 226
Luxor - - 1,659 1,659
Treasure Island - - 7 7
New York-New York - - 2 2
Excalibur - - 195 195
Monte Carlo 217 - 407 624
Circus Circus Las Vegas (1) - - 7 7
Project CityCenter 14,148 - - 14,148
Boardwalk - - - -
$ 15,603 $ - $ 2,865 $ 18,468
Six Months Ended June 30, 2006
Preopening and Property
start-up Restructuring transactions,
expenses costs (credit) net Total
Bellagio $ - $ - $ 12,334 $ 12,334
MGM Grand Las Vegas 6,735 - 1,967 8,702
Mandalay Bay - - 3,525 3,525
The Mirage 4,534 - 564 5,098
Luxor 497 - 4,221 4,718
Treasure Island 53 - 229 282
New York-New York - - (6) (6)
Excalibur - - 373 373
Monte Carlo - - 9,359 9,359
Circus Circus Las Vegas (1) - - - -
Project CityCenter 3,207 - - 3,207
Boardwalk - 1,035 - 1,035
$ 15,026 $ 1,035 $ 32,566 $ 48,627
MGM MIRAGE AND SUBSIDIARIES
SUPPLEMENTAL DATA - RECONCILIATION OF OPERATING INCOME
TO PROPERTY EBITDA - LAS VEGAS STRIP
(In thousands)
(Unaudited)
Three Months Ended June 30, 2007
Depreciation
Operating and
income (loss) amortization EBITDA
Bellagio $ 76,233 $ 30,468 $ 106,701
MGM Grand Las Vegas 82,618 24,887 107,505
Mandalay Bay 45,501 22,131 67,632
The Mirage 44,981 13,895 58,876
Luxor 34,591 9,621 44,212
Treasure Island 26,311 7,710 34,021
New York-New York 29,460 7,830 37,290
Excalibur 32,759 5,622 38,381
Monte Carlo 25,985 5,649 31,634
Circus Circus Las Vegas (1) 18,137 5,221 23,358
CityCenter (18,845) 459 (18,386)
Boardwalk - - -
$ 397,731 $ 133,493 $ 531,224
(1) Includes Slots-A-Fun.
S-3
- 4. MGM MIRAGE AND SUBSIDIARIES
SUPPLEMENTAL DATA - RECONCILIATION OF OPERATING INCOME
TO PROPERTY EBITDA - LAS VEGAS STRIP (Continued)
(In thousands)
(Unaudited)
Three Months Ended June 30, 2006
Depreciation
Operating and
income (loss) amortization EBITDA
Bellagio $ 100,158 $ 30,882 $ 131,040
MGM Grand Las Vegas 46,648 28,548 75,196
Mandalay Bay 55,531 21,235 76,766
The Mirage 27,139 14,607 41,746
Luxor 31,709 9,724 41,433
Treasure Island 21,673 7,081 28,754
New York-New York 27,932 8,344 36,276
Excalibur 31,109 4,608 35,717
Monte Carlo 25,588 7,206 32,794
Circus Circus Las Vegas (1) 16,148 5,235 21,383
CityCenter (2,709) - (2,709)
Boardwalk (281) - (281)
$ 380,645 $ 137,470 $ 518,115
Six Months Ended June 30, 2007
Depreciation
Operating and
income (loss) amortization EBITDA
Bellagio $ 176,876 $ 61,439 $ 238,315
MGM Grand Las Vegas 153,849 49,325 203,174
Mandalay Bay 107,798 43,489 151,287
The Mirage 83,241 29,446 112,687
Luxor 70,713 19,099 89,812
Treasure Island 52,160 15,548 67,708
New York-New York 56,755 15,439 72,194
Excalibur 58,782 11,159 69,941
Monte Carlo 54,161 11,040 65,201
Circus Circus Las Vegas (1) 31,741 10,366 42,107
Project CityCenter (33,400) 1,040 (32,360)
Boardwalk - - -
$ 812,676 $ 267,390 $ 1,080,066
Six Months Ended June 30, 2006
Depreciation
Operating and
income (loss) amortization EBITDA
Bellagio $ 179,935 $ 61,532 $ 241,467
MGM Grand Las Vegas 103,958 52,071 156,029
Mandalay Bay 114,069 40,913 154,982
The Mirage 80,168 27,140 107,308
Luxor 65,876 19,214 85,090
Treasure Island 46,329 14,053 60,382
New York-New York 58,791 16,700 75,491
Excalibur 62,527 9,015 71,542
Monte Carlo 40,844 14,325 55,169
Circus Circus Las Vegas (1) 30,185 10,537 40,722
Project CityCenter (4,846) - (4,846)
Boardwalk (1,840) - (1,840)
$ 775,996 $ 265,500 $ 1,041,496
(1) Includes Slots-A-Fun.
S-4