1. Reconciliation of Non-GAAP Financial Measures
to the Most Directly Comparable GAAP Measures
In Kodak’s May 4, 2006 earnings call, the Company’s Chief Executive Officer, Antonio Perez, and Chief
Financial Officer, Bob Brust, referenced certain financial measures that are deemed to be non-GAAP
financial measures, including: (1) Projected Digital EFO, (2) Projected Digital Revenue Growth, (3)
Projected and Actual Investable Cash Flow, (4) Digital Revenue Growth and Traditional Revenue Decline,
(5) SG&A Excluding Acquisitions, (6) Traditional Earnings and Digital Losses, (7) EBITDA as Included in
the Debt to EBITDA and EBITDA to Interest Ratios, and (8) Interest as Included in the EBITDA to Interest
Ratio. Kodak has prepared the following Appendix in order to provide investors with a reconciliation of
these non-GAAP measures to the most directly comparable GAAP measures in accordance with Regulation
G.
The Company believes that these non-GAAP measures represent important internal measures of
performance. Accordingly, where they are provided, it is to give investors the same financial data
management uses with the belief that this information will assist the investment community in properly
assessing the underlying performance of the Company, its financial condition, results of operations and
cash flow on a year-over-year basis.
The following reconciliations are provided with respect to terms used in the presentations of Kodak’s Chief
Executive Officer, Antonio Perez, and Chief Financial Officer, Bob Brust.
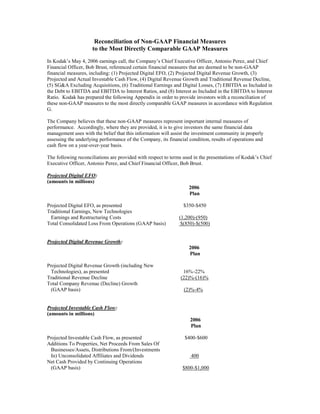
Projected Digital EFO:
(amounts in millions)
2006
Plan
Projected Digital EFO, as presented $350-$450
Traditional Earnings, New Technologies
Earnings and Restructuring Costs (1,200)-(950)
Total Consolidated Loss From Operations (GAAP basis) $(850)-$(500)
Projected Digital Revenue Growth:
2006
Plan
Projected Digital Revenue Growth (including New
Technologies), as presented 16%-22%
Traditional Revenue Decline (22)%-(16)%
Total Company Revenue (Decline) Growth
(GAAP basis) (2)%-4%
Projected Investable Cash Flow:
(amounts in millions)
2006
Plan
Projected Investable Cash Flow, as presented $400-$600
Additions To Properties, Net Proceeds From Sales Of
Businesses/Assets, Distributions From/(Investments
In) Unconsolidated Affiliates and Dividends 400
Net Cash Provided by Continuing Operations
(GAAP basis) $800-$1,000
2. Digital Revenue Growth and Traditional Revenue Decline:
Year over Year
Change
Digital Revenue Growth, as presented 29%
Traditional Revenue Decline, as presented (20)%
New Technologies Revenue Growth 78%
Total Consolidated Revenue Growth (GAAP basis), as presented 2%
Traditional Earnings & Digital Losses:
(amounts in millions)
Q1 2006 Q1 2005
Traditional Earnings, as presented $ 46 $ 105
Digital Losses, as presented (37) (51)
New Technologies Losses (40) (49)
Restructuring Costs and Other (228) (206)
Loss from Continuing Operations Before
Interest, Other Income (Charges), Net, and
Income Taxes (GAAP basis) $ (259) $ (201)
EBITDA, as Included in the Debt to EBITDA Ratio:
(amounts in millions)
The EBITDA information, as included in the Debt to EBITDA and the EBITDA to Interest Ratios,
provided to investors represents a non-GAAP measure. The table below reconciles EBITDA to Loss From
Continuing Operations Before Interest, Other Income (Charges), Net, and Income Taxes on a GAAP basis:
Rolling Four
Quarter Total Q1 2006 Q4 2005 Q3 2005 Q2 2005
EBITDA, as Included in the Debt to EBITDA Ratio,
as presented $1,293 $ 183 $ 457 $ 333 $ 320
Depreciation and Amortization (1,506) (371) (465) (396) (274)
Non-Cash Restructuring Charges and Asset
Write-Downs/Impairments (389) (56) (109) (52) (172 )
Other Adjustments, Net (88) (15) (54) (8) (11)
--------- -------- -------- -------- --------
Loss from Continuing Operations Before Interest,
Other Income (Charges), Net, and Income Taxes
(GAAP basis) $ (690) $(259) $ (171) $(123) $(137)
====== ===== ===== ===== =====
3. Interest, as Included in the EBITDA to Interest Ratio:
(amounts in millions)
The Interest Expense information, as included in the Interest Coverage Ratio, provided to investors
represents a non-GAAP measure. The table below reconciles this Interest to Interest Expense on a GAAP
basis:
Rolling Four
Quarter Total Q1 2006 Q4 2005 Q3 2005 Q2 2005
Interest Expense, as included in the EBITDA
to Interest Expense Ratio, as presented $223 $ 59 $ 63 $ 53 $ 48
Adjustments to Interest Expense for Purposes
of the Covenant Calculation 12 3 4 4 1
------- ------ ------ ------ ------
Interest Expense (GAAP basis) $235 $ 62 $ 67 $ 57 $ 49
==== ==== ==== ==== ====
Investable Cash Flow:
(amounts in millions) Q1 2006 Q1 2005 Q2 2005
Net Cash Used In Continuing Operations
Relating to Operating Activities (GAAP basis): ($481) ($223) ($207)
Additions to Properties (93) (99) (111)
Free Cash Flow (Continuing Operations) (574) (322) (318)
Net Proceeds from Sales of Businesses/Assets 6 1 21
Distributions From/(Investments In) Unconsolidated
Affiliates (8) 63 0
Acquisitions, Net of Cash Acquired 0 (47) (940)
Debt Assumed Through Acquisitions 0 0 (541)
Operating Cash Flow (Continuing Operations) (576) (305) (1778)
Acquisitions, Net of Cash Acquired 0 47 940
Debt Assumed Through Acquisitions 0 0 541
Investable Cash Flow (Continuing Operations), as
presented ($576) ($258) ($297)