1. PART II
Market For Registrant’s Common Units, Related Unitholder Matters and Issuer Purchases of
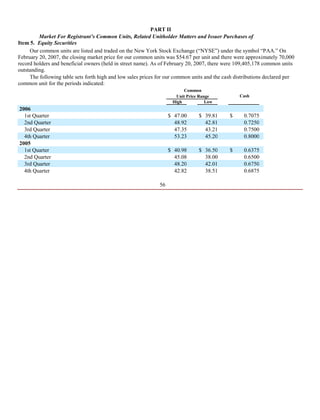
Item 5. Equity Securities
Our common units are listed and traded on the New York Stock Exchange (“NYSE”) under the symbol “PAA.” On
February 20, 2007, the closing market price for our common units was $54.67 per unit and there were approximately 70,000
record holders and beneficial owners (held in street name). As of February 20, 2007, there were 109,405,178 common units
outstanding.
The following table sets forth high and low sales prices for our common units and the cash distributions declared per
common unit for the periods indicated:
Common
Cash
Unit Price Range
High Low
Distributions(1)
2006
1st Quarter $ 47.00 $ 39.81 $ 0.7075
2nd Quarter 48.92 42.81 0.7250
3rd Quarter 47.35 43.21 0.7500
4th Quarter 53.23 45.20 0.8000
2005
1st Quarter $ 40.98 $ 36.50 $ 0.6375
2nd Quarter 45.08 38.00 0.6500
3rd Quarter 48.20 42.01 0.6750
4th Quarter 42.82 38.51 0.6875
56
2. (1) Cash distributions for a quarter are declared and paid in the following calendar quarter.
Our common units are used as a form of compensation to our employees. Additional information regarding our equity
compensation plans is included in Part III of this report under Item 13. “Certain Relationships and Related Transactions, and
Director Independence.”
Cash Distribution Policy
We will distribute to our unitholders, on a quarterly basis, all of our available cash in the manner described below.
Available cash generally means, for any quarter ending prior to liquidation, all cash on hand at the end of that quarter less the
amount of cash reserves that are necessary or appropriate in the reasonable discretion of the general partner to:
• provide for the proper conduct of our business;
• comply with applicable law or any partnership debt instrument or other agreement; or
• provide funds for distributions to unitholders and the general partner in respect of any one or
more of the next four quarters.
In addition to distributions on its 2% general partner interest, our general partner is entitled to receive incentive
distributions if the amount we distribute with respect to any quarter exceeds levels specified in our partnership agreement.
Under the quarterly incentive distribution provisions, our general partner is entitled, without duplication and except for the
agreed upon adjustment discussed below, to 15% of amounts we distribute in excess of $0.450 per unit, 25% of the amounts we
distribute in excess of $0.495 per unit and 50% of amounts we distribute in excess of $0.675 per unit.
Upon closing of the Pacific acquisition, our general partner agreed to reduce the amounts due it as incentive distributions.
The reduction will be effective for five years, as follows: (i) $5 million per quarter for the first four quarters, (ii) $3.75 million
per quarter for the next eight quarters, (iii) $2.5 million per quarter for the next four quarters, and (iv) $1.25 million per quarter
for the final four quarters. The total reduction in incentive distributions will be $65 million. The first quarterly reduction took
place in connection with the distribution paid in February 2007.
We paid $33.1 million to the general partner in incentive distributions in 2006. On February 14, 2007, we paid a quarterly
distribution of $0.80 per unit applicable to the fourth quarter of 2006. See Item 13. “Certain Relationships and Related
Transactions, and Director Independence — Our General Partner.”
Under the terms of the agreements governing our debt, we are prohibited from declaring or paying any distribution to
unitholders if a default or event of default (as defined in such agreements) exists. See Item 7. “Management’s Discussion and
Analysis of Financial Condition and Results of Operations — Liquidity and Capital Resources — Credit Facilities and Long-
term Debt.”
Issuer Purchases of Equity Securities
We did not repurchase any of our common units during the fourth quarter of fiscal 2006.
57
3. Selected Financial Data
Item The historical financial information below was derived from our audited consolidated financial statements as of
6.
December 31, 2006, 2005, 2004, 2003 and 2002 and for the years then ended. The selected financial data should be read in
conjunction with the consolidated financial statements, including the notes thereto, and Item 7. “Management’s Discussion and
Analysis of Financial Condition and Results of Operations.”
Year Ended December 31,
2006 2005 2004 2003 2002
Statement of operations data:
Total Revenues(1) $ 22,444.4 $ 31,176.5 $ 20,975.0 $ 12,589.7 $ 8,383.8
Crude oil and LPG purchases and
related costs(1) (20,819.7 ) (29,691.9 ) (19,870.9 ) (11,746.4 ) (7,741.2 )
Pipeline margin activities
purchases(1) (665.9 ) (750.6 ) (553.7 ) (486.1 ) (362.3 )
Field operating costs (369.8 ) (272.5 ) (219.5 ) (139.9 ) (106.4 )
General and administrative expenses (133.9 ) (103.2 ) (82.7 ) (73.1 ) (45.7 )
Depreciation and amortization (100.4 ) (83.5 ) (68.7 ) (46.2 ) (34.0 )
Total costs and expenses (22,089.7 ) (30,901.7 ) (20,795.5 ) (12,491.7 ) (8,289.6 )
Operating income 354.7 274.8 179.5 98.0 94.2
Interest expense (85.6 ) (59.4 ) (46.7 ) (35.2 ) (29.1 )
Equity earnings in unconsolidated
entities 7.7 1.8 0.5 0.2 0.4
Interest and other income (expense),
net 2.3 0.6 (0.2 ) (3.6 ) (0.2 )
Income tax expense (0.3 ) — — — —
Income before cumulative effect of
change in accounting principle(2) $ 278.8 $ 217.8 $ 133.1 $ 59.4 $ 65.3
Basic net income before cumulative
effect of change in accounting
principle(2) $ 2.84 $ 2.77 $ 1.94 $ 1.01 $ 1.34
Diluted net income before
cumulative effect of change in
$ 2.81 $ 2.72 $ 1.94 $ 1.00 $ 1.34
accounting principle(2)
Basic weighted average number of
limited partner units outstanding 81.1 69.3 63.3 52.7 45.5
Diluted weighted average number of
81.9 70.5 63.3 53.4 45.5
limited partner units outstanding
Balance sheet data (at end of
period):
Total assets $ 8,714.9 $ 4,120.3 $ 3,160.4 $ 2,095.6 $ 1,666.6
Total long-term debt(3) 2,626.3 951.7 949.0 519.0 509.7
Total debt 3,627.5 1,330.1 1,124.5 646.3 609.0
Partners’ capital 2,976.8 1,330.7 1,070.2 746.7 511.6
Other data:
Maintenance capital expenditures $ 28.2 $ 14.0 $ 11.3 $ 7.6 $ 6.0
Net cash provided by (used in)
operating activities(4) (275.3 ) 24.1 104.0 115.3 185.0
Net cash (used in) investing
activities(4) (1,651.0 ) (297.2 ) (651.2 ) (272.1 ) (374.9 )
Net cash provided by financing
activities 1,927.0 270.6 554.5 157.2 189.5
Declared distributions per limited
partner unit(5)(6) 2.87 2.58 2.30 2.19 2.11
Volumes (thousands of barrels per
day)(7)
Transportation segment:
Tariff activities 2,018 1,725 1,412 824 564
5. Year Ended December 31,
2006 2005 2004 2003 2002
Facilities Segment:
Crude oil, refined products and LPG storage
(average monthly capacity in millions of
barrels) 20.7 16.8 14.8 12.0 3.8
Natural gas storage, net to our 50% interest
(average monthly capacity in billions of cubic
feet) 12.9 4.3 — — —
LPG processing (thousands of barrels per day) 12.2 — — — —
Total (average monthly capacity in millions of
barrels)(8) 23.2 17.5 14.8 12.1 3.9
Marketing segment:
Crude oil lease gathering 650 610 589 437 410
LPG sales 70 56 48 38 35
Waterborne foreign crude imported 63 59 12 N/A N/A
Total 783 725 649 475 445
(1) Includes buy/sell transactions for all periods prior to the second quarter of 2006. See Note 2 to our
Consolidated Financial Statements.
(2)
Income from continuing operations before cumulative effect of change in accounting principle pro
forma for the impact of the January 1, 2006 change in our method of accounting for unit-based payment
transactions would have been $224.1 million, $136.3 million, $65.7 million, and $71.6 million for 2005,
2004, 2003 and 2002, respectively. In addition, basic net income per limited partner unit before
cumulative effect of change in accounting principle would have been $2.81 ($2.76 diluted), $1.98 ($1.98
diluted), $1.13 ($1.12 diluted) and $1.47 ($1.47 diluted) for 2005, 2004, 2003 and 2002, respectively.
Income from continuing operations before cumulative effect of change in accounting principle pro
forma for the impact of the January 1, 2004 change in our method of accounting for pipeline linefill in
third-party assets would have been $61.4 million and $64.8 million for 2003 and 2002, respectively. In
addition, basic net income per limited partner unit before cumulative effect of change in accounting
principle would have been $1.05 ($1.04 diluted) and $1.33 ($1.33 diluted) for 2003 and 2002,
respectively.
(3) Includes current maturities of long-term debt of $9.0 million at December 31, 2002 classified as long-
term because of our ability and intent to refinance these amounts under our long-term revolving credit
facilities.
(4) In conjunction with the change in accounting principle we adopted as of January 1, 2004, we have
reclassified cash flows for 2003 and prior years associated with purchases and sales of linefill on assets
that we own as cash flows from investing activities instead of the historical classification as cash flows
from operating activities.
(5) Distributions represent those declared and paid in the applicable year.
(6) Our general partner is entitled to receive 2% proportional distributions and also incentive distributions
if the amount we distribute with respect to any quarter exceeds levels specified in our partnership
agreement. See Note 5 to our Consolidated Financial Statements.
(7) Volumes associated with acquisitions represent total volumes transported for the number of days we
actually owned the assets divided by the number of days in the year.
(8) Calculated as the sum of: (i) crude oil, refined products and LPG storage capacity; (ii) natural gas
storage capacity divided by 6 to account for the 6:1 mcf of gas to crude oil barrel ratio; and (iii) LPG
processing volumes multiplied by the number of days in the month and divided by 1,000 to convert to
monthly volumes in millions.
59
6. Management’s Discussion and Analysis of Financial Condition and Results of Operations
Item 7.
Introduction
The following discussion is intended to provide investors with an understanding of our financial condition and results of
our operations and should be read in conjunction with our historical consolidated financial statements and accompanying notes.
Our discussion and analysis includes the following:
• Executive Summary
• Acquisitions and Internal Growth Projects
• Critical Accounting Policies and Estimates
• Recent Accounting Pronouncements and Change in Accounting Principle
• Results of Operations
• Outlook
• Liquidity and Capital Resources
• Off-Balance Sheet Arrangements
Executive Summary
Company Overview
We are engaged in the transportation, storage, terminalling and marketing of crude oil, refined products and liquefied
petroleum gas and other natural gas related petroleum products (liquefied petroleum gas and other natural gas related
petroleum products are collectively referred to as “LPG”). In addition, through our 50% equity ownership in PAA/Vulcan, we
develop and operate natural gas storage facilities. We were formed in September 1998, and our operations are conducted
directly and indirectly through our operating subsidiaries.
Prior to the fourth quarter of 2006, we managed our operations through two segments. Due to our growth, especially in
the facilities portion of our business (most notably in conjunction with the Pacific acquisition), we have revised the manner in
which we internally evaluate our segment performance and decide how to allocate resources to our segments. As a result, we
now manage our operations through three operating segments: (i) Transportation, (ii) Facilities, and (iii) Marketing. Our
transportation segment operations generally consist of fee-based activities associated with transporting crude oil and refined
products on pipelines and gathering systems. We generate revenue through a combination of tariffs, third-party leases of
pipeline capacity, transportation fees, barrel exchanges and buy/sell arrangements. Our facilities segment operations generally
consist of fee-based activities associated with providing storage, terminalling and throughput services for crude oil, refined
products and LPG, as well as LPG fractionation and isomerization services. We generate revenue through a combination of
month-to-month and multi-year leases and processing arrangements. Our marketing segment operations generally consist of
merchant activities associated primarily with the purchase and sale of crude oil and LPG. Our marketing activities are designed
to produce a stable baseline of results in a variety of market conditions, while at the same time providing upside exposure to
opportunities inherent in volatile market conditions. These activities utilize storage facilities at major interchange and
terminalling locations and various hedging strategies to reduce the negative impact of market volatility and provide counter-
cyclical balance.
Overview of Operating Results, Capital Spending and Significant Activities
During 2006, we recognized net income of $285.1 million and earnings per diluted limited partner unit of $2.88,
compared to net income of $217.8 million and earnings per diluted limited partner unit of $2.72 during 2005.
60
7. Both 2006 and 2005 were substantial increases over 2004. Net income was $130.0 million and earnings per diluted limited
partner unit was $1.89 for 2004. Key items impacting 2006 include:
Balance Sheet and Capital Structure
• The completion of the Pacific acquisition for approximately $2.5 billion (including the equity
issuance and assumption of debt discussed below), and six other acquisitions for aggregate
consideration of approximately $565 million.
• The issuance of 22 million limited partner units (valued at $1.0 billion) in exchange for Pacific
limited partner units as part of the Pacific acquisition and the sale of 13.4 million limited partner
units for net proceeds of approximately $621 million.
• The assumption of $433 million of senior notes as part of the Pacific acquisition and the
issuance of $1,250 million of Senior Notes for net proceeds of approximately $1,243 million.
• Capital expenditures (excluding acquisitions and maintenance capital) of $332 million.
• Limited partner distributions of $224.9 million ($2.87 per limited partner unit) and General
Partner distributions of $37.7 million paid during 2006.
Income Statement
• Favorable execution of our risk management strategies in our marketing segment in a
pronounced contango market with a high level of overall crude oil volatility.
• Increased volumes and related tariff revenues on our pipeline systems.
• An increase in field operating costs and general and administrative expenses primarily
associated with continued growth from acquisitions as well as internal growth projects and an
increase of $17 million in 2006 related to our Long-Term Incentive Plans. See “— Critical
Accounting Policies and Estimates — Critical Accounting Estimates — Long-Term Incentive
Plan Accruals.”
• A charge of approximately $4 million in 2006 resulting from the mark-to-market of open
derivative instruments pursuant to SFAS 133.
• A gain of approximately $6 million resulting from the reduction of our obligation for
outstanding LTIP awards, which was recorded as a cumulative effect of change in accounting
principle pursuant to the adoption of SFAS No. 123(R) (revised 2004), “Share-Based Payment.”
Prospects for the Future
Access to storage tankage by our marketing segment provides a counter-cyclical balance that has a stabilizing effect on
our operations and cash flow associated with this segment. The strategic use of our terminalling and storage assets in
conjunction with our gathering and marketing operations generally provides us with the flexibility to maintain a base level of
margin irrespective of crude oil market conditions and, in certain circumstances, to realize incremental margin during volatile
market conditions.
During 2006, we strengthened our business by expanding our asset base through approximately $3 billion of acquisitions
and $332 million of internal growth projects. In 2007, we intend to spend approximately $500 million on internal growth
projects and also to continue to develop our inventory of projects for implementation beyond 2007. Several of the larger
storage tank projects for 2007, such as the construction or expansion of the Patoka, Cushing and St. James terminals, are well
positioned to benefit from the importation of waterborne foreign crude oil into the Gulf Coast as well as the importation of
Canadian crude oil. We also believe there are opportunities for us to grow our LPG business. In addition, our 2005 entry into
the natural gas storage business and our 2006 entries into the refined products transportation and storage business and the barge
transportation business are consistent with our stated strategy of leveraging our assets, business model, knowledge and
expertise into businesses that are complementary to our existing activities. We will continue to look for ways to grow these
businesses and continue to evaluate opportunities in other complementary midstream business activities. Specifically, we
intend to apply our
61
8. business model to the refined products business by establishing and growing a marketing and distribution business to
complement our strategically located assets. We believe we have access to equity and debt capital and that we are well situated
to optimize our position in and around our existing assets and to expand our asset base by continuing to consolidate, rationalize
and optimize the North American midstream infrastructure.
Although we believe that we are well situated in the North American midstream infrastructure, we face various
operational, regulatory and financial challenges that may impact our ability to execute our strategy as planned. In addition, we
operate in a mature industry and believe that acquisitions will play an important role in our potential growth. We will continue
to pursue the purchase of midstream assets, and we will also continue to initiate expansion projects designed to optimize
product flows in the areas in which we operate. However, we can give no assurance that our current or future acquisition or
expansion efforts will be successful. See Item 1A. “Risk Factors — Risks Related to Our Business.”
Acquisitions and Internal Growth Projects
We completed a number of acquisitions and capital expansion projects in 2006, 2005 and 2004 that have impacted our
results of operations and enabled us to enhance our liquidity, as discussed herein. The following table summarizes our capital
expenditures for acquisitions (including equity investments), capital expansion (internal growth projects) and maintenance
capital for the periods indicated (in millions):
December 31,
2006 2005 2004
Acquisition capital(1) $ 3,021.1 $ 40.3 $ 563.9
Investment in PAA/Vulcan Gas Storage, LLC 10.0 112.5 —
Investment in Settoon Towing 33.6 — —
Internal growth projects 332.0 148.8 117.3
Maintenance capital 28.2 14.0 11.3
$ 3,424.9 $ 315.6 $ 692.5
(1) Acquisition capital includes deposits in the year the acquisition closed, rather than the year the deposit
was paid. Deposits paid were approximately $12 million for the Shell Gulf Coast Pipeline Systems
acquisition in 2004.
62
9. Internal Growth Projects
As a result of capital expansion opportunities originating from prior acquisitions, we increased our annual level of
spending on these projects by 123% in 2006 compared to 2005. The following table summarizes our 2006 and 2005 projects
(in millions):
Projects 2006 2005
St. James, Louisiana storage facility — Phase I $ 69.9 $ 15.2
St. James, Louisiana storage facility — Phase II 12.9 —
Trenton pipeline expansion 12.3 31.8
Kerrobert tankage 28.5 4.3
East Texas/Louisiana tankage 12.0 —
Spraberry System expansion 15.4 —
Cushing Phase IV and V expansions 1.1 11.2
Cushing Tankage — Phase VI 10.1 —
Cushing to Broome pipeline — 8.2
Northwest Alberta fractionator 2.2 15.6
Link acquisition asset upgrades — 9.3
High Prairie rail terminals 9.1 —
Midale/Regina truck terminal 12.7 —
Truck trailers 9.9 —
Wichita Falls tankage 7.8 —
Basin connection — Oklahoma 6.9 —
Mobile/Ten Mile tankage and metering 4.0 —
Cheyenne Pipeline Construction 10.3 —
Other Projects 106.9 53.2
Total $ 332.0 $ 148.8
Our 2006 projects included the construction and expansion of pipeline systems and crude oil storage and terminal
facilities (notably Cushing and St. James). We expect internal growth capital projects to expand further in 2007. See “—
Liquidity and Capital Resources — Capital Expenditures and Distributions Paid to Unitholders and General Partners — 2007
Capital Expansion Projects.”
Acquisitions
Acquisitions are financed using a combination of equity and debt, including borrowings under our credit facilities and the
issuance of senior notes. The businesses acquired impacted our results of operations commencing on the effective date of each
acquisition as indicated in the table below. Our ongoing acquisitions and capital expansion activities are discussed further in
“— Liquidity and Capital Resources.” See Note 3 to our Consolidated Financial Statements for additional information about
our acquisition activities.
63
10. 2006 Acquisitions
In 2006, we completed several acquisitions for aggregate consideration of approximately $3.0 billion. The Pacific merger
was material to our operations. See Note 3 to our Consolidated Financial Statements. The following table summarizes the
acquisitions that were completed in 2006, and a description of our material acquisitions follows the table (in millions):
Effective Acquisition
Acquisition Date Price Operating Segment
Transportation, Facilities,
Pacific 11/15/2006 $ 2,455.7 Marketing
Transportation
Andrews 4/18/2006 220.1 Facilities, Marketing
SemCrude 5/1/2006 129.4 Marketing
BOA/CAM/HIPS 7/31/2006 130.2 Transportation
Products Pipeline 9/1/2006 65.6 Transportation
Transportation, Facilities,
Other various 20.1 Marketing
Total $ 3,021.1
Pacific. On November 15, 2006 we completed our acquisition of Pacific pursuant to an Agreement and Plan of Merger
dated June 11, 2006. The merger-related transactions included: (i) the acquisition from LB Pacific of the general partner
interest and incentive distribution rights of Pacific as well as approximately 5.2 million Pacific common units and
approximately 5.2 million Pacific subordinated units for a total of $700 million and (ii) the acquisition of the balance of
Pacific’s equity through a unit-for-unit exchange in which each Pacific unitholder (other than LB Pacific) received 0.77 newly
issued common units of the Partnership for each Pacific common unit. The total value of the transaction was approximately
$2.5 billion, including the assumption of debt and estimated transaction costs. Upon completion of the merger-related
transactions, the general partner and limited partner ownership interests in Pacific were extinguished and Pacific was merged
with and into the Partnership. The assets acquired in the Pacific acquisition included approximately 4,500 miles of active crude
oil pipeline and gathering systems and 550 miles of refined products pipelines, over 13 million barrels of active crude oil
storage capacity and 9 million barrels of refined products storage capacity, a fleet of approximately 75 owned or leased trucks
and approximately 1.9 million barrels of crude oil and refined products linefill and working inventory. The Pacific assets
complement our existing asset base in California, the Rocky Mountains and Canada, with minimal asset overlap but attractive
potential vertical integration opportunities. The results of operations and assets and liabilities from the Pacific acquisition have
been included in our consolidated financial statements since November 15, 2006. The purchase price allocation related to the
Pacific acquisition is preliminary and subject to change. See Note 3 to our Consolidated Financial Statements.
The purchase price was allocated as follows (in millions):
Cash payment to LB Pacific $ 700.0
Value of Plains common units issued in exchange for Pacific common units 1,001.6
Assumption of Pacific debt (at fair value) 723.8
Estimated transaction costs(1) 30.3
Total purchase price $ 2,455.7
(1) Includes investment banking fees, costs associated with a severance plan in conjunction with the
acquisition and various other direct acquisition costs.
64
11. Purchase Price Allocation
Property, plant and equipment, net $ 1,411.7
Investment in Frontier 8.7
Inventory 32.6
Pipeline linefill and inventory in third party assets 63.6
Intangible assets 72.3
Goodwill(1) 843.2
Assumption of working capital and other long-term assets and liabilities, including $20.0 of
cash 23.6
Total purchase price $ 2,455.7
(1) Represents the preliminary amount in excess of the fair value of the net assets acquired and is
associated with our view of the future results of operations of the businesses acquired based on the
strategic location of the assets and the growth opportunities that we expect to realize as we integrate
these assets into our existing business strategy.
The majority of the acquisition costs associated with the Pacific acquisition was incurred as of December 31, 2006,
resulting in total cash paid during 2006 of approximately $723 million.
The following table shows our calculation of the sources of funding for the acquisition (in millions):
Fair value of Plains common units issued in exchange for Pacific common units $ 1,001.6
Plains general partner capital contribution 21.6
Assumption of Pacific debt (at estimated fair value), net of repayment of Pacific credit
facility(1) 433.1
Plains new debt incurred 999.4
Total sources of funding $ 2,455.7
(1)
The assumption of Pacific’s debt and credit facility at fair value was $433.1 million and $290.7 million,
respectively. We paid off the credit facility in connection with closing of the transaction.
Other 2006 Acquisitions. During 2006, we completed six additional acquisitions for aggregate consideration of
approximately $565 million. These acquisitions included (i) 100% of the equity interests of Andrews Petroleum and Lone Star
Trucking, which provide isomerization, fractionation, marketing and transportation services to producers and customers of
natural gas liquids (collectively, the “Andrews acquisition”), (ii) crude oil gathering and transportation assets and related
contracts in South Louisiana (SemCrude), (iii) interests in various crude oil pipeline systems in Canada and the U.S. including
a 100% interest in the BOA Pipeline, various interests in HIPS and a 64.35% interest in the CAM Pipeline system, and
(iv) three refined products pipeline systems.
In addition, in November 2006, we purchased a 50% interest in Settoon Towing for approximately $33 million. Settoon
Towing owns and operates a fleet of 57 transport and storage barges as well as 30 transport tugs. Its core business is the
gathering and transportation of crude oil and produced water from inland production facilities across the Gulf Coast.
65
12. 2005 Acquisitions
We completed six small transactions in 2005 for aggregate consideration of approximately $40.3 million. The transactions
included crude oil trucking operations and several crude oil pipeline systems along the Gulf Coast as well as in Canada. We
also acquired an LPG pipeline and terminal in Oklahoma. These acquisitions did not materially impact our results of
operations, either individually or in the aggregate. The following table summarizes our acquisitions that were completed in
2005 (in millions):
Effective
Acquisition
Acquisition Date Price Operating Segment
Shell Gulf Coast Pipeline Systems(1) 1/1/2005 $ 12.0 Transportation
Tulsa LPG Pipeline 3/2/2005 10.0 Marketing
Transportation, Facilities,
Other acquisitions Various 18.3 Marketing
Total $ 40.3
(1) A $12 million deposit for the Shell Gulf Coast Pipeline Systems acquisition was paid into escrow in
December 2004.
In addition, in September 2005, PAA/Vulcan acquired Energy Center Investments LLC (“ECI”), an indirect subsidiary of
Sempra Energy, for approximately $250 million. ECI develops and operates underground natural gas storage facilities. We
own 50% of PAA/Vulcan and the remaining 50% is owned by a subsidiary of Vulcan Capital. We made a $112.5 million
capital contribution to PAA/Vulcan and we account for the investment in PAA/Vulcan under the equity method in accordance
with Accounting Principles Board Opinion No. 18, “The Equity Method of Accounting for Investments in Common Stock.”
2004 Acquisitions
In 2004, we completed several acquisitions for aggregate consideration of approximately $563.9 million. The Link and
Capline acquisitions were material to our operations. See Note 3 to our Consolidated Financial Statements. The following table
summarizes our acquisitions that were completed in 2004, and a description of our material acquisitions follows the table (in
millions):
Effective Acquisition
Acquisition Date Price Operating Segment
Capline and Capwood Pipeline Systems (“Capline
03/01/04 $ 158.5 Transportation
acquisition”)(1)
Transportation, Facilities,
Link Energy LLC (“Link acquisition”) 04/01/04 332.3 Marketing
Cal Ven Pipeline System 05/01/04 19.0 Transportation
Schaefferstown Propane Storage Facility(2) 08/25/04 46.4 Facilities
Other various 7.7 Facilities, Marketing
Total $ 563.9
(1) Includes a deposit of approximately $16 million which was paid in December 2003 for the Capline
acquisition.
(2) Includes approximately $14.4 million of LPG operating inventory acquired.
Capline and Capwood Pipeline Systems. The principal assets acquired are: (i) an approximate 22% undivided joint
interest in the Capline Pipeline System, and (ii) an approximate 76% undivided joint interest in the Capwood Pipeline System.
The Capline Pipeline System is a 633-mile, 40-inch mainline crude oil pipeline originating in St. James, Louisiana, and
terminating in Patoka, Illinois. The Capwood Pipeline System is a 58-mile, 20-inch mainline crude oil pipeline originating in
Patoka, Illinois, and terminating in Wood River, Illinois. These pipelines provide one of the primary transportation routes for
crude oil shipped into the Midwestern U.S. and delivered to several refineries and other pipelines.
66
13. Link Energy LLC. The Link crude oil business we acquired consisted of approximately 7,000 miles of active crude oil
pipeline and gathering systems, over 10 million barrels of active crude oil storage capacity, a fleet of approximately 200 owned
or leased trucks and approximately 2 million barrels of crude oil linefill and working inventory. The Link assets complement
our assets in West Texas and along the Gulf Coast and allow us to expand our presence in the Rocky Mountain and
Oklahoma/Kansas regions.
Critical Accounting Policies and Estimates
Critical Accounting Policies
We have adopted various accounting policies to prepare our consolidated financial statements in accordance with
generally accepted accounting principles in the United States. These critical accounting policies are discussed in Note 2 to the
Consolidated Financial Statements.
Critical Accounting Estimates
The preparation of financial statements in conformity with accounting principles generally accepted in the United States
requires us to make estimates and assumptions that affect the reported amounts of assets and liabilities, as well as the
disclosure of contingent assets and liabilities, at the date of the financial statements. Such estimates and assumptions also affect
the reported amounts of revenues and expenses during the reporting period. Although we believe these estimates are
reasonable, actual results could differ from these estimates. The critical accounting policies that we have identified are
discussed below.
Purchase and Sales Accruals. We routinely make accruals based on estimates for certain components of our revenues
and cost of sales due to the timing of compiling billing information, receiving third party information and reconciling our
records with those of third parties. Where applicable, these accruals are based on nominated volumes expected to be purchased,
transported and subsequently sold. Uncertainties involved in these estimates include levels of production at the wellhead,
access to certain qualities of crude oil, pipeline capacities and delivery times, utilization of truck fleets to transport volumes to
their destinations, weather, market conditions and other forces beyond our control. These estimates are generally associated
with a portion of the last month of each reporting period. We currently estimate that less than 2% of total annual revenues and
cost of sales are recorded using estimates. Accordingly, a variance from this estimate of 10% would impact the respective line
items by less than 1% on an annual basis. In addition, we estimate that less than 4% of total operating income and less than 5%
of total net income are recorded using estimates. Although the resolution of these uncertainties has not historically had a
material impact on our reported results of operations or financial condition, because of the high volume, low margin nature of
our business, we cannot provide assurance that actual amounts will not vary significantly from estimated amounts. Variances
from estimates are reflected in the period actual results become known, typically in the month following the estimate.
Mark-to-Market Accrual. In situations where we are required to mark-to-market derivatives pursuant to SFAS 133, the
estimates of gains or losses at a particular period end do not reflect the end results of particular transactions, and will most
likely not reflect the actual gain or loss at the conclusion of a transaction. We reflect estimates for these items based on our
internal records and information from third parties. A portion of the estimates we use are based on internal models or models of
third parties because they are not quoted on a national market. Additionally, values may vary among different models due to a
difference in assumptions applied, such as the estimate of prevailing market prices, volatility, correlations and other factors and
may not be reflective of the price at which they can be settled due to the lack of a liquid market. Less than 1% of total annual
revenues are based on estimates derived from these models. Although the resolution of these uncertainties has not historically
had a material impact on our results of operations or financial condition, we cannot provide assurance that actual amounts will
not vary significantly from estimated amounts.
Contingent Liability Accruals. We accrue reserves for contingent liabilities including, but not limited to, environmental
remediation and governmental penalties, insurance claims, asset retirement obligations, taxes, and potential legal claims.
Accruals are made when our assessment indicates that it is probable that a liability has occurred and the amount of liability can
be reasonably estimated. Our estimates are based on all known facts at the time and our assessment of the ultimate outcome.
Among the many uncertainties that impact our estimates are the
67
14. necessary regulatory approvals for, and potential modification of, our environmental remediation plans, the limited amount of
data available upon initial assessment of the impact of soil or water contamination, changes in costs associated with
environmental remediation services and equipment, costs of medical care associated with worker’s compensation and
employee health insurance claims, and the possibility of existing legal claims giving rise to additional claims. Our estimates for
contingent liability accruals are increased or decreased as additional information is obtained or resolution is achieved. A
variance of 10% in our aggregate estimate for the contingent liabilities discussed above would have an approximate
$5.2 million impact on earnings. Although the resolution of these uncertainties has not historically had a material impact on our
results of operations or financial condition, we cannot provide assurance that actual amounts will not vary significantly from
estimated amounts.
Fair Value of Assets and Liabilities Acquired and Identification of Associated Goodwill and Intangible Assets. In
conjunction with each acquisition, we must allocate the cost of the acquired entity to the assets and liabilities assumed based on
their estimated fair values at the date of acquisition. We also estimate the amount of transaction costs that will be incurred in
connection with each acquisition. As additional information becomes available, we may adjust the original estimates within a
short time period subsequent to the acquisition. In addition, in conjunction with the adoption of SFAS 141, we are required to
recognize intangible assets separately from goodwill. Goodwill and intangible assets with indefinite lives are not amortized but
instead are periodically assessed for impairment. The impairment testing entails estimating future net cash flows relating to the
asset, based on management’s estimate of market conditions including pricing, demand, competition, operating costs and other
factors. Intangible assets with finite lives are amortized over the estimated useful life determined by management. Determining
the fair value of assets and liabilities acquired, as well as intangible assets that relate to such items as customer relationships,
contracts, and industry expertise involves professional judgment and is ultimately based on acquisition models and
management’s assessment of the value of the assets acquired and, to the extent available, third party assessments. Uncertainties
associated with these estimates include changes in production decline rates, production interruptions, fluctuations in refinery
capacity or product slates, economic obsolescence factors in the area and potential future sources of cash flow. Although the
resolution of these uncertainties has not historically had a material impact on our results of operations or financial condition,
we cannot provide assurance that actual amounts will not vary significantly from estimated amounts. The purchase price
allocation related to the Pacific acquisition is preliminary and subject to change. See Note 3 to our Consolidated Financial
Statements.
Long-Term Incentive Plan Accruals. We also make accruals to recognize the fair value of our outstanding LTIP awards
as compensation expense. Under generally accepted accounting principles, we are required to estimate the fair value of our
outstanding LTIP awards and recognize that fair value as compensation expense over the course of the LTIP award’s vesting
period. For LTIP awards that contain a performance condition, the fair value of the LTIP award is recognized as compensation
expense only if the attainment of the performance condition is considered probable. The amount of the actual charge to
compensation expense will be determined by the unit price on the date vesting occurs (or, in some cases, the average unit price
for a range of dates preceding the vesting date) multiplied by the number of units, plus our share of associated employment
taxes. Uncertainties involved in this estimate include the actual unit price at time of settlement, whether or not a performance
condition will be attained and the continued employment of personnel subject to the vestings.
We achieved a $3.20 annualized distribution rate and therefore we are accruing compensation expense for LTIP awards
that vest upon the attainment of that rate. We recognized total compensation expense of approximately $42.7 million in 2006
and $26.1 million in 2005 related to awards granted under our various LTIP plans. We cannot provide assurance that the actual
fair value of our LTIP awards will not vary significantly from estimated amounts. See Note 10 to our Consolidated Financial
Statements.
Goodwill. We perform our goodwill impairment test annually (as of June 30) and when events or changes in
circumstances indicate that the carrying value may not be recoverable. We consider the estimate of fair value to be a critical
accounting estimate because (a) a goodwill impairment could have a material impact on our financial position and results of
operations and (b) the estimate is based on a number of highly subjective judgments and assumptions.
Property, Plant and Equipment and Depreciation Expense. We compute depreciation using the straight-line method
based on estimated useful lives. We periodically evaluate property, plant and equipment for impairment
68
15. when events or circumstances indicate that the carrying value of these assets may not be recoverable. The evaluation is highly
dependent on the underlying assumptions of related cash flows. We consider the fair value estimate used to calculate
impairment of property, plant and equipment a critical accounting estimate. In determining the existence of an impairment in
carrying value, we make a number of subjective assumptions as to:
• whether there is an indication of impairment;
• the grouping of assets;
• the intention of “holding” versus “selling” an asset;
• the forecast of undiscounted expected future cash flow over the asset’s estimated useful
life; and
• if an impairment exists, the fair value of the asset or asset group.
Asset Retirement Obligation
We account for asset retirement obligations under SFAS No. 143 “Accounting for Asset Retirement Obligations.”
SFAS 143 establishes accounting requirements for retirement obligations associated with tangible long-lived assets, including
estimates related to (1) the time of the liability recognition, (2) initial measurement of the liability, (3) allocation of asset
retirement cost to expense and (4) subsequent measurement of the liability. SFAS 143 requires that the cost for asset retirement
should be capitalized as part of the cost of the related long-lived asset and subsequently allocated to expense using a systematic
and rational method.
Some of our assets, primarily related to our transportation segment, have contractual or regulatory obligations to perform
remediation and, in some instances, dismantlement and removal activities when the assets are abandoned. These obligations
include varying levels of activity including disconnecting inactive assets from active assets, cleaning and purging assets, and in
some cases, completely removing the assets and returning the land to its original state. The timing of the obligations is
determined relative to the date on which the asset is abandoned.
Many of our pipelines are trunk and interstate systems that transport crude oil. The pipelines with indeterminate
settlement dates have been in existence for many years and with regular maintenance will continue to be in service for many
years to come. Also, it is not possible to predict when demands for this transportation will cease and we do not believe that
such demand will cease for the foreseeable future. Accordingly, we believe the date when these assets will be abandoned is
indeterminate. With no reasonably determinable abandonment date, we cannot reasonably estimate the fair value of the
associated asset retirement obligations. We will record asset retirement obligations for these assets in the period in which
sufficient information becomes available for us to reasonably determine the settlement dates. A small portion of our contractual
or regulatory obligations are related to assets that are inactive or that we plan to take out of service and although the ultimate
timing and costs to settle these obligations are not known with certainty, we can reasonably estimate the obligation.
Recent Accounting Pronouncements and Change in Accounting Principle
Recent Accounting Pronouncements
For a discussion of recent accounting pronouncements that will impact us, see Note 2 to our Consolidated Financial
Statements.
Changes in Accounting Principle
Stock-Based Compensation
In December 2004, SFAS 123(R) was issued, which amends SFAS No. 123, “Accounting for Stock-Based
Compensation,” and establishes accounting for transactions in which an entity exchanges its equity instruments for goods or
services. This statement requires that the cost resulting from such share-based payment transactions be recognized in the
financial statements at fair value. Following our general partner’s adoption of Emerging Issues Task Force Issue No. 04-05,
“Determining Whether a General Partner, or the General Partners as a Group, Controls a Limited Partnership or Similar Entity
When the Limited Partners Have Certain Rights,” we are now part of the same consolidated group and thus SFAS 123(R) is
applicable to our general partner’s long-term incentive plan. We
69
16. adopted SFAS 123(R) on January 1, 2006 under the modified prospective transition method, as defined in SFAS 123(R), and
recognized a cumulative effect of change in accounting principle of approximately $6 million. The cumulative effect
adjustment represents a decrease to our LTIP life-to-date accrued expense and related liability under our previous cash-plan,
probability-based accounting model and adjusts our aggregate liability to the appropriate fair-value based liability as calculated
under a SFAS 123(R) methodology. Our LTIPs are administered by our general partner. We are required to reimburse all costs
incurred by our general partner through LTIP settlements. As a result, our LTIP awards are classified as liabilities under
SFAS 123(R). Under the modified prospective transition method, we are not required to adjust our prior period financial
statements for our LTIP awards.
Linefill
During the second quarter of 2004, we changed our method of accounting for pipeline linefill in third party assets.
Historically, we viewed pipeline linefill, whether in our assets or third party assets, as having long-term characteristics rather
than characteristics typically associated with the short-term classification of operating inventory. Therefore, previously we did
not include linefill barrels in the same average costing calculation as our operating inventory, but instead carried linefill at
historical cost. Following this change in accounting principle, the linefill in third party assets that we historically classified as a
portion of Pipeline Linefill on the face of the balance sheet (a long-term asset) and carried at historical cost, is included in
Inventory (a current asset) in determining the average cost of operating inventory and applying the lower of cost or market
analysis. At the end of each period, we reclassify the linefill in third party assets not expected to be liquidated within the
succeeding twelve months out of Inventory (a current asset), at average cost, and into Inventory in Third-Party Assets (a long-
term asset), which is now reflected as a separate line item on the consolidated balance sheet.
This change in accounting principle was effective January 1, 2004 and is reflected as a cumulative change in our
consolidated statement of operations for the year ended December 31, 2004. The cumulative effect of this change in accounting
principle as of January 1, 2004, is a charge of approximately $3.1 million, representing a reduction in Inventory of
approximately $1.7 million, a reduction in Pipeline Linefill of approximately $30.3 million and an increase in Inventory in
Third-Party Assets of $28.9 million.
Results of Operations
Analysis of Operating Segments
Prior to the fourth quarter of 2006, we managed our operations through two segments. Due to our growth, especially in
the facilities portion of our business most notably in conjunction with the Pacific acquisition, we have revised the manner in
which we internally evaluate our segment performance and decide how to allocate resources to our segments. As a result, we
now manage our operations through three operating segments: (i) Transportation, (ii) Facilities, and (iii) Marketing. Prior
period disclosures have been revised to reflect our change in segments.
We evaluate segment performance based on segment profit and maintenance capital. We define segment profit as
revenues less (i) purchases and related costs, (ii) field operating costs and (iii) segment general and administrative (“G&A”)
expenses. Each of the items above excludes depreciation and amortization. As a master limited partnership, we make quarterly
distributions of our “available cash” (as defined in our partnership agreement) to our unitholders. Therefore, we look at each
period’s earnings before non-cash depreciation and amortization as an important measure of segment performance. The
exclusion of depreciation and amortization expense could be viewed as limiting the usefulness of segment profit as a
performance measure because it does not account in current periods for the implied reduction in value of our capital assets,
such as crude oil pipelines and facilities, caused by aging and wear and tear. Management compensates for this limitation by
recognizing that depreciation and amortization are largely offset by repair and maintenance costs, which mitigate the actual
decline in the value of our principal fixed assets. These maintenance costs are a component of field operating costs included in
segment profit or in maintenance capital, depending on the nature of the cost. Maintenance capital, which is deducted in
determining “available cash,” consists of capital expenditures required either to maintain the existing operating capacity of
partially or fully depreciated assets or to extend their useful lives. Capital expenditures made to expand our existing capacity,
whether through construction or acquisition, are considered expansion capital expenditures,
70
17. not maintenance capital. Repair and maintenance expenditures associated with existing assets that do not extend the useful life
or expand the operating capacity are charged to expense as incurred. See Note 15 to our Consolidated Financial Statements for
a reconciliation of segment profit to consolidated income before cumulative effect of change in accounting principle.
Our segment analysis involves an element of judgment relating to the allocations between segments. In connection with
its operations, the marketing segment secures transportation and facilities services from the Partnership’s other two segments
as well as third-party service providers under month-to-month and multi-year arrangements. Inter-segment transportation
service rates are based on posted tariffs for pipeline transportation services. Facilities segment services are also obtained at
rates consistent with rates charged to third parties for similar services; however, certain terminalling and storage rates are
discounted to our marketing segment to reflect the fact that these services may be canceled on short notice to enable the
facilities segment to provide services to third parties. We believe that the estimates with respect to the rates that are charged by
our facilities segment to our marketing segment are reasonable. We also allocate certain operating expense and general and
administrative overheads between segments. We believe that the estimates with respect to the allocations are reasonable.
Transportation
As of December 31, 2006, we owned approximately 20,000 miles of active gathering and mainline crude oil and refined
products pipelines located throughout the United States and Canada as well as approximately 60 million barrels of active
above-ground crude oil, refined products and LPG storage tanks, of which approximately 30 million barrels are utilized in our
transportation segment. Our activities from transportation operations generally consist of transporting crude oil and refined
products for a fee and third-party leases of pipeline capacity (collectively referred to as “tariff activities”), as well as barrel
exchanges and buy/sell arrangements (collectively referred to as “pipeline margin activities”). In addition, we transport crude
oil for third parties for a fee using our trucks and barges. These barge transportation services are provided through our 50%
owned entity, Settoon Towing. Our transportation segment also includes our equity in earnings from our investment in Settoon
Towing, Butte and Frontier. Butte and Frontier are pipeline systems in which we own approximately 22% and 22%,
respectively. In connection with certain of our merchant activities conducted under our marketing business, we are also
shippers on a number of of our own pipelines. These transactions are conducted at published tariff rates and eliminated in
consolidation. Tariffs and other fees on our pipeline systems vary by receipt point and delivery point. The segment profit
generated by our tariff and other fee-related activities depends on the volumes transported on the pipeline and the level of the
tariff and other fees charged as well as the fixed and variable field costs of operating the pipeline. Segment profit from our
pipeline capacity leases, barrel exchanges and buy/sell arrangements generally reflect a negotiated amount.
71
18. The following table sets forth our operating results from our transportation segment for the periods indicated:
Year Ended December 31,
2006 2005 2004
(In millions)
Operating Results(1)
Revenues
Tariff revenue $ 449.5 $ 381.1 $ 309.9
Pipeline margin activities 23.6 20.0 18.1
Third-party trucking 60.9 34.1 20.9
Total pipeline operations revenues 534.0 435.2 348.9
Costs and Expenses
Pipeline margin activities purchases (3.2 ) (2.0 ) (1.5 )
Third-party trucking (68.1 ) (48.2 ) (26.4 )
Field operating costs (excluding LTIP charge) (200.7 ) (164.5 ) (131.0 )
LTIP charge — operations(3) (4.5 ) (1.0 ) (0.6 )
Segment G&A expenses (excluding LTIP charge)(2) (42.9 ) (40.2 ) (36.6 )
LTIP charge — general and administrative(3) (16.3 ) (10.6 ) (3.4 )
Equity in earnings from unconsolidated entities 1.9 0.8 0.5
Segment profit $ 200.2 $ 169.5 $ 149.9
Maintenance capital $ 20.0 $ 8.5 $ 7.7
Segment profit per barrel $ 0.26 $ 0.26 $ 0.28
Average Daily Volumes (thousands of barrels per day)(4)
Tariff activities
All American 49 51 54
Basin 332 290 265
BOA/CAM 89 N/A N/A
Capline 160 132 123
Cushing to Broome 73 66 N/A
North Dakota/Trenton 89 77 39
West Texas/New Mexico Area Systems(5) 433 428 338
Canada 272 255 263
Other 521 426 330
Total tariff activities 2,018 1,725 1,412
Pipeline margin activities 88 74 74
2,106 1,799 1,486
Transportation Activities Total
(1) Revenues and purchases include intersegment amounts.
(2) Segment G&A expenses reflect direct costs attributable to each segment and an allocation of other
expenses to the segments based on management’s assessment of the business activities for that period.
The proportional allocations by segment require judgment by management and may be adjusted in the
future based on the business activities that exist during each period.
(3)
Compensation expense related to our 1998 Long-Term Incentive Plan (“1998 LTIP”), our 2005 Long-
Term Incentive Plan (“2005 LTIP”), and our 2006 Long-Term Incentive Tracking Unit Plan (“2006
Plan” and, together with the 1998 Plan and 2005 Plan, the “Long-Term Incentive Plans” or “LTIP”).
72
19. (4) Volumes associated with acquisitions represent total volumes transported for the number of days we
actually owned the assets divided by the number of days in the period.
(5) The aggregate of multiple systems in the West Texas/New Mexico area.
Segment profit, our primary measure of segment performance, was impacted by the following:
• Increased volumes and related tariff revenues — The increase in tariff revenues resulted from
(i) higher volumes primarily from multi-year contracts on our Basin and Capline systems
entered into during the third quarter of 2006 and the second quarter of 2006, respectively,
(ii) increased volumes associated with the acquisition of the BOA/CAM/HIPS systems,
(iii) higher volumes on various other systems, and (iv) increased revenues from loss allowance
oil. As is common in the industry, our crude oil tariffs incorporate a “loss allowance factor” that
is intended to offset losses due to evaporation, measurement and other losses in transit. The loss
allowance factor averages approximately 0.2%, by volume. We value the variance of allowance
volumes to actual losses at the average market value at the time the variance occurred and the
result is recorded as either an increase or decrease to tariff revenues. Gains or losses on
subsequent sales of allowance oil barrels are also included in tariff revenues. Increased volumes
and higher crude oil prices during 2006 as compared to 2005 have resulted in increased
revenues related to loss allowance oil. The average NYMEX crude oil price for 2006 was
$66.27 per barrel versus $56.65 in 2005 and $41.29 in 2004. The increase in volumes and
related tariff revenues in 2005 versus 2004 is primarily related to the Link acquisition and other
acquisitions completed during 2005 and 2004. The increase primarily resulted from the
inclusion of the related assets for the entire 2005 period versus only a portion of the 2004
period.
• Increased field operating costs — Field operating costs have increased for most categories of
costs for 2006 as we have continued to grow through acquisitions and expansion projects. The
most significant cost increases in 2006 have been related to (i) payroll and benefits, (ii) utilities,
(iii) integrity work, and (iv) property taxes. Utilities increased approximately $10 million in
2006 over the prior year due to a variety of factors including (i) an increase in electricity
consumption related to increased volumes, partially offset by lower electricity market prices and
(ii) a true-up of prior and current accruals following receipt of final billing information upon
expiration of an existing term arrangement with a significant electricity provider. Our costs
increased in 2005 as compared to 2004, primarily from the Link acquisition and other
acquisitions completed during 2004. The 2005 increased costs primarily relate to (i) payroll and
benefits, (ii) emergency response and environmental remediation of pipeline releases,
(iii) maintenance and (iv) utilities.
• Increased segment G&A expenses — Segment G&A expenses excluding LTIP charges were
relatively flat in 2006 compared to 2005. The increase in segment G&A expenses in 2005 is
primarily related to the acquisition activity.
• Increased LTIP expenses — LTIP charges included in field operating costs and segment G&A
expenses increased approximately $9 million in 2006 over 2005, primarily as a result of an
increase in our unit price to $51.20 at December 31, 2006 from $39.57 at December 31, 2005.
LTIP-related charges increased approximately $8 million in 2005 over 2004, primarily as a
result of LTIP grants made in 2005 and an increase in our unit price. Our unit price at
December 31, 2004 was $37.74 per unit. See Note 10 to our Consolidated Financial Statements.
73
20. As discussed above, the increase in transportation segment profit is largely related to our acquisition activities. We have
completed a number of acquisitions during 2006, 2005 and 2004 that have impacted our results of operations. The following
table summarizes the year-over-year impact that recent acquisitions and expansion projects have had on tariff revenue and
volumes:
Change in the Periods for the Year Ended
December 31,
2006 vs 2005 2005 vs 2004
Volumes Volumes
Revenue
(Volumes in thousands of Revenueper day and
barrels
s s
revenues in millions)
Tariff activities(1)(2)(3)
2006 acquisitions/expansions $ 32.8 178 $ N/A N/A
2005 acquisitions/expansions 5.7 8 14.1 96
2004 acquisitions/expansions 2.7 28 22.6 140
2003 acquisitions/expansions 6.2 10 13.0 17
All other pipeline systems 21.0 69 21.5 60
$ 68.4 293 $ 71.2 313
Total tariff activities
(1) Revenues include intersegment amounts.
(2) Volumes associated with acquisitions represent total volumes transported for the number of days we
actually owned the assets divided by the number of days in the year.
(3) To the extent there has been an expansion to one of our existing pipeline systems, any incremental
revenues and volumes from the expansion are included in the category for the period that the pipeline
was acquired. For new pipeline systems that we construct, incremental revenues and volumes are
included in the period the system became operational.
In 2006, average daily volumes from our tariff activities increased by approximately 300 thousand barrels per day or 17%
and tariff revenues increased by approximately $68 million or 18%. The increase in volumes and tariff revenues is attributable
to a combination of the following factors:
• Pipeline systems acquired or brought into service during 2006, which contributed
approximately 178,000 barrels per day and $33 million of revenues during 2006;
• Revenues from some of the Canadian pipeline systems increased approximately $9 million in
2006 primarily due to the appreciation of Canadian currency (the Canadian to US dollar
exchange rate appreciated to an average of 1.13 to 1 for 2006 compared to an average of 1.21 to
1 in 2005);
• An increase of approximately $7 million from our loss allowance oil primarily resulting from
higher crude oil prices;
• Volumes and revenues from pipeline systems in which we entered into new multi-year
contracts with shippers, which contributed approximately 70,000 barrels per day and
approximately $4 million of revenues during 2006; and
• Increased volumes and revenues from the North Dakota/Trenton pipeline system resulting from
our expansion activities on that system.
In 2005, average daily volumes from our tariff activities increased by approximately 300 thousand barrels per day or 22%
and revenues from our tariff activities increased by approximately $71 million or 23%. The increase in total revenues is
attributable to a combination of the following factors:
• Pipeline systems acquired or brought into service during 2005, which contributed
approximately 96,000 barrels per day and $14.1 million of revenues during 2005.
Approximately 66,000 barrels per day and $7.2 million of revenues are attributable to our
recently constructed Cushing to Broome pipeline system.
74
21. • Volumes and revenues from pipeline systems acquired in 2004 increased in 2005 as compared
to 2004, reflecting the following:
— An increase of 118,000 barrels per day and $15.8 million of revenues from the pipelines
acquired in the Link acquisition, reflecting the inclusion of these systems for the entire 2005
period as compared to only a portion of the 2004 period. The 2005 period also includes
(i) increased revenues from our loss allowance oil resulting from higher crude oil prices and
(ii) increased revenues from the North Dakota/Trenton pipeline system resulting from our
expansion activities on that system. These increases were partially offset by the impact of a
reduction in tariff rates that were voluntarily lowered to encourage third party shippers.
Transportation segment profit was reduced by approximately $12.0 million because of these
market rate adjustments. As a result of these lower tariffs on barrels shipped by us in
connection with our gathering and marketing activities, segment profit from marketing was
increased by a comparable amount,
— An increase of 17,000 barrels per day and $4.4 million of revenues from the pipelines
acquired in the Capline acquisition, reflecting the inclusion of these systems for the entire
2005 period as compared to only a portion of the 2004 period, and
— An increase of 5,000 barrels per day and $2.4 million of revenues from other businesses
acquired in 2004.
• Volumes and revenues from pipeline systems acquired in 2003 increased in 2005 as compared
to 2004, reflecting the following:
— An increase of 5,000 barrels per day and $5.2 million of revenues from the Red River
pipeline system acquisition, reflecting increased tariff rates on the system, partially related to
the quality of crude oil shipped,
— An increase of $3.0 million of revenues related to higher realized prices on our loss
allowance oil, and
— An increase of 12,000 barrels per day and $4.8 million of revenues in 2005 compared to 2004
from other businesses acquired in 2003, primarily related to higher volumes.
• Revenues from all other pipeline systems also increased in 2005, along with a slight increase in
volumes. The increase in revenues is related to several items including:
— The appreciation of Canadian currency (the Canadian to U.S. dollar exchange rate
appreciated to an average of 1.21 to 1 for 2005 compared to an average of 1.30 to 1 in
2004), and
— Volume increases on certain of our systems, partially related to a shift of certain minor
pipeline systems from our marketing segment.
Maintenance Capital
For the years ended December 31, 2006, 2005 and 2004, maintenance capital expenditures for our transportation segment
were approximately $20.0 million, $8.5 million and $7.7 million, respectively. The increase in 2006 is due to our continued
growth through acquisitions and expansion projects.
Facilities
As of December 31, 2006, we owned approximately 60 million barrels of active above-ground crude oil, refined products
and LPG storage tanks, of which approximately 30 million barrels are included in our facilities segment. The remaining tanks
are utilized in our transportation segment. At year end 2006, the Partnership was in the process of constructing approximately
12.5 million barrels of additional above ground terminalling and storage facilities, which we expect to place in service during
2007 and 2008.
Our facilities segment generally consists of fee-based activities associated with providing storage, terminalling and
throughput services for crude oil, refined products and LPG, as well as LPG fractionation and isomerization
75
22. services. On a stand-alone basis, segment profit from facilities activities is dependent on the storage capacity leased, volume of
throughput and the level of fees for such services.
We generate fees through a combination of month-to-month and multi-year leases and processing arrangements. Fees
generated in this segment include (i) storage fees that are generated when we lease tank capacity and (ii) terminalling fees, or
throughput fees, that are generated when we receive crude oil or refined products from one connecting pipeline and redeliver
crude oil or refined products to another connecting carrier.
Our facilities segment also includes our equity earnings from our investment in PAA/Vulcan. At December 31, 2006,
PAA/Vulcan owned and operated approximately 25.7 billion cubic feet of underground storage capacity and was constructing
an additional 24 billion cubic feet of underground storage capacity.
Total revenues for our facilities segment have increased over the three-year period ended December 31, 2006. The
revenue increase in each period is driven primarily by increased volumes resulting from our acquisition activities and, to a
lesser extent, tankage construction projects completed in 2005 and 2006.
The following table sets forth our operating results from our facilities segment for the periods indicated:
December 31,
2006 2005 2004
(In millions, except per barrel amounts)
Operating Results
Storage and Terminalling Revenues(1) $ 87.7 $ 41.9 $ 33.9
Field operating costs (39.6 ) (17.8 ) (11.0 )
LTIP charge — operations(3) (0.1 ) — —
Segment G&A expenses (excluding LTIP charge)(2) (13.5 ) (7.7 ) (3.6 )
LTIP charge — general and administrative(3) (5.7 ) (2.2 ) (1.1 )
Equity earnings in unconsolidated entities 5.8 1.0 —
Segment profit $ 34.6 $ 15.2 $ 18.2
Maintenance capital $ 4.9 $ 1.1 $ 2.0
Segment profit per barrel $ 1.49 $ 0.87 $ 1.23
Volumes (millions of barrels)(4)
Crude oil, refined products and LPG storage (average
20.7 16.8 14.8
monthly capacity in millions of barrels)
Natural gas storage, net to our 50% interest (average monthly
12.9 4.3 —
capacity in billions of cubic feet)
LPG processing (thousands of barrels per day) 12.2 — —
Facilities activities total (average monthly capacity in
23.2 17.5 14.8
millions of barrels)(5)
(1) Revenues include intersegment amounts.
(2) Segment G&A expenses reflect direct costs attributable to each segment and an allocation of other
expenses to the segments based on management’s assessment of the business activities for that period.
The proportional allocations by segment require judgment by management and may be adjusted in the
future based on the business activities that exist during each period.
(3) Compensation expense related to our Long-Term Incentive Plans.
(4) Volumes associated with acquisitions represent total volumes for the number of months we actually
owned the assets divided by the number of months in the period.
(5) Calculated as the sum of: (i) crude oil, refined products and LPG storage capacity; (ii) natural gas
storage capacity divided by 6 to account for the 6:1 mcf of gas to crude oil barrel ratio; and (iii) LPG
processing
76
23. volumes multiplied by the number of days in the month and divided by 1,000 to convert to monthly
volumes in millions.
Segment profit (our primary measure of segment performance) and revenues were impacted in 2006 by the following:
• Increased revenues from crude facilities — The increase in volumes and related revenues
during 2006 primarily relates to (i) increased volumes stored due to a pronounced contango
market, (ii) the Pacific acquisition and other acquisitions completed during 2006 and 2005, and
(iii) the utilization of capacity at the Mobile facility that was acquired from Link in 2004 but not
used extensively until 2006;
• Increased revenues from LPG facilities — The increase in volumes and related revenues during
2006 primarily relates to four LPG facilities that were brought into service during 2005 but
were operational for the entire 2006 period compared to only a portion of 2005;
• Increased revenues from refined product storage and terminalling — The Pacific acquisition
introduced a refined products storage and terminalling revenue stream in 2006, which
contributed additional revenues of $5.3 million; and
• Increased revenues from LPG processing — The acquisition of the Shafter processing facility
during 2006 resulted in additional processing revenues of approximately $24 million.
Segment profit was also impacted in 2006 by the following:
• Increased field operating costs — Our continued growth, primarily from the acquisitions
completed during 2006 and 2005 and the additional tankage added in 2006 and 2005, is the
principal cause of the increase in field operating costs in 2006. Of the total increase,
$10.9 million relates to the operating costs associated with the Shafter processing facility. The
remainder of the increase in operating costs primarily relate to (i) payroll and benefits,
(ii) maintenance and (iii) utilities;
• Increased segment G&A expenses — Segment G&A expenses excluding LTIP charges
increased in 2006 compared to 2005 primarily as a result of an increase in the indirect costs
allocated to the facilities segment in 2006 as the operations have grown in that period;
• Increased LTIP expenses — LTIP charges included in field operating costs and segment G&A
expenses increased approximately $3.6 million in 2006 over 2005, primarily as a result of an
increase in our unit price to $51.20 at December 31, 2006 from $39.57 at December 31, 2005.
LTIP related charges increased approximately $1.1 million in 2005 over 2004 primarily as a
result of LTIP grants made in 2005 and an increase in our unit price. Our unit price at
December 31, 2004 was $37.74 per unit (see Note 10 to our Consolidated Financial
Statements); and
• Increased equity in earnings from unconsolidated entities — Our investment in PAA/Vulcan
contributed $4.8 million in additional earnings, reflecting the inclusion of this investment for
the entire 2006 period compared to only two months in 2005.
Segment profit and revenues also increased in 2005 compared to 2004 and were impacted by the following:
• Increased revenues from crude facilities — The increase in volumes and related revenues
during 2005 primarily relates to (i) increased volumes stored due to a pronounced contango
market, (ii) acquisitions completed during 2005 and 2004, and (iii) increased throughput at our
Cushing terminal; and
• Increased revenues from LPG facilities — The increase in volumes and related revenues during
2005 primarily relates to acquisitions of new facilities completed during 2005; at the end of
2005, we owned ten facilities compared to four at the beginning of 2004.
Segment profit in 2005 was also impacted by the following:
• Increased field operating costs — Our continued growth, primarily from the acquisitions
completed during 2005 and 2004 and the additional tankage added in 2005 and 2004, is the
principal cause of the increase in
77
24.
25. field operating costs in 2005. The increased costs primarily relate to (i) payroll and benefits,
(ii) maintenance and (iii) utilities; and
• Increased segment G&A expenses — Segment G&A expenses excluding LTIP charges
increased in 2005 compared to 2004 primarily as a result of an increase in the indirect costs
allocated to the facilities segment in 2005 as the operations grew in that period. LTIP related
charges increased approximately $1.1 million in 2005 over 2004 primarily as a result of LTIP
grants made in 2005 and an increase in our unit price. Our unit price at December 31, 2004 was
$37.74 per unit.
Maintenance Capital
For the years ended December 31, 2006, 2005 and 2004, maintenance capital expenditures for our facilities segment were
approximately $4.9 million, $1.1 million and $2.0 million, respectively. The increase in 2006 is primarily due to additional
maintenance requirements at our Alto and Shafter facilities.
Marketing
Our revenues from marketing activities reflect the sale of gathered and bulk-purchased crude oil and LPG volumes, as
well as marketing of natural gas liquids, plus the sale of additional barrels exchanged through buy/sell arrangements entered
into to supplement the margins of the gathered and bulk-purchased volumes. Because the commodities that we buy and sell are
generally indexed to the same pricing indices for both the purchase and the sale, revenues and costs related to purchases will
increase and decrease with changes in market prices. However, the margins related to those purchases and sales will not
necessarily have corresponding increases and decreases. We do not anticipate that future changes in revenues will be a primary
driver of segment profit. Generally, we expect our segment profit to increase or decrease directionally with increases or
decreases in our marketing segment volumes (which consist of (i) lease gathered volumes, (ii) LPG sales, and (iii) waterborne
foreign crude imported) as well as the overall volatility and strength or weakness of market condition and the allocation of our
assets among our various hedge positions. In addition, the execution of our risk management strategies in conjunction with our
assets can provide upside in certain markets. Although we believe that the combination of our lease gathered business and our
hedging activities provides a counter-cyclical balance that provides stability in our margins, these margins are not fixed and
may vary from period to period.
Revenues from our marketing operations were approximately $22.1 billion, $30.9 billion and $20.8 billion for the years
ended December 31, 2006, 2005 and 2004, respectively. Total revenues for our marketing segment decreased in 2006 as
compared to 2005 due to a combination of the following factors:
• A decrease in our 2006 revenues due to the adoption of EITF 04-13 which was equally offset
with purchases and related costs and does not impact segment profit (see Note 2 to our
Consolidated Financial Statements); offset by
• An increase in the average NYMEX price for crude oil in 2006 as compared to 2005. The
average NYMEX price for crude oil was $66.27, $56.65 and $41.29 per barrel for the years
ended December 31, 2006, 2005 and 2004, respectively. Because the barrels that we buy and
sell are generally indexed to the same pricing indices, revenues and purchases will increase and
decrease with changes in market prices without significant changes to our margins related to
those purchases and sales.
78
26. In order to evaluate the performance of this segment, management focuses on the following metrics: (i) segment profit,
(ii) marketing segment volumes and (iii) segment profit per barrel calculated on these volumes. The following table sets forth
our operating results from our marketing segment for the comparable periods indicated:
December 31,
2006 2005 2004
(In millions, except per barrel amounts)
Operating Results(1)
Revenues(2)(3) $ 22,060.8 $ 30,893.0 $ 20,750.7
Purchases and related costs(4)(5) (21,640.6 ) (30,578.4 ) (20,551.2 )
Field operating costs (excluding LTIP charge) (136.6 ) (94.4 ) (80.9 )
LTIP charge — operations(6) (0.1 ) (2.3 ) —
Segment G&A expenses (excluding LTIP charge)(7) (39.5 ) (32.5 ) (35.2 )
LTIP charge — general and administrative(6) (16.0 ) (10.0 ) (2.8 )
Segment profit(3) $ 228.0 $ 175.4 $ 80.6
SFAS 133 mark-to-market adjustment(3) $ (4.4 ) $ (18.9 ) $ 1.0
Maintenance capital $ 3.3 $ 4.4 $ 1.6
Segment profit per barrel(8) $ 0.80 $ 0.66 $ 0.34
Average Daily Volumes (thousands of barrels
per day)(9)
Crude oil lease gathering 650 610 589
LPG sales 70 56 48
Waterborne foreign crude imported 63 59 12
783 725 649
Marketing Activities Total
(1) Revenues and purchases and related costs include intersegment amounts.
(2)
Includes revenues associated with buy/sell arrangements of $4,761.9 million, $16,274.9 million and
$11,396.8 million for the years ended December 31, 2006, 2005 and 2004, respectively. Volumes
associated with these arrangements were approximately 919,500, 851,900 and 800,700 barrels per day
for the years ended December 31, 2006, 2005 and 2004, respectively. The previously referenced
amounts include certain estimates based on management’s judgment; such estimates are not expected to
have a material impact on the balances. See Note 2 to our Consolidated Financial Statements.
(3) Amounts related to SFAS 133 are included in revenues and impact segment profit.
(4)
Includes purchases associated with buy/sell arrangements of $4,795.1 million, $16,106.5 million and
$11,280.2 million for the years ended December 31, 2006, 2005 and 2004, respectively. Volumes
associated with these arrangements were approximately 926,800, 851,900 and 800,700 barrels per day
for the years ended December 31, 2006, 2005 and 2004, respectively. The previously referenced
amounts include certain estimates based on management’s judgment; such estimates are not expected to
have a material impact on the balances. See Note 2 to our Consolidated Financial Statements.
(5)
Purchases and related costs include interest expense on contango inventory purchases of $49.2 million,
$23.7 million and $2.0 million for the years ended December 31, 2006, 2005 and 2004, respectively.
(6) Compensation expense related to our Long-Term Incentive Plans.
(7) Segment G&A expenses reflect direct costs attributable to each segment and an allocation of other
expenses to the segments based on management’s assessment of the business activities for that period.
The proportional allocations by segment require judgment by management and may be adjusted in the
future based on the business activities that exist during each period.
79