Influence of culture linked gender and age on social competence of higher sec...
Fragmentacion urbana
1. H
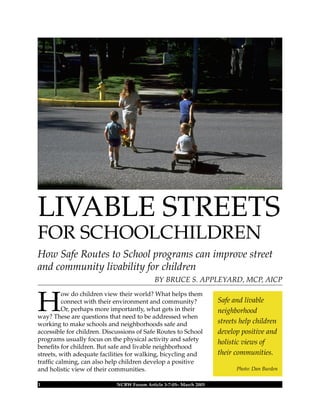
ow do children view their world? What helps them
connect with their environment and community?
Or, perhaps more importantly, what gets in their
way? These are questions that need to be addressed when
working to make schools and neighborhoods safe and
accessible for children. Discussions of Safe Routes to School
programs usually focus on the physical activity and safety
benefits for children. But safe and livable neighborhood
streets, with adequate facilities for walking, bicycling and
traffic calming, can also help children develop a positive
and holistic view of their communities.
1 NCBW Forum Article 3-7-05– March 2005
Safe and livable
neighborhood
streets help children
develop positive and
holistic views of
their communities.
Photo: Dan Burden
LIVABLE STREETS
FOR SCHOOLCHILDREN
How Safe Routes to School programs can improve street
and community livability for children
BY BRUCE S. APPLEYARD, MCP, AICP
2. This article examines how mapping exercises with schoolchildren can reveal the
influence of travel conditions on perceptions of the neighborhood environment. This, in
turn, can help communities identify, prioritize, and generate support for improvements
that will make the routes leading to school safe and inviting for walkers and bicyclists.
This research further demonstrates how exposure to heavy traffic negatively affects
children’s perceptions of their environment, and how installing pedestrian and bicycle
improvements can quickly improve those perceptions. This shift in perceptions may not
only encourage more physical activity, but can also strengthen the connection between
children and their communities. In sum, safe school-area streets for walking and
bicycling improve a neighborhood’s livability from a child’s vantage point.
Children are highly dependent on cars (and their drivers 1
) for mobility, and, at the
same time, they are at the greatest risk from the threats posed by speeding traffic.2,3
“Look both ways and wait for the cars before you cross the street!,” parents will instruct
their children. If a road is busy with speeding traffic and has no sidewalks and/or
bike lanes, parents will likely tell their kids to avoid it altogether. The underlying
message is clear — cars rule our streets and, consequently, many of our neighborhoods
— effectively isolating our children from the surrounding community and limiting the
range of activities they can participate in along the way to growing up.
This limit on independent mobility decreases children’s opportunity to be physically
fit and healthy. But it may also have an impact on aspects of their mental health by way
of diminished ability to independently experience and learn about the world around
them.
2 NCBW Forum Article 3-7-05– March 2005
The underlying message is clear: cars rule our streets, effectively isolating our
children from the surrounding community. Photo: John Williams
3. As auto-dependent development has become the norm,
we have seen an alarming downward trend in children
independently walking and biking to school. A recent poll
found that while 71 percent of adults walked or bicycled
to school when they were young, only 18 percent of their
children do so. The movement to create Safe Routes to
School has focused in large part on helping children get
back on their feet and on their bicycles in order to get
more healthy exercise as part of their daily routine. This is
important: the portion of children who are overweight or
obese has quadrupled in the last 25 years.4
But creating safe
streets may also have a fundamental impact on children’s
sense of well-being in their neighborhood and their
connection to their community.
Cognitive mapping exercises dramatically illustrate how children (and adults)
perceive their environment, and how doing something as simple as building a
pathway can change those perceptions. This article focuses on a cognitive mapping
exercise conducted in schools in Contra Costa County in the San Francisco Bay Area.
This exercise demonstrated how high traffic affects children’s perceptions of their
community and how making improvements can quickly change those perceptions and
help children have a more positive view of their community.
COGNITIVE MAPPING
The practice of cognitive or image mapping originated in the field of psychology
and was introduced to a broad audience of urban designers and planners by Kevin
Lynch. Through his seminal work, The Image of the City, Lynch classified the physical,
perceptible objects of an environment into five elements: Paths, Edges, Nodes, Districts,
and Landmarks. Image mapping has been used by urban planners to help identify
important destinations, preferred routes of travel, and barriers in a community.
My father, Donald Appleyard, a student then faculty colleague of Lynch’s, used
mapping exercises to conduct a renowned study on the impacts of traffic on street
and community livability. He did this by comparing three residential streets in San
Francisco, similar in many respects, except for their traffic levels. Some of his major
findings were that as traffic volumes increase, quality of life factors that lead to healthy
and strong communities (e.g., social connections, size of home territory, neighborhood
pride and property values) decrease. In adapting to these traffic impacts, residents
would withdraw and retreat into the backs of their homes and away from the street
and, consequently, their community. He also found that children and the elderly were
particularly vulnerable to the negative affects of traffic exposure.
Figure 1 (following page) graphically represents the inverse relationship between
social ties (shown by the lines across the streets) and vehicular traffic, which increases
from top to bottom. In the top street, where there is light vehicular traffic, there are
many social connections and an active street-life. Whereas in the bottom street, the
reverse can be seen with heavy traffic and fewer social ties. In sum, this image shows
how community ties can actually be knit together by a street that is livable and inviting
3 NCBW Forum Article 3-7-05– March 2005
A recent poll
found that while 71
percent of adults
walked or bicycled
to school when they
were young, only
18 percent of their
children do so.
4. 4 NCBW Forum Article 3-7-05– March 2005
Figure 1: This image shows how community ties can actually be knit together by a street that is
livable and inviting — or torn apart when auto traffic noise, pollution, and threats dominate the
street environment.
Source: Figure 3, page 21, Livable Streets, Donald Appleyard, University of California Press, 1981.
5. 5 NCBW Forum Article 3-7-05– March 2005
Figure 2: This illustration shows how a resident’s sense of their home territories shrinks as traffic
grows heavier and faster.
Source: Figure 4, page 23, Livable Streets, Donald Appleyard, University of California Press, 1981.
6. or, alternatively, they can be torn apart when auto traffic noise,
pollution and threats dominate the street environment.
Additionally, Figure 2 shows how residents’ sense of their home
territories shrinks as traffic grows heavier and faster. When heavy
traffic forces residents to retreat into the backs of their homes and
away from the street, the areas in front of homes — that could
be vibrant places for children to play and neighbors to socialize
— are left empty of street-life. As a result, few “watchful eyes” are
left to enhance neighborhood safety.
Following on the legacy of my father’s work, I initiated a
study to explore how traffic affects children’s perceptions of
their environment, focusing specifically on the community
environment between home and school. Early in the study, I
worked with two colleagues, Vijay Jayachandran and Marcus
Diederich, to conduct focused interviews and mapping exercises
with nine- and ten-year-olds, having them draw free-form maps
of their neighborhood between home and school.
One conclusion was immediately obvious: being part of
traffic profoundly affects children’s perceptions. Many children
primarily experience the world outside their homes from the
backseat of a car. National surveys show that, on average, children
spend more than an hour a day in a car, not including time in
the school bus. Figure 3 shows a child’s windshield view of his
world. As part of our study, this 10-year-old child, who was
driven everywhere, was asked to draw a map of his neighborhood
6 NCBW Forum Article 3-7-05– March 2005
Working with
two colleagues,
Vijay
Jayachandran
and Marcus
Diederich,
we conducted
focused
interviews
and mapping
exercises with
nine- and
ten-year-olds
having them
draw free-form
maps of their
neighborhood
between home
and school.
Figure 3: A map
drawn by a 10-year-
old child who was
driven everywhere.
The result is a series
of disconnected paths
that lead separately
from home to school,
friends, or the mall,
with little detail or
connection with the
community.
Child from Gregory Garden NeighborhoodChild from Gregory Garden Neighborhood
7. 7 NCBW Forum Article 3-7-05– March 2005
between home and school, as if he were “to describe it to someone.” The result was a
series of disconnected paths that led separately from home to school, friends, or the
mall, with little detail or connection with the community within which he lived.
Another participant of the same study, a child who was also driven everywhere, was
unable to make any connection with his community between home and school and he
resorted to marking a line through the middle of the paper, drawing his school above
and his home below the line.
These examples show how neighborhood design — by placing schools, parks,
and playgrounds away from homes and providing inadequate sidewalks and bike
lanes to access them — can affect children’s sense of place. As parents are forced to
chauffeur their children throughout their childhood, children can become cognitively
disconnected from their community.
Several studies have found that traffic and sprawling communities can impose further
negative impacts on youth livability:
• Heavy traffic reduces the independent mobility of children and youth.5
• Opportunities and locations for spontaneous, non-structured play are severely
restricted by traffic.6
• Chronic traffic noise can stress children and raise their blood pressure, heart rates,
and levels of stress hormones.7
• In neighborhoods where traffic is a nuisance and a threat, children have a
limited range of play activities and spend less time outside. Children who live in
neighborhoods not dominated by traffic have a wider circle of friends, and so do
their parents.8
3:00pm Rush Hour at the School Parking LotAs parents
are forced
to chauffeur
their children
throughout
their childhood,
children
can become
cognitively
disconnected from
their community.
8. 8 NCBW Forum Article 3-7-05– March 2005
The cognitive mapping exercise we conducted in Contra Costa County, California,
is a dramatic illustration of these findings. In order to gauge the effect of traffic, we
chose two residential neighborhoods with elementary schools, Parkmead (heavy-traffic-
exposure) and Gregory Gardens (light-traffic-exposure). The communities were similar
in most respects, except for their exposure to traffic volumes and speed. The light-
traffic-exposure (Light TE) neighborhood, had about half the amount of traffic as the
heavy-traffic-exposure (Heavy TE) neighborhood and the cars traveled at lower speeds
(because of drainage swales that provided informal traffic calming). In addition, the
Light TE neighborhood had good pedestrian facilities in key locations, and the traffic it
did have was not as centrally located. (See Figures 4a and 4b)
Figures 4a and 4b: The light-
traffic-exposure neighborhood,
Gregory Gardens (a), had
about half the amount of traffic
as the heavy-traffic-exposure
neighborhood, Parkmead (b),
and the cars traveled at lower
speeds.
A
B
9. 9 NCBW Forum Article 3-7-05– March 2005
MAPPING EXERCISE
Following the same
protocol for each group,
we provided 9- and 10-
year-olds with blank
pieces of paper and
several plain, black
pencils. We then read
instructions asking them
to “draw a map of their
neighborhood, between
home and school, as if
they were describing it
to someone” (Figure 5).
We also asked them to
identify and comment
on areas that they
liked, disliked, or felt
were dangerous, and
to indicate the location
of their friends’ homes
and places they like
to play. We gave each
group the same amount
of time for each task.
(For more information
on this research,
contact the author at
<bappleyard@msn.com>.)
In order to highlight
the children’s common
themes, we created two
composite maps, using a
legend that would reflect
the elements drawn on
the maps (Figure 6).
The legend designates
cool colors for positive
elements (green for
homes of friends and
acquaintances, blue for
places they like to play), and warm colors for negative elements (red circles for danger,
orange circles for dislike, and red squares for automobiles). The more children who
drew a particular element, such as a road, the thicker the line on the composite map.9
Figure 5 (above): WeWeW
provided 9- and 10-
year-olds with paper
and pencils and asked
them to “draw a map
of their neighborhood,
between home and
school.”
Figure 6 (left):
We created twoWe created twoW
composite maps, using
a legend that reflected
the elements drawn on
the maps.
10. As was the case in the Heavy TE neighborhood, cognitive mapping exercises like
this (Figure 7) provide a way for children to express their views of the world. Such
exercises are invaluable for identifying and assessing the problems and opportunities
experienced by children along the routes to school (e.g., important destinations, secret
paths, preferred travel routes, and existing barriers). In turn, they can prove invaluable
to helping community members, public staff and policymakers identify and articulate
the most cost-effective solutions to making neighborhoods and school area streets more
livable for the children.
This graphic comparison of the children’s collective cognitive experience makes it easy
to see the inverse correlation between their exposure to traffic and the quality of their
neighborhood experience.
In the Heavy TE neighborhood, the children frequently expressed feelings of dislike
and danger and were unable to represent any detail of the surrounding environment.
Newell Avenue, the main road in front of the school, is a tree-lined street and yet few
of the trees were drawn; instead, red (danger, cars) and orange (dislike) dominated.
Participants from the Light TE neighborhood, on the other hand, showed a much richer
sense of their environment, drawing more of the streets, houses, trees, and other objects,
and including fewer signs of danger, or dislike and fewer cars. The children also drew
many more places in the street where they liked to play and areas that they just simply
liked: they noted playing in 43 percent more locations in their streets relative to the
children in the heavy-traffic-exposure neighborhood.
In sum, as exposure to auto traffic volumes and speed decreases, a child’s sense of
threat goes down, and his/her ability to establish a richer connection and appreciation
for the community rises. A child from the light-traffic-exposure neighborhood offered
the testimonial on the following page (Figure 8).
10 NCBW Forum Article 3-7-05– March 2005
Figure 7: Cognitive mapping exercises like this help identify and assess problems and opportuni-
ties that children experience along the routes to school.
11. CREATING SAFE ROUTES TO SCHOOL
While the cognitive
mapping study helped
identify, prioritize, and
gather support and funding
for needed improvements,
it also presented an
opportunity to see whether
making the street safer
for children could change
their perception of their
neighborhood. Within a
year after the initial study,
two walkways and a new
stop sign were installed
along the busiest corridors
leading to the school in
the heavy-traffic-exposure
neighborhood (Figure 9).
Waiting almost a year for
the benefits to be realized,
I conducted a follow-up
study to examine how
these facilities affected the
livability and the quality
of life of this community’s
schoolchildren.
11 NCBW Forum Article 3-7-05– March 2005
Figure 8: A child from the light-traffic-exposure neighborhood offered this testimonial.
Figure 9: Within a year after the initial study, two walkways
and a new stop sign were installed along the busiest corridors
leading to the heavy-traffic-exposure neighborhood’s school.
12. Before the improvements
Before the improvements were made in the heavy-traffic-exposure neighborhood,
many children drew expressions of dislike and danger associated with automobiles
and were unable to represent any detail of the surrounding environment —possibly
feeling overwhelmed by the threats posed by the automobiles. After the improvements
alleviated the exposure to these threats, there were indeed fewer expressions of danger
and dislike, indicating a greater sense of comfort and well-being. Furthermore the
students expressed a much richer recall of the characteristics of neighborhood around
the busy street. (See Figures 10a and 10b.)
The pattern is also clear
from the maps made by
individual children who
participated in both the before
and after studies. In Figures
11(a) and (b) on the following
page, a child showed a very
high association with the
threat of traffic before the
improvements. (See the note
in the lower right, “the cars
never stop and there is too much
trafick.”)
Furthermore, the busy,
dangerous street between
home and school is relegated
to the bottom right corner of
the map. Contrast this with
the image drawn by the same
child after the improvements.
(To orient, note that in the
second map the “n” shaped
loop of the child’s home
street is much smaller and
farther to the left). First, the
heavy traffic/high speed
street is now much more
significant portion of the
child’s neighborhood image,
as is the school. Furthermore,
one of the most significant
elements that stands out
is the new pathway that is
clearly represented across
the lower portion of the map,
highlighted by the green
12 NCBW Forum Article 3-7-05– March 2005
Figures 10a and 10b: Before improvements (a), there were
many expressions of danger and dislike. After improve-
ments (b), there were fewer such expressions, indicating a
greater sense of comfort and well-being.
A
B
13. rectangle. While much of this child’s
heightened cognitive sense of the
neighborhood can be explained by the
maturity and experience developed in
the period between the studies, the clear
identification of the pathway marks its
role as a major contributor to enriching
the quality of this child’s neighborhood
experience.
Another child also expressed
a positive overall image of his
neighborhood after the improvement
and again distinctly identified the new
pathway (green rectangle) and stop sign
(green hexagon) on the map (Figure 12).
While both children recognized that
this street still presents a danger (“very
bisey” and “not like because of all the
cars”), their ability to manage and
overcome the threat and domination
of cars on these neighborhood street
emerges due to the improvements to the
pedestrian and biking environment.
Figures 11(a) and 11(b): In (a), the child showed a high association with the threat of traffic
before improvements (e.g., see the note in the lower right, “the cars never stop and there is too
much trafick.”). Note that the child’s map is oriented with south at the top.
Figure 12 (below): Another child distinctly
represents the new pathway (green rectangle)
and stop sign (green hexagon).
13 NCBW Forum Article 3-7-05– March 2005
A B
14. A comparison of the collective image maps of the children from the before group
and the after group reveals how improvements to the pedestrian and bicycling
environments help children develop a richer sense of their neighborhood, as well as
lessen the sense of threat posed by automobiles.
These findings are especially important in light of the Safe Routes to School
movement, which is bringing new resources into communities to improve the walking
and bicycling environment for children. California and Texas have instituted statewide
programs, and Congress has tentatively included a new Safe Routes to School program
in the new federal transportation bill.
A before-and-after study of improvements made under the Safe Routes to school
program in California found strong evidence of immediate success in five of nine
schools studied. The study found more children walked to school, while automobile
speeds were lower and more drivers yielded to pedestrians. The study found that
projects that closed sidewalk gaps were especially successful.10
While the study did
not measure children’s sense of well-being, it seems reasonable to assume that this
improved as well.
CONCLUSION
This research seeks to address the question, “How does
auto-dependency, and auto-domination of our streets and
neighborhoods, affect the way a child views his or her
world?” The maps compiled in this research show that
as exposure to auto traffic volumes and speed decreases,
a child’s sense of threat goes down, and his/her ability
to establish a richer connection and appreciation for the
community rises.
Without pedestrian and bicycle facilities to provide
sanctuary for a child from automobile traffic, the negative
senses of danger and dislike mean children cannot appreciate
or possibly even identify the qualities of their neighborhood
that are memorable, positive, or special. Additionally,
exposure to threats posed by automobiles limits a child’s
positive association with his or her neighborhood, including
the area around the neighborhood school. Building complete
and livable streets that are safe for travel via foot, bicycle,
and yes, automobiles, is especially important if we want our
children to establish a healthy sense of comfort, well being,
and connection within their own community.
Supporting “youth livability” by achieving “street livability”
objectives also helps engage children and adults in their
street and community, ultimately making streets and public
places safer for everyone. In closing, while new walking
and bicycling facilities can improve a child’s physical health
and safety, they also can allow children to explore, connect,
socialize, and to be...kids!
14 NCBW Forum Article 3-7-05– March 2005
As exposure
to auto traffic
volumes and speed
decreases, a child’s
sense of threat
goes down, and
his/her ability to
establish a richer
connection and
appreciation for
the community
rises.
15. ENDNOTES
1 Surface Transportation Policy Project, High Mileage Moms, May 1999.
2 Pedestrian injury is the 3rd leading cause of preventable death among children.
3 Surface Transportation Policy Project, Mean Streets 2000, June 2000.
4 Centers for Disease Control and Prevention, National Center for Health Statistics, National Health
and Nutrition Examination Survey. Ogden et. al. JAMA. 2002;288:1728-1732.
5 Tranter, P., Doyle, J. (1996). Reclaiming the Residential Street as Play Space. International Play Journal,
4, pp.81-97.
6 Hillman, M., Adams, J., (1992) Children’s freedom and safety, Children’s Environments, 9 (2), pp. 10-22.
7 Evans, G., Lercher, P., Meis, M., et al (2001) Community noise exposure and stress in children, Journal
of the Acoustical Society of America, 109 (3), pp.1023-1027.
8 See Page 18 of European Commission, Directorate-General for the Environment (2002), Kids on the
Move, Office for Official Publications of the European Communities, Luxembourg.
9 This process is very effective at analyzing the ability of children as a group to identify physical
features as well as measuring their ability to associate between activities and physical space in their
neighborhood. It also functions to represent the relationship between their feelings and preferences
and physical space.
10 CalTrans Safe Routes to School report to the legislature, December 2003.
BIBLIOGRAPHY
Appleyard, B., (1997), Retrofitting Auto-Suburbia: A Community Guide to Overcoming Auto-Domination,
University of California at Berkeley, Master’s Degree Professional Report.
Appleyard, D., (1981), Livable Streets, University of California Press. Berkeley.
Lynch, K., (1980), The Image of the City, MIT Press. Cambridge, MA
NCBW FORUM is an online publication of the National Center for Bicycling & Walking.
EDITOR: John Williams <john@montana.com>
To learn more, visit the ncbw forum site at www.ncbwforum.infop.cc
Or visit our main website at www.bikewalk.org.
15 NCBW Forum Article 3-7-05– March 2005
ABOUT THE AUTHOR
Through his consulting practice, Appleyard Associates, Mr. Appleyard specializes in effective transpor-
tation, land-use and urban design strategies for vibrant, livable and sustainable community evolution.
From neighborhood projects to national policies, Mr. Appleyard’s experience as a Neighborhood Planner,
Smart Growth Expert, Planning Commissioner, etc., provide him with deep insight and expertise into
a myriad of planning issues at the street, neighborhood and regional levels. Translating his experiences
into the classroom, he has taught the graduate transportation and land use planning courses at Port-
land State University and the University of Virginia, as well as workshops for the National Center for
Bicycling and Walking and The University of California.
CONTACT INFO:
Bruce Appleyard can be reached at bappleyard@msn.com, bruce@appleyardgroup.com,
www.smartgrowthplanning.com,or at 503-810-7249.