
Recommended
More Related Content
What's hot
What's hot (17)
Viewers also liked
Similar to Income Statement and Financial Analysis 2008-2015
Similar to Income Statement and Financial Analysis 2008-2015 (20)
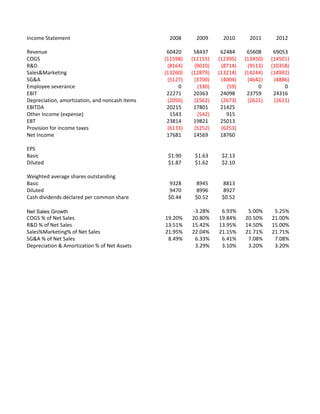
Income Statement and Financial Analysis 2008-2015
- 1. Income Statement 2008 2009 2010 2011 2012 Revenue 60420 58437 62484 65608 69053 COGS (11598) (12155) (12395) (13450) (14501) R&D (8164) (9010) (8714) (9513) (10358) Sales&Marketing (13260) (12879) (13214) (14244) (14992) SG&A (5127) (3700) (4004) (4642) (4886) Employee severance 0 (330) (59) 0 0 EBIT 22271 20363 24098 23759 24316 Depreciation, amortization, and noncash items (2056) (2562) (2673) (2621) (2621) EBITDA 20215 17801 21425 Other Income (expense) 1543 (542) 915 EBT 23814 19821 25013 Provision for income taxes (6133) (5252) (6253) Net Income 17681 14569 18760 EPS Basic $1.90 $1.63 $2.13 Diluted $1.87 $1.62 $2.10 Weighted average shares outstanding Basic 9328 8945 8813 Diluted 9470 8996 8927 Cash dividends declared per common share $0.44 $0.52 $0.52 Net Sales Growth -3.28% 6.93% 5.00% 5.25% COGS % of Net Sales 19.20% 20.80% 19.84% 20.50% 21.00% R&D % of Net Sales 13.51% 15.42% 13.95% 14.50% 15.00% Sales%Marketing% of Net Sales 21.95% 22.04% 21.15% 21.71% 21.71% SG&A % of Net Sales 8.49% 6.33% 6.41% 7.08% 7.08% Depreciation & Amortization % of Net Assets 3.29% 3.10% 3.20% 3.20%
- 2. 2013 2014 2015 72851 77039 81662 (15663) (16949) (18374) (11292) (12326) (13474) (15817) (16726) (17730) (5154) (5451) (5778) 0 0 0 24925 25588 26306 (2621) (2621) (2621) 5.50% 5.75% 6.00% 21.50% 22.00% 22.50% 15.50% 16.00% 16.50% 21.71% 21.71% 21.71% 7.08% 7.08% 7.08% 3.20% 3.20% 3.20%
- 3. Balance Sheet 2009 Assets Cash 6076 Short-term investments 25371 Accounts receivable 11192 Inventories 717 Deferred income taxes 2213 Other 3711 Total Current Assets 49280 Property and equipment net of accumulated depreciation of 7547 and 8629 7535 Equity and other investments 4933 Goodwill 12503 Intangible assets, net 1759 Deferred income taxes 279 Other long-term assets 1599 Total Assets 77888 Liabilities and stockholders' equity Accounts payable 3324 Short-term debt 2000 Accrued compensation 3156 Income Taxes 725 Short-term unearned revenue 13003 Securities lending payable 1684 Other 3142 Total current liabilities 27034 Long-term debt 3746 Long-term unearned revenue 1281 Deferred income taxes 0 Other long-term liabilities 6269 Commitments and contingencies Stockholders' Equity Common stock and paid-in capital-shares authorized 24,000; outstanding 8,668 and 8,908 62382 Retained deficit, including accumulated other comprehensive income of $1,055 and $969 (22824) Total stockholders' equity 39558 Total liabilities and stockholders' equity 77888 Net Working Capital 22246 PPE % of Sales 12.89% NWC % of Sales 38.07%
- 4. 2010 2011 2012 2013 2014 2015 5505 31283 13014 740 2184 2950 55676 7630 8236 8668 9145 9671 10251 7754 12394 1158 0 1501 86113 82001 82001 82001 82001 82001 4025 1000 3283 1074 13652 182 2931 26147 4939 1178 229 7445 62856 (16681) 46175 86113 29529 27991 29460 31081 32868 34840 12.21% 12.55% 12.55% 12.55% 12.55% 12.55% 47.26% 42.66% 42.66% 42.66% 42.66% 42.66%
- 5. Debt 39938 Dividends $0.52 Equity 46175 P 28 Value 86113 g 9.20% 10.80% Tax Rate 35% Re 11.06% 9.80% AAA 4.97% 7% Baa 6.06% Rd 6.06% WACC 7.76%
- 6. 2011 2012 2013 EBIT 23759 24316 24925 Less Taxes@ 35% (8316) (8511) (8724) Tax-Effected EBIT 15444 15805 16201 Plus Depreciation 2621 2621 2621 Less Capital Expenditures (8236) (8668) (9145) Less Change in Net Working Capital 1538 (1470) (1620) Unlevered free cash flow 11368 8289 8058 PV of Unlevered Cash Flow @ 7.76% 35071 TV 196632 Value 231704 Debt 39938 Equity Value 191766 Shares 8813 Price Per Share 22
- 7. 2014 2015 25588 26306 (8956) (9207) 16632 17099 2621 2621 (9671) (10251) (1787) (1972) 7796 7498