U.S. Industrial Market Registers Further Gains in Q3
•
1 like•326 views

The US industrial market absorbed 3.6 million square feet of space in Q3 2010, in addition to 13.3 million square feet absorbed in Q2 2010. Vacancy rates remained largely unchanged at 11.01% in Q3. While fundamentals have improved, average asking rents fell slightly by 0.8% to $4.74 per square foot. Looking ahead, modest economic growth is expected to result in tepid demand for warehouse space, though continued import growth and expansion in manufacturing should provide support. With little new construction, any increase in demand will quickly tighten vacancy rates.

Recommended
More Related Content
Similar to U.S. Industrial Market Registers Further Gains in Q3
Similar to U.S. Industrial Market Registers Further Gains in Q3 (20)
More from Coy Davidson
More from Coy Davidson (20)
Recently uploaded
Recently uploaded (20)
U.S. Industrial Market Registers Further Gains in Q3
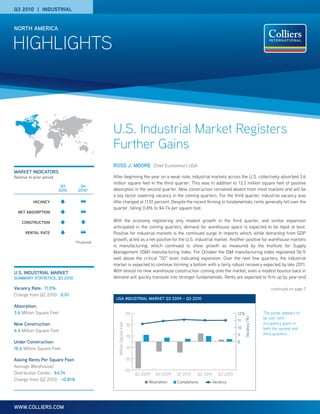
- 1. HIGHLIGHTS NORTH AMERICA www.colliers.com Q3 2010 | INDUSTRIAL Ross J. Moore Chief Economist | USA After beginning the year on a weak note, industrial markets across the U.S. collectively absorbed 3.6 million square feet in the third quarter. This was in addition to 13.3 million square feet of positive absorption in the second quarter. New construction remained absent from most markets and will be a key factor lowering vacancy in the coming quarters. For the third quarter, industrial vacancy was little changed at 11.01 percent. Despite the recent firming in fundamentals, rents generally fell over the quarter, falling 0.8% to $4.74 per square foot. With the economy registering only modest growth in the third quarter, and similar expansion anticipated in the coming quarters, demand for warehouse space is expected to be tepid at best. Positive for industrial markets is the continued surge in imports which, while detracting from GDP growth, acted as a net positive for the U.S. industrial market. Another positive for warehouse markets is manufacturing, which continued to show growth as measured by the Institute for Supply Management (ISM) manufacturing index. For October the ISM manufacturing index registered 56.9, well above the critical “50” level, indicating expansion. Over the next few quarters, the industrial market is expected to continue forming a bottom with a fairly robust recovery expected by late 2011. With almost no new warehouse construction coming onto the market, even a modest bounce back in demand will quickly translate into stronger fundamentals. Rents are expected to firm up by year-end The purge appears to be over with occupancy gains in both the second and third quarters. market indicators Relative to prior period u.s. industrial market Summary Statistics, Q3 2010 U.S. Industrial Market Registers Further Gains Q3 2010 Q4 2010* VACANCY NET ABSORPTION construction rental rate *Projected USA INDUSTRIAL MARKET Q3 2009 – Q3 2010 Absorption Completions Vacancy -50 -30 -10 10 30 50 -50 -30 -10 10 30 50 Q3 2010Q2 2010Q1 2010Q4 2009Q3 2009 8 9 10 11 12% MillionSquareFeet Vacancy(%) Vacancy Rate: 11.0% Change from Q2 2010: 0.01 Absorption: 3.6 Million Square Feet New Construction: 4.4 Million Square Feet Under Construction: 18.6 Million Square Feet Asking Rents Per Square Foot: Average Warehouse/ Distribution Center: $4.74 Change from Q2 2010: –0.81% continued on page 7
- 2. p. 2 | Colliers International highlights | Q3 2010 | industrial | north America UNITED STATES | INDUSTRIAL SURVEY MARKET EXISTING INVENTORY (SF) SEP. 30, 2010 NEW CONSTRUCTION Q3 2010 (SF) NEW CONSTRUCTION ytd 2010 (SF) CURRENTLY UNDER CONSTRUCTION (SF) Atlanta, GA 587,585,000 999,000 2,900,000 1,582,000 Bakersfield, CA 31,489,000 90,000 530,000 487,000 Baltimore, MD 223,231,000 35,000 190,000 250,000 Boise, ID 31,757,000 25,000 106,000 0 Boston, MA 153,077,000 0 0 170,000 Charleston, SC 30,874,000 35,000 1,430,000 265,000 Charlotte, NC 280,376,000 125,000 146,000 93,000 Chicago, IL 1,312,639,000 281,000 2,084,000 2,949,000 Cincinnati, OH 254,875,000 28,000 28,000 301,000 Cleveland, OH 414,522,000 0 26,000 27,000 Columbia, SC 35,676,000 0 0 0 Columbus, OH 205,958,000 0 47,000 170,000 Dallas/Ft. Worth, TX 746,770,000 0 0 559,000 Denver, CO 276,740,000 153,000 944,000 153,000 Detroit, MI 469,785,000 0 61,000 240,000 Fairfield, CA 38,556,000 0 363,000 0 Fresno, CA 48,600,000 0 0 0 Ft. Lauderdale-Broward County, FL 126,756,000 0 69,000 62,000 Greenville/Spartanburg, SC 169,200,000 77,000 109,000 77,000 Hartford, CT 96,975,000 0 0 0 Honolulu, HI 38,442,000 0 0 0 Houston, TX 490,903,000 235,000 2,018,000 239,000 Jacksonville, FL 118,073,000 240,000 240,000 483,000 Kansas City, KS 248,273,000 9,000 16,000 50,000 Las Vegas, NV 107,492,000 311,000 341,000 72,000 Little Rock, AR 45,215,000 0 253,000 497,000 Los Angeles – Inland Empire, CA 378,431,000 0 0 2,967,000 Los Angeles, CA 879,373,000 13,000 110,000 825,000 Louisville, KY 160,308,000 0 51,000 0 Memphis, TN 192,282,000 0 400,000 795,000 Miami, FL 227,480,000 0 170,000 0 Nashville, TN 158,329,000 0 717,000 220,000 New Jersey – Central 356,961,000 81,000 699,000 238,000 New Jersey – Northern 373,801,000 0 0 12,000 Oakland, CA 131,233,000 0 0 26,000 Orange County, CA 200,433,000 0 0 497,000 Orlando, FL 144,217,000 0 0 0 Philadelphia, PA 422,747,000 166,000 880,000 1,148,000 Phoenix, AZ 245,140,000 105,000 1,372,000 445,000 Pleasanton/Walnut Creek, CA 32,225,000 0 74,000 0 Portland, OR 191,917,000 60,000 580,000 60,000 Raleigh, NC 98,223,000 18,000 84,000 120,000 Reno, NV 73,599,000 0 0 0 Sacramento, CA 184,657,000 22,000 53,000 22,000 San Diego, CA 188,440,000 135,000 281,000 230,000 San Francisco Peninsula, CA 40,808,000 0 0 0 San Jose/Silicon Valley, CA 253,311,000 0 0 609,000 Savannah, GA 42,973,000 320,000 320,000 320,000 Seattle/Puget Sound, WA 269,545,000 494,000 919,000 305,000 St. Louis, MO 261,091,000 0 90,000 74,000 Stockton/San Joaquin County, CA 92,563,000 16,000 16,000 0 Tampa, FL 214,365,000 0 20,000 0 Washington, DC 206,738,000 300,000 225,000 952,000 West Palm Beach, FL 58,310,000 0 0 34,000 U.S. TOTAL 12,663,338,000 4,374,000 18,962,000 18,624,000
- 3. highlights | Q3 2010 | industrial | north America Colliers International | p. 3 UNITED STATES | INDUSTRIAL SURVEY MARKET ABSORPTION Q3 2010 (SF) ABSORPTION YTD 2010 (SF) VACANCY RATE JUNE 30, 2010 (%) VACANCY RATE SEP. 30, 2010 (%) Atlanta, GA 182,000 (232,000) 14.1 14.2 Bakersfield, CA 339,000 79,000 10.3 9.5 Baltimore, MD 459,000 1,398,000 11.2 11.0 Boise, ID (61,000) 364,000 10.9 11.1 Boston, MA 718,000 303,000 22.0 21.5 Charleston, SC 200,000 1,105,000 13.6 13.3 Charlotte, NC (1,031,000) (2,655,000) 13.4 13.8 Chicago, IL (2,746,000) (4,512,000) 11.9 12.0 Cincinnati, OH 499,000 677,000 8.8 8.6 Cleveland, OH 238,000 (2,991,000) 9.8 9.8 Columbia, SC 155,000 460,000 12.7 12.3 Columbus, OH 314,000 (1,382,000) 13.4 13.2 Dallas/Ft. Worth, TX (1,427,000) (547,000) 11.6 11.8 Denver, CO 493,000 2,827,000 8.1 8.0 Detroit, MI (330,000) (210,000) 14.4 14.8 Fairfield, CA (680,000) (405,000) 13.4 15.2 Fresno, CA 0 115,000 8.1 8.1 Ft. Lauderdale-Broward County, FL 217,000 780,000 9.7 9.5 Greenville/Spartanburg, SC 346,000 385,000 10.8 11.0 Hartford, CT 0 0 9.3 9.3 Honolulu, HI (89,000) 113,000 4.1 4.4 Houston, TX 573,000 2,501,000 6.6 6.6 Jacksonville, FL (121,000) (387,000) 10.7 11.6 Kansas City, KS 146,000 (1,794,000) 7.6 7.6 Las Vegas, NV 125,000 (1,120,000) 16.6 16.8 Little Rock, AR 11,000 99,000 16.2 16.7 Los Angeles – Inland Empire, CA 1,854,000 6,206,000 12.7 12.3 Los Angeles, CA (351,000) (6,387,000) 5.3 5.3 Louisville, KY (558,000) 2,091,000 12.5 12.9 Memphis, TN 513,000 830,000 13.9 13.6 Miami, FL 779,000 2,094,000 9.7 9.4 Nashville, TN (1,231,000) (1,449,000) 11.3 12.1 New Jersey – Central (2,057,000) (140,000) 10.8 11.3 New Jersey – Northern 901,000 1,158,000 8.0 7.8 Oakland, CA (51,000) (1,192,000) 9.4 9.5 Orange County, CA 47,000 (692,000) 5.9 5.9 Orlando, FL 144,000 505,000 12.9 12.8 Philadelphia, PA 489,000 1,327,000 9.9 9.9 Phoenix, AZ 2,139,000 3,197,000 18.5 17.6 Pleasanton/Walnut Creek, CA 240,000 1,134,000 13.1 12.5 Portland, OR 560,000 368,000 8.5 8.5 Raleigh, NC 154,000 (74,000) 13.2 13.0 Reno, NV 151,000 141,000 15.3 15.1 Sacramento, CA (302,000) (1,007,000) 12.4 12.6 San Diego, CA 862,000 779,000 11.7 11.6 San Francisco Peninsula, CA (456,000) (346,000) 9.5 10.6 San Jose/Silicon Valley, CA (1,034,000) (4,568,000) 13.8 13.8 Savannah, GA 0 (1,355,000) 21.6 21.4 Seattle/Puget Sound, WA 260,000 (635,000) 8.3 8.2 St. Louis, MO 990,000 1,612,000 8.8 8.4 Stockton/San Joaquin County, CA (280,000) (758,000) 17.2 17.5 Tampa, FL 541,000 (376,000) 11.4 11.2 Washington, DC 666,000 884,000 13.0 12.7 West Palm Beach, FL 126,000 464,000 11.2 11.0 U.S. TOTAL/AVERAGE 3,626,000 (1,218,000) 11.01 11.02
- 4. p. 4 | Colliers International highlights | Q3 2010 | industrial | north America UNITED STATES | INDUSTRIAL SURVEY | SALES PRICES AND CAP RATES AS OF SEPTEMBER 2010 MARKET SALES PRICE (USD PSF) CAP RATE (%) VACANCY FORECAST (3 MONTHS) ABSORPTION FORECAST (3 MONTHS) RENT FORECAST (3 MONTHS) Atlanta, GA 35.15 9.23 Up Same Down Bakersfield, CA 48.00 9.50 Same Same Same Boise, ID 45.00 – Same Same Same Boston, MA 40.00 – Down Up Same Charleston, SC 45.50 8.50 Down Up Same Chicago, IL 42.00 7.25 Down Up Same Cincinnati, OH – – Down Up Down Columbia, SC – – Down Up Same Columbus, OH 33.00 8.50 Same Same Same Dallas/Ft. Worth, TX 40.00 8.50 Up Up Same Denver, CO 57.00 8.80 Down Up Same Detroit, MI 31.00 8.00 Up Down Down Fairfield, CA – – Up Down Same Fresno, CA 38.00 9.00 Same Same Same Ft. Lauderdale-Broward County, FL 59.00 9.00 Same Same Same Greenville/Spartanburg, SC 29.95 10.00 Up Down Down Hartford, CT 40.00 8.50 Same Same Same Honolulu, HI – – Same Same Same Houston, TX 60.42 8.50 Down Same Same Jacksonville, FL 45.00 8.75 Up Down Down Las Vegas, NV – – Up Down Down Little Rock, AR 28.00 9.25 Same Same Same Los Angeles – Inland Empire, CA 53.00 9.00 Down Up Same Los Angeles, CA 89.00 8.00 Same Same Down Memphis, TN 25.00 9.50 Down Up Same Miami, FL 76.00 – Same Same Same Nashville, TN 28.21 9.25 Same Same Down New Jersey – Central 56.50 – Same Up Same New Jersey – Northern 57.97 5.68 Down Up Same Oakland, CA 86.97 7.00 Same Up Same Orange County, CA 18.00 7.00 Same Same Down Orlando, FL 42.74 8.50 Same Up Down Philadelphia, PA 45.00 9.50 Down Up Same Phoenix, AZ 76.00 9.50 Down Same Down Pleasanton/Walnut Creek, CA – – Same Same Same Portland, OR 58.93 – Down Up Same Reno, NV – – Same Same Same Sacramento, CA 50.00 8.25 Down Up Same San Diego, CA 99.89 – Down Down Same San Francisco Peninsula, CA 188.00 7.00 Down Same Same San Jose/Silicon Valley, CA – – Same Same Same Savannah, GA 40.00 8.50 Down Up Same Seattle/Puget Sound, WA – – Same Same Same Stockton/San Joaquin County, CA 50.00 8.50 Up Down Same Tampa, FL 32.41 7.50 Up Down Down Washington, DC – – Same Same Down West Palm Beach, FL 80.00 – Same Same Same U.S. AVERAGE 53.26 8.47
- 5. highlights | Q3 2010 | industrial | north America Colliers International | p. 5 UNITED STATES | INDUSTRIAL SURVEY | RENTS AS OF SEPTEMBER 2010 MARKET WAREHOUSE/DISTRIBUTION SPACE (USD PSF) BULK SPACE (USD PSF) FLEX/SERVICE SPACE (USD PSF) TECH/R&D SPACE (USD PSF) Atlanta, GA 3.09 2.88 7.22 7.49 Bakersfield, CA 4.00 3.92 7.00 – Baltimore, MD 4.67 – 9.95 – Boise, ID 4.50 4.50 6.30 6.30 Boston, MA 4.50 4.95 8.50 9.50 Charleston, SC 3.65 3.90 6.00 16.25 Charlotte, NC 3.39 – 8.51 – Chicago, IL 3.79 2.54 8.34 – Cincinnati, OH 3.10 3.10 6.21 – Cleveland, OH 3.45 – 8.23 – Columbia, SC 3.75 3.75 6.00 9.50 Columbus, OH 2.54 3.63 4.88 4.88 Dallas/Ft. Worth, TX 3.00 2.70 6.80 8.40 Denver, CO 3.50 3.25 8.50 9.50 Detroit, MI 3.99 3.60 8.20 – Fairfield, CA 5.52 – 10.32 – Fresno, CA 2.40 2.28 4.00 5.50 Ft. Lauderdale-Broward County, FL 7.10 6.41 9.45 – Greenville/Spartanburg, SC 2.70 2.91 6.99 17.00 Hartford, CT 5.50 4.28 7.95 7.95 Honolulu, HI 10.97 – – – Houston, TX 4.76 4.23 7.96 10.02 Jacksonville, FL 3.50 3.00 9.00 – Kansas City, KS 3.96 – 8.11 – Las Vegas, NV 4.90 4.71 6.73 9.99 Little Rock, AR 3.57 1.79 – – Los Angeles – Inland Empire, CA 3.59 3.47 6.50 10.00 Los Angeles, CA 5.64 5.33 11.25 13.25 Louisville, KY 3.40 – 7.34 – Memphis, TN 2.57 2.47 7.19 10.00 Miami, FL 7.49 6.66 11.13 – Nashville, TN 4.05 3.16 7.34 – New Jersey – Central 4.69 4.24 11.82 12.66 New Jersey – Northern 6.04 5.86 11.22 6.04 Oakland, CA 4.44 4.44 5.76 8.28 Orange County, CA 6.90 5.65 12.85 13.50 Orlando, FL 4.59 4.13 8.69 8.99 Philadelphia, PA 4.00 3.75 7.00 11.00 Phoenix, AZ 5.07 4.66 11.00 10.88 Pleasanton/Walnut Creek, CA 4.32 4.20 9.00 – Portland, OR 4.56 4.32 8.52 9.36 Raleigh, NC 4.06 – 8.85 – Reno, NV 3.60 3.45 6.24 9.60 Sacramento, CA 4.80 3.36 8.40 9.84 San Diego, CA 7.80 7.08 11.04 14.88 San Francisco Peninsula, CA 9.48 9.48 19.44 19.44 San Jose/Silicon Valley, CA 5.41 5.19 8.19 12.35 Savannah, GA 3.95 3.75 7.00 10.00 Seattle/Puget Sound, WA 7.68 – 6.72 7.68 St. Louis, MO 3.95 – 9.91 – Stockton/San Joaquin County, CA 3.96 3.60 7.44 7.44 Tampa, FL 4.39 4.10 8.30 9.45 Washington, DC 7.68 – 12.00 – West Palm Beach, FL 8.12 6.21 10.59 – U.S. AVERAGE 4.74 4.21 8.50 10.21 Quarterly Change -0.81% -0.31% -2.10% 1.59%
- 6. p. 6 | Colliers International highlights | Q3 2010 | industrial | north America CANADA | INDUSTRIAL SURVEY MARKET EXISTING INVENTORY (SF) SEP. 30, 2010 NEW CONSTRUCTION Q3 2010 (SF) NEW CONSTRUCTION ytd 2010 (SF) CURRENTLY UNDER CONSTRUCTION (SF) Calgary, AB 121,848,000 0 682,000 104,000 Edmonton, AB 76,842,000 24,000 500,000 232,000 Halifax, NS 7,078,000 0 17,000 90,000 Montreal, QC 347,771,000 0 180,000 0 Ottawa, ON 28,027,000 75,000 176,000 75,000 Regina, SK 16,175,000 0 520,000 539,000 Saskatoon, SK 19,600,000 268,000 100,000 220,000 Toronto, ON 760,172,000 941,000 1,391,000 2,112,000 Vancouver, BC 178,202,000 769,000 1,670,000 1,117,000 Victoria, BC 8,605,000 0 301,000 0 Waterloo Region, ON 61,253,000 42,000 223,000 57,000 CANADA TOTAL 1,625,573,000 2,119,000 5,759,000 4,545,000 CANADA | INDUSTRIAL SURVEY MARKET ABSORPTION Q3 2010 (SF) ABSORPTION YTD 2010 (SF) VACANCY RATE JUNE 30, 2010 (%) VACANCY RATE SEP. 30, 2010 (%) Calgary, AB 1,310,000 2,965,000 5.2 4.7 Edmonton, AB 457,000 1,289,000 4.9 4.3 Halifax, NS 65,000 194,000 6.3 5.4 Montreal, QC 796,000 1,028,000 6.6 6.4 Ottawa, ON (293,000) 8,000 5.3 6.3 Regina, SK 755,000 1,197,000 2.4 1.7 Saskatoon, SK 288,000 452,000 3.1 2.6 Toronto, ON 3,327,000 4,017,000 6.1 5.8 Vancouver, BC 1,548,000 3,936,000 4.5 4.1 Victoria, BC 96,000 96,000 1.5 3.7 Waterloo Region, ON (851,000) (848,000) 7.3 9.1 CANADA TOTAL/AVERAGE 7,499,000 14,332,000 5.87 5.63 CANADA | INDUSTRIAL SURVEY | SALES PRICES AND CAP RATES AS OF SEPTEMBER 2010 MARKET SALES PRICE (CAD PSF) CAP RATE (%) VACANCY FORECAST (3 MONTHS) ABSORPTION FORECAST (3 MONTHS) RENT FORECAST (3 MONTHS) Calgary, AB 120.00 7.25 Down Up Up Edmonton, AB – – Same Same Same Halifax, NS 86.00 8.00 Down Up Up Montreal, QC 85.00 8.25 Same Same Same Ottawa, ON 82.50 8.13 Same Same Same Regina, SK 73.00 7.80 Same Same Same Saskatoon, SK 110.00 7.75 Same Same Same Toronto, ON 57.17 8.20 Down Up Up Vancouver, BC 110.00 6.50 Same Same Down Victoria, BC 200.00 6.50 Same Same Same Waterloo Region, ON 65.00 7.50 Down Up Same CANADA AVERAGE 98.87 7.59 CANADA | INDUSTRIAL SURVEY | RENTS AS OF SEPTEMBER 2010 MARKET WAREHOUSE/DISTRIBUTION SPACE (CAD PSF) BULK SPACE (CAD PSF) FLEX/SERVICE SPACE (CAD PSF) TECH/R&D SPACE (CAD PSF) Calgary, AB 7.00 6.50 9.00 9.75 Edmonton, AB 6.90 6.15 8.25 8.50 Halifax, NS 7.00 5.50 8.95 13.95 Montreal, QC 4.00 4.00 6.50 8.50 Ottawa, ON 7.00 6.00 8.00 10.75 Regina, SK 8.50 6.50 12.00 14.00 Saskatoon, SK 9.00 8.00 11.00 13.00 Toronto, ON 5.03 4.61 7.23 7.83 Vancouver, BC 6.50 5.75 8.50 9.25 Victoria, BC 12.00 10.00 13.00 13.00 Waterloo Region, ON 4.27 4.27 8.03 8.03 CANADA AVERAGE 7.02 6.12 9.13 10.60 Quarterly Change -0.45% -0.87% -0.25% -0.83%
- 7. highlights | Q3 2010 | industrial | north America Colliers International | p. 7 and then remain flat, with the exception of a few select markets where there is a mismatch between demand and what is available for lease. Occupancies rise for second consecutive quarter. For the second consecutive three month period, industrial markets registered a modest increase in occupied space. For the third quarter, net absorption totaled 3.6 million square feet (MSF). This came on the heels of a surprise return to occupancy gains in the second quarter when absorption registered 14.5 MSF. Indeed, in the second quarter the U.S. industrial market posted the first increase in occupied space since early 2008. This was in sharp contrast to the 47.3 MSF of industrial space that was returned to the market a year ago. By the end of the third quarter, year- to-date absorption totaled –1.2 MSF compared with –144.3 MSF for the same period in 2009. Of the 54 markets tracked in the U.S., 40 reported positive absorption during the third quarter, however, three (New Jersey, Chicago and Dallas) of the big five reported sharply negative numbers pulling the national number down. In Canada nine of the eleven markets monitored registered an increase in occupied space. Warehouse construction resumes downward trend. Third quarter completions totaled 4.4 MSF, a modest decrease from the second quarter when 9.8 MSF was delivered to the market and noticeably less than the 11.9 MSF completed in Q3 2009. Of the 4.4 MSF delivered, 77 percent was build-to-suit and 23 percent speculative construction. In the coming quarters construction is anticipated to remain largely absent with exceptionally low levels of construction for the foreseeable future. Quarter-end construction activity totaled 18.6 MSF, a modest increase from 14.1 MSF at the end of the second quarter and well below levels recorded two years ago when 107.0 MSF was underway. Canadian construction also remained subdued with just 2.1 MSF completed during the quarter. U.S. industrial vacancy rate holds steady during the quarter. The U.S. industrial warehouse vacancy rate held steady during the third quarter registering 11.01 percent. This was after a modest move down in the second quarter when the national vacancy rate fell 10 basis points. This confirms our view that vacancies have peaked and will start drifting lower over the coming quarters. Of the 54 markets tracked across the country, 19 saw vacancies increase while the balance registered no change or declines. Canadian warehouse vacancies fell by 25 basis points during the quarter to register 5.63 percent. Despite a firming in demand, rents move lower. Even with the benefit of back-to-back increases in occupied space, industrial rents by and large drifted lower during the third quarter. Warehouse rents fell $0.04 to register $4.74 per square foot while bulk rents largely held steady at $4.21 per square foot, flex rents slipped $0.18 to $8.50 per square foot and R&D rents increased $0.16 to $10.21 per square foot. Canadian industrial rents all drifted marginally lower during the quarter. U.S. Industrial Market Registers Further Gains Continued from page 1 U.S. INDUSTRIAL VACANCY MARKET VACANCY RATE sep. 30, 2010 (%) Boston, MA 21.5 Savannah, GA 21.4 Phoenix, AZ 17.6 Stockton/San Joaquin County, CA 17.5 Las Vegas, NV 16.8 Little Rock 16.7 Fairfield, CA 15.2 Reno, NV 15.1 Detroit, MI 14.8 Atlanta, GA 14.2 Charlotte, NC 13.8 San Jose/Silicon Valley, CA 13.8 Memphis, TN 13.6 Charleston, SC 13.3 Columbus, OH 13.2 Raleigh, NC 13.0 Louisville, KY 12.9 Orlando, FL 12.8 Washington, DC 12.7 Sacramento, CA 12.6 Pleasanton/Walnut Creek, CA 12.5 Columbia, SC 12.3 Los Angeles – Inland Empire, CA 12.3 Nashville, TN 12.1 Chicago, IL 12.0 Dallas/Ft. Worth, TX 11.8 San Diego, CA 11.6 Jacksonville, FL 11.6 New Jersey – Central 11.3 Tampa, FL 11.2 Boise, ID 11.1 Baltimore, MD 11.0 U.S. AVERAGE 11.02 West Palm Beach, FL 11.0 Greenville / Spartanburg 11.0 San Francisco Peninsula, CA 10.6 Philadelphia, PA 9.9 Cleveland, OH 9.8 Bakersfield, CA 9.5 Ft. Lauderdale-Broward County, FL 9.5 Oakland, CA 9.5 Miami, FL 9.4 Hartford, CT 9.3 Cincinnati, OH 8.6 Portland, OR 8.5 St. Louis, MO 8.4 Seattle/Puget Sound, WA 8.2 Fresno, California 8.1 Denver, CO 8.0 New Jersey – Northern 7.8 Kansas City, KS 7.6 Houston, TX 6.6 Orange County, CA 5.9 Los Angeles, CA 5.3 Honolulu, HI 4.4
- 8. highlights | Q3 2010 | industrial | north America www.colliers.com Absorption – Net change in leased space over a given period of time. Bulk Space – 100,000 square feet or more with up to 10 percent office space, the balance being general warehouse space with 20 to 36 foot ceiling heights. All loading is dock-height. Flex Space – Single-story buildings having 10- to 18-foot ceilings with both floor-height and dock-height loading. Includes wide variation in office space utilization, ranging from retail and personal service through distribution, light industrial and occasional heavy industrial use. Inventory – Includes all existing multi or single tenant leased and owner-occupied industrial warehouse, light manufacturing, flex and R&D properties greater than or equal to 10,000 square feet. New Construction – Includes completed speculative and build-to-suit construction. New construction quoted on a net basis after any demolitions or conversions. Service Space – Single story (or mezzanine) with 10- to 16-foot ceilings with frontage treatment on one side and dock-height loading or grade level roll-up doors on the other. Less than 15% office. Tech/R&D – One- and two- story, 10- to 15-foot ceiling heights with up to 50% office/dry lab space (remainder in wet lab, workshop, storage and other support), with dock-height and floor-height loading. Triple Net Rent – Includes rent payable to the landlord and does not include additional expenses such as taxes, insurance, maintenance, janitorial and utilities. All industrial and high-tech/R&D rents in this report are quoted on an annual, triple net per square foot basis in U.S. dollars. Vacancy Rate – Percentage of total inventory available (both vacant and occupied) as at the survey date including direct vacant and sublease space. Warehouse – 50,000 square feet or more with up to 15 percent office space, the balance being general warehouse space with 18- to 30- foot ceiling heights. All loading is dock-height. Glossary COLLIERS INTERNATIONAL 601 Union Street, Suite 5300 Seattle, WA 98101 tel +1 206 223 0866 FAX +1 206 757 9427 FOR MORE INFORMATION Ross J. Moore Chief Economist | USA tel +1 617 722 0221 EMAIL ross.moore@colliers.com 480 offices in 61 countries on 6 continents United States: 135 Canada: 39 Latin America: 17 Asia Pacific: 194 EMEA: 95 • $1.9 billion in annual revenue • 2.4 billion square feet under management • Over 15,000 professionals Copyright © 2010 Colliers International. The information contained herein has been obtained from sources deemed reliable. While every reasonable effort has been made to ensure its accuracy, we cannot guarantee it. No responsibility is assumed for any inaccuracies. Readers are encouraged to consult their professional advisors prior to acting on any of the material contained in this report. Accelerating success.