1. 2011 | CBD PARKING RATES
NORTH AMERICA | CENTRAL BUSINESS DISTRICT
PARKING RATE SURVEY
Parking Rates Little Changed
from 2010
ROSS J. MOORE Chief Economist | USA
Despite a general improvement in economic conditions, most parking garage owners and operators did not
increase parking rates during the last 12 months. which came as a relief to businesses and consumers
GLOBAL COMPARISON confronting significantly higher gas prices.
TOP 25 MONTHLY PARKING RATES* (USD)
In both Canada and the U.S, parking rates registered little change over the past twelve months with excep-
London – City 1,083.59 tion of a few secondary markets. A handful of cities saw double-digit increases, but in most markets park-
London – West End 1,014.32 ing rates held steady, rose marginally, or dropped by just a few percent. This somewhat directionless
pattern largely reflects the uneven nature of the current economic recovery.
Zurich 822.15
Hong Kong 744.72 Daily and monthly parking rates mostly held steady over the past 12 months, with daily parking up 0.8
Tokyo 744.00 percent (reversing a 1.4 percent decrease last year) while monthly rates decreased 0.2 percent (reversing
a 1.1 percent increase in 2009-2010). Largely supporting parking rates is the continued tight balance
Rome 718.90
between supply and demand—even with the economy still far from operating at full capacity. Despite a
Perth 717.43 modest uptick in office leasing activity and a general improvement in the business landscape, monthly
Geneva 704.70 parking rates didn’t increase, as is usually the case. Daily rates, which tend to track the general economy
and consumer spending, show marginally improved demand for infrequent parking, and most likely reflect
Sydney 695.31 a return to more normal driving patterns and the need (and desire) to be downtown.
Melbourne 598.39
While many businesses and consumers are still acting cautiously, demand for parking looks to be slowly
Amsterdam 586.62
returning to pre-recession levels. Parking garage owners and operators have largely held rates steady for
Vienna 575.12 the past several years, but it is unlikely this will be the case for a third consecutive year. With the economic
Brisbane 568.89 recovery anticipated to stay on
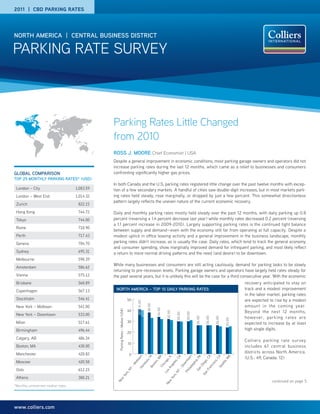
Copenhagen 567.13 NORTH AMERICA – TOP 10 DAILY PARKING RATES track and a modest improvement
in the labor market, parking rates
Stockholm 546.41 50 are expected to rise by a modest
2011 41.00
amount in the coming year.
38.00
New York – Midtown 541.00
34.00
40
Parking Rates – Median (US$)
Beyond the next 12 months,
32.00
2010
30.00
30.00
New York – Downtown 533.00
however, parking rates are
26.00
26.00
26.00
24.00
Milan 517.61 30 expected to increase by at least
Birmingham 496.44 high single digits.
20
Calgary, AB 486.34
Colliers parking rate survey
10
Boston, MA 438.00 includes 61 central business
Manchester 428.82 districts across North America.
0
(U.S.: 49, Canada: 12)
n
I
A
, IL
CA
n
PA
CA
A
WA
,H
ow
tow
M
C
Moscow 420.58
go
u
ia,
s,
o,
o,
n,
le,
dt
lul
wn
ele
isc
eg
ica
lph
to
Mi
att
no
s
Di
Do
c
ng
Ch
de
Se
Bo
–
an
Ho
Oslo 612.15
n
sA
ila
Y
–
Fr
Sa
N
Ph
NY
Lo
n
k,
Sa
r
k,
Yo
Athens 388.21
r
Yo
w
continued on page 5
Ne
w
Ne
*Monthly unreserved median rates
www.colliers.com
2. CBD PARKING RATE SURVEY | 2011 | NORTH AMERICA
UNITED STATES
DAILY PARKING RATE (USD) HOURLY PARKING RATE (USD)
% CHANGE
MARKET HIGH LOW MEDIAN FROM 2010 HIGH LOW MEDIAN
Atlanta, GA 22.00 5.00 12.00 0.0 8.00 1.00 4.00
Bakersfield, CA 10.00 6.00 8.00 0.0 3.50 2.00 1.75
Bellevue, WA 20.00 12.00 17.26 23.3 7.00 3.00 6.00
Boise, ID 12.00 12.00 12.00 0.0 1.50 1.50 1.50
Boston, MA 40.00 20.00 34.00 6.3 26.00 5.00 12.00
Charleston, SC 16.00 10.00 10.00 0.0 4.00 1.00 2.00
Chicago, IL 52.00 17.00 32.00 3.2 28.00 10.00 17.00
Cincinnati, OH 15.00 6.00 10.00 2.6 6.50 1.00 3.50
Cleveland, OH 16.00 3.00 8.50 1.4 12.00 2.25 7.00
Columbia, SC 12.00 7.00 10.00 0.0 3.00 0.75 1.25
Columbus, OH 15.00 4.00 10.00 0.0 8.00 1.00 3.00
Dallas, TX 21.00 3.00 10.25 2.5 10.00 1.00 4.50
Denver, CO 26.00 12.00 16.00 0.0 10.00 2.00 8.00
Fresno, CA 10.00 8.00 9.00 0.0 3.00 1.00 1.50
Ft. Lauderdale, FL 25.00 10.00 15.00 0.0 3.00 0.50 1.00
Greenville, SC 6.00 6.00 6.00 0.0 1.50 0.50 1.00
Hartford, CT 30.00 14.00 19.00 -5.0 5.00 2.00 3.00
Honolulu, HI 75.00 21.00 38.00 -7.3 10.00 2.25 6.00
Houston, TX 30.00 5.00 14.50 20.8 13.00 2.00 4.50
Indianapolis, IN 24.00 3.00 12.00 -7.7 3.00 1.00 2.00
Jacksonville, FL 12.84 6.42 8.56 -1.6 4.00 1.07 1.47
Kansas City, KS 16.00 5.00 10.88 – 4.00 2.00 3.50
Little Rock, AR 10.00 3.00 7.36 -8.0 1.50 1.00 1.29
Los Angeles, CA 47.00 5.00 30.00 1.2 25.00 4.00 12.50
Memphis, TN 6.00 1.00 4.00 0.0 12.00 2.00 6.00
Miami, FL 19.00 5.00 17.00 0.0 6.00 3.00 5.00
New Haven, CT 18.00 14.00 17.10 – 4.00 3.00 3.80
New York – Downtown 40.00 20.00 30.00 -3.2 27.00 10.00 20.00
New York – Midtown 72.00 12.00 41.00 2.5 40.00 9.00 22.00
Oakland, CA 30.00 9.00 18.00 0.0 6.00 2.25 4.00
Omaha, NE 25.00 7.50 15.00 – 10.00 3.00 6.00
Orlando, FL 30.00 10.00 15.00 0.0 6.00 1.00 2.00
Philadelphia, PA 34.00 18.00 26.00 0.0 17.00 8.00 13.00
Phoenix, AZ 12.00 7.00 8.00 -11.1 3.00 1.50 2.50
Portland, OR 25.00 7.00 15.00 15.4 12.00 1.50 5.00
Raleigh, NC 12.00 6.00 10.00 – 3.00 0.50 1.00
Sacramento, CA 20.00 6.00 15.00 -25.0 5.25 1.00 3.00
San Diego, CA 30.00 18.00 26.00 0.0 10.00 6.00 8.00
San Francisco, CA 39.00 7.50 26.00 4.0 18.00 2.50 9.00
San Jose/Silicon Valley, CA 20.00 5.00 15.00 0.0 3.75 2.25 3.00
Savannah, GA 16.00 10.00 10.00 0.0 2.00 1.00 1.00
Seattle, WA 35.00 14.00 24.00 -4.0 13.00 4.00 9.00
St. Louis, MS 24.00 4.00 12.00 – 4.00 1.00 2.00
Tampa, FL 20.00 7.00 11.00 -26.7 3.50 1.50 2.25
Walnut Creek, CA 10.00 6.00 8.00 0.0 3.00 1.00 2.00
Washington, DC 20.00 16.00 18.00 20.0 12.00 9.00 10.00
West Palm Beach, FL 20.00 15.00 16.00 0.0 1.50 0.75 1.00
U.S. NATIONAL AVERAGE 24.25 9.12 16.12 0.8 8.99 2.63 5.32
CANADA
DAILY PARKING RATE (CAD) HOURLY PARKING RATE (CAD)
% CHANGE
MARKET HIGH LOW MEDIAN FROM 2010 HIGH LOW MEDIAN
Calgary, AB 35.00 11.00 25.00 13.6 10.00 3.00 7.00
Edmonton, AB 30.00 8.00 18.00 28.6 5.00 3.00 5.00
Halifax, NS 20.00 10.00 14.00 -12.5 4.00 2.00 3.00
Kitchener-Waterloo, ON 18.00 10.00 12.00 20.0 3.00 2.00 2.75
Montreal, QC 20.00 15.00 18.00 5.9 10.50 6.00 9.00
Ottawa, ON 24.00 12.00 15.00 -16.7 7.00 4.50 4.00
Regina, SK 10.00 6.00 10.00 0.0 3.00 1.00 2.00
Saskatoon, SK 12.00 8.50 9.25 -2.6 3.00 2.00 2.00
Toronto, ON 38.00 14.00 23.00 0.0 21.00 4.00 9.00
Vancouver, BC 31.00 10.00 20.00 8.1 9.00 2.50 7.00
Victoria, BC 15.00 10.75 13.50 22.7 2.25 1.00 1.25
Winnipeg, MB 12.00 8.00 9.00 0.0 4.50 2.00 4.00
CANADA NATIONAL AVERAGE 22.08 10.27 15.56 4.9 6.85 2.75 4.67
P. 2 | COLLIERS INTERNATIONAL
3. CBD PARKING RATE SURVEY | 2011 | NORTH AMERICA
UNITED STATES
MONTHLY UNRESERVED PARKING RATE (USD) MONTHLY RESERVED PARKING RATE (USD)
% CHANGE
MARKET HIGH LOW MEDIAN FROM 2010 HIGH LOW MEDIAN
Atlanta, GA 135.00 35.00 95.00 2.2 200.00 40.00 150.00
Bakersfield, CA 65.00 45.00 55.00 0.0 70.00 60.00 60.00
Bellevue, WA 221.00 109.50 180.00 11.1 390.00 150.00 317.22
Boise, ID 90.00 80.00 80.00 0.0 100.00 90.00 95.00
Boston, MA 520.00 320.00 438.00 3.1 675.00 350.00 453.00
Charleston, SC 140.00 110.00 120.00 9.1 150.00 125.00 135.00
Chicago, IL 435.00 200.00 289.00 -9.7 515.00 260.00 400.00
Cincinnati, OH 225.00 90.00 160.00 6.7 250.00 170.00 200.00
Cleveland, OH 225.00 70.00 140.00 -9.7 245.00 150.00 185.00
Columbia, SC 90.00 52.00 65.00 0.0 135.00 65.00 85.00
Columbus, OH 190.00 75.00 110.00 -12.0 220.00 100.00 142.00
Dallas, TX 155.00 40.00 85.00 0.0 300.00 100.00 155.00
Denver, CO 200.00 100.00 175.00 0.0 275.00 185.00 225.00
Fresno, CA 95.00 50.00 60.00 -7.7 100.00 60.00 70.00
Ft. Lauderdale, FL 90.00 60.00 78.00 20.0 200.00 100.00 138.00
Greenville, SC 69.70 69.70 69.70 0.0 94.70 94.70 94.70
Hartford, CT 264.05 151.69 201.12 14.9 264.05 151.69 201.12
Honolulu, HI 253.40 172.77 217.28 -3.4 425.00 260.00 345.28
Houston, TX 250.00 50.00 153.00 4.8 417.00 98.00 237.00
Indianapolis, IN 155.00 60.00 120.00 4.3 175.00 105.00 150.00
Jacksonville, FL 125.00 85.60 101.65 6.4 155.15 107.00 107.00
Kansas City, KS 136.00 65.00 90.61 – 155.00 94.00 120.00
Las Vegas, NV 65.00 65.00 65.00 0.0 95.00 95.00 95.00
Little Rock, AR 80.62 53.75 66.17 11.9 91.38 59.12 74.02
Los Angeles, CA 363.00 100.00 209.50 -0.2 598.00 192.00 282.50
Memphis, TN 90.00 20.00 57.00 0.0 140.00 65.00 100.00
Miami, FL 163.00 50.00 125.00 -16.7 193.00 110.00 150.00
New Haven, CT 185.50 95.40 137.00 – – – –
New York - Downtown 800.00 310.00 533.00 0.8 – – –
New York - Midtown 1,200.00 379.00 541.00 0.6 – – –
Oakland, CA 225.00 140.00 192.50 -1.3 265.00 250.00 255.00
Omaha, NE 82.50 47.50 67.50 – 117.50 47.50 67.50
Orlando, FL 180.00 55.00 80.00 -8.6 360.00 75.00 150.00
Philadelphia, PA 464.00 175.00 303.63 1.2 582.00 200.00 370.13
Phoenix, AZ 80.00 25.00 50.00 25.0 95.00 30.00 65.00
Portland, OR 210.00 130.00 185.00 0.0 260.00 150.00 190.00
Raleigh, NC 105.00 70.00 100.00 – 145.00 115.00 125.00
Reno, NV 55.00 30.00 45.00 0.0 75.00 45.00 60.00
Sacramento, CA 200.00 100.00 155.00 -22.5 225.00 150.00 185.00
San Diego, CA 190.00 150.00 170.00 0.0 275.00 190.00 225.00
San Francisco, CA 550.00 200.00 375.00 0.0 600.00 225.00 400.00
San Jose/Silicon Valley, CA 165.00 70.00 100.00 0.0 250.00 150.00 200.00
Savannah, GA 100.00 35.00 80.00 0.0 280.00 125.00 160.00
Seattle, WA 400.00 200.00 294.00 3.2 680.68 265.00 379.00
St. Louis, MS 200.00 45.00 90.00 – 160.00 110.00 140.00
Tampa, FL 150.00 100.00 125.00 -7.4 250.00 145.00 195.00
Walnut Creek, CA 75.00 45.00 60.00 0.0 150.00 100.00 125.00
Washington, DC 295.00 220.00 260.00 6.1 625.00 350.00 475.00
West Palm Beach, FL 100.00 30.00 56.00 -18.7 125.00 40.00 72.00
U.S. NATIONAL AVERAGE 222.51 102.69 155.22 -0.2 264.10 134.76 187.08
CANADA
MONTHLY UNRESERVED PARKING RATE (CAD) MONTHLY RESERVED PARKING RATE (CAD)
% CHANGE
MARKET HIGH LOW MEDIAN FROM 2010 HIGH LOW MEDIAN
Calgary, AB 625.00 252.00 472.50 4.2 708.00 340.00 504.00
Edmonton, AB 350.00 130.00 275.00 0.0 375.00 240.00 340.00
Halifax, NS 187.75 157.75 166.75 5.4 230.00 155.25 157.75
Kitchener-Waterloo, ON 137.20 107.35 128.24 9.7 152.87 118.65 135.76
Montreal, QC 461.50 250.00 296.21 5.6 594.00 338.63 422.77
Ottawa, ON 282.00 187.00 195.00 -6.6 290.00 200.00 240.00
Regina, SK 215.25 110.25 168.00 3.2 246.75 131.25 190.00
Saskatoon, SK 183.75 152.25 157.50 -5.7 367.50 152.25 173.25
Toronto, ON 621.50 226.00 332.38 -1.2 680.00 310.00 480.25
Vancouver, BC 501.42 169.40 287.98 7.9 596.29 243.94 420.11
Victoria, BC 246.40 123.20 184.80 2.7 369.60 212.80 280.00
Winnipeg, MB 278.25 120.75 152.25 0.0 278.25 152.25 194.25
CANADA NATIONAL AVERAGE 340.84 165.50 234.72 2.1 407.36 216.25 294.85
COLLIERS INTERNATIONAL | P. 3
4. CBD PARKING RATE SURVEY | 2011 | NORTH AMERICA
UNITED STATES
GARAGES OFFERING TYPICAL WAIT GARAGES TO BE NUMBER OF
ADDITIONAL GARAGES WITH PERIOD AVAILABILITY ADDED IN NEXT PARKING SPOTS
MARKET SERVICES (%) WAITING LISTS (%) (MONTHS) OF PARKING 24 MONTHS TO BE ADDED
Atlanta, GA 25% 0% – Fair 0 0
Bakersfield, CA 0% 0% – Fair 0 0
Bellevue, WA 25% 0% – Fair 0 0
Boise, ID 0% 75% – Limited 0 0
Boston, MA 25% 0% – Fair 0 0
Charleston, SC 0% 50% 12 Limited 0 0
Chicago, IL 50% 15% 2.5 Fair 0 0
Cincinnati, OH 25% 50% – Limited 1 1,400
Cleveland, OH – – – – – –
Columbia, SC 0% 20% 3 Fair 1 532
Columbus, OH 20% 50% – Fair 0 0
Dallas, TX 50% 25% – Fair 0 0
Denver, CO 25% 0% – Fair 0 0
Fresno, CA 10% 0% – Fair 0 0
Ft. Lauderdale, FL 25% 5% – Fair 0 0
Greenville, SC 0% 0% – Abundant 0 0
Hartford, CT 10% 20% 1 Abundant 0 0
Honolulu, HI 5% 10% – Limited 0 0
Houston, TX 75% – – Limited 0 0
Indianapolis, IN 10% 5% 1 Fair 0 0
Jacksonville, FL 25% 5% 1 Fair 0 0
Kansas City, KS 0% 5% – Fair 0 0
Las Vegas, NV 0% 0% – Fair 0 0
Little Rock, AR 20% 25% 1.5 Fair 0 0
Los Angeles, CA 15% 10% – Fair 0 0
Memphis, TN 5% 5% – Fair 0 0
Miami, FL 25% 5% – Fair 0 0
New Haven, CT 10% 20% 4.5 Fair 1 550
New York - Downtown 100% 5% – Fair 0 0
New York - Midtown 100% 5% – Fair 0 0
Oakland, CA 5% 0% 24 Fair 0 0
Omaha, NE 0% 75% 6 Limited 0 0
Orlando, FL 20% 20% – Fair 0 0
Philadelphia, PA 20% 5% – Fair 0 0
Phoenix, AZ 10% 0% – Abundant 2 1,000
Portland, OR 10% 5% – Fair 0 0
Raleigh, NC 0% 10% 6 Fair 0 0
Reno, NV 0% 0% – Fair 0 0
Sacramento, CA 25% 0% – Fair 0 0
San Diego, CA 5% 0% – Limited 0 0
San Francisco, CA 50% 5% – Fair 0 0
San Jose/Silicon Valley, CA 20% 0% – Fair 0 0
Savannah, GA 0% 0% – Limited – –
Seattle, WA 8.10% 5% – Fair 0 0
St. Louis, MS 15% 25% 3 Limited 0 0
Tampa, FL 0% 10% – Fair 0 0
Walnut Creek, CA 10% 10% – Abundant 0 0
Washington, DC 50% 10% – Fair 0 0
West Palm Beach, FL 25% 5% – Fair 0 0
U.S. NATIONAL AVERAGE 19.9% 12.7% 5.5 – – –
CANADA
GARAGES OFFERING TYPICAL WAIT GARAGES TO BE NUMBER OF
ADDITIONAL GARAGES WITH PERIOD AVAILABILITY ADDED IN NEXT PARKING SPOTS
MARKET SERVICES (%) WAITING LISTS (%) (MONTHS) OF PARKING 24 MONTHS TO BE ADDED
Calgary, AB 10% 50% – Fair 3 n/a
Edmonton, AB 5% 10% 1 Fair 1 n/a
Halifax, NS 0% 75% 10.5 Limited 0 0
Kitchener-Waterloo, ON 0% 25% 18.5 Fair 1 412
Montreal, QC 65% 25% 5 Limited 0 0
Ottawa, ON 50% 25% 3 Fair 1 50
Regina, SK 0% 50% 60 Limited 1 53
Saskatoon, SK 0% 75% 18 Limited 0 0
Toronto, ON 25% 15% – Fair 0 0
Vancouver, BC 25% 25% 2 Fair 0 0
Victoria, BC 0% 50% 9 Limited 0 0
Winnipeg, MB 5% 5% 2.5 Fair 0 0
CANADA NATIONAL AVERAGE 15.4% 35.8% 9.1 – – –
P. 4 | COLLIERS INTERNATIONAL
5. CBD PARKING RATE SURVEY | 2011 | NORTH AMERICA
Parking Rates Little Changed From 2010 UNITED STATES MONTHLY PARKING RATES* (USD)
Continued from page 1 0 100 200 300 400 500 600
New York - Midtown 541.00
New York - Downtown 533.00
UNITED STATES Boston, MA 438.00
• Monthly parking rates decreased marginally during the past 12 months, San Francisco, CA 375.00
Philadelphia, PA 303.63
dropping $0.34 or 0.2%. Seattle, WA 294.00
• The monthly U.S. median parking rate now averages $155.22 USD per month. Chicago, IL 289.00
Washington, DC 260.00 U
• By contrast daily rates increased slightly rising 0.8%. Honolulu, HI 217.28
Los Angeles, CA 209.50
• The U.S. median rate for daily parking now averages $16.49 USD. Hartford, CT 201.12
• As was the case a year ago, extremes in monthly parking rates range from a Oakland, CA 192.50
Portland, OR 185.00
high of $1,200.00 USD in Midtown Manhattan to a low of $20.00 USD in Bellevue, WA 180.00
Memphis. Denver, CO 175.00
San Diego, CA 170.00
• The five most expensive parking districts (as represented by median rate) in Cincinnati, OH 160.00
the United States: Midtown Manhattan ($541.00 USD), Lower Manhattan U.S. NATIONAL AVERAGE 155.22
($533.00), Boston ($438.00), San Francisco ($375.00) and Chicago Sacramento, CA 155.00
Houston, TX 153.00
($289.00) per month.
Cleveland, OH 140.00
• The five least expensive: Reno ($45.00), Phoenix ($50.00 USD), Bakersfield New Haven, CT 137.00
Miami, FL 125.00
($55.00), West Palm Beach ($56.00), and Memphis ($57.00) median rate per
Tampa, FL 125.00
month. Charleston, SC 120.00
Indianapolis, IN 120.00
• Continuing a trend seen over the past few years, 12.7% of parking garages had
Columbus, OH 110.00
a waiting list with an average wait of 5.5 months, compared with 12 months Jacksonville, FL 101.65 San
ago when 11.6% had a waiting list with an average wait of 6.2 months. Three Raleigh, NC 100.00
years ago 20.9% had a waiting list. San Jose/Silicon Valley, CA 100.00
Atlanta, GA 95.00
• In all but a few cities, parking is far from abundant. Just four markets— Kansas City, KS 90.61
Greenville, S.C., Phoenix, Hartford and Walnut Creek, Calif.—described the St. Louis, MS 90.00
Dallas, TX 85.00
supply of parking in their city as ample or plentiful. Nearly three quarters Boise, ID 80.00
(73%) of cities surveyed described supply as “fair” (i.e., parking garages are Orlando, FL 80.00
60-80% full Mon-Fri and on weekends during special events), while 19% Savannah, GA 80.00
Ft. Lauderdale, FL 78.00
indicated parking was “limited” (parking garages are usually full Mon-Fri and Greenville, SC 69.70
on weekends during special events) and eight percent said “abundant” Omaha, NE 67.50
(parking garages are consistently less than 60% full). By these measures, Little Rock, AR 66.17
Columbia, SC 65.00
parking pressures have increased modestly. 65.00
Las Vegas, NV
• Just 10% of cities surveyed indicated new garages will be constructed in the Fresno, CA 60.00
Walnut Creek, CA 60.00
next 24 months. 57.00
Memphis, TN
West Palm Beach, FL 56.00
Bakers eld, CA 55.00
CANADA Phoenix, AZ 50.00
Reno, NV 45.00
• Monthly parking rates in Canada increased by $4.89 CAD, a 2.1% gain over the
0 100 200 300 400 500 600
past year. This is broadly in line with increases recorded in 2009–2010.
*Monthly unreserved median rates
• The monthly median parking rate in Canada now averages $234.72 CAD.
• By comparison Canadian daily rates increased by 4.9% after increasing 2.0%
in 2009/2010 CANADA MONTHLY PARKING RATES* (CAD)
• In central business districts across Canada the median rate for daily parking 0 100 200 300 400 500 600
now averages $15.56 CAD. Calgary, AB 472.50
Toronto, ON 332.38
• The five most expensive parking districts in Canada (as represented by median
Montreal, QC 296.21
rate) are Calgary ($473.00 CAD), Toronto ($332.00), Montreal ($296.00), Vancouver, BC 287.98
Vancouver ($288.00), and Edmonton ($275.00) per month. Edmonton, AB 275.00
CANADA NATIONAL AVERAGE 234.72
Ottawa, ON 195.00
INTERNATIONAL (SEE GLOBAL REPORT FOR FULL LIST) Victoria, BC 184.80
• London again ranked as the most expensive (as represented by median Regina, SK 168.00
Halifax, NS 166.75
monthly rate) with London – City leading the way ($1,084.00 USD) followed by
Saskatoon, SK 157.50
London – West End ($1,014.00), Zurich ($822.00), Hong Kong ($745.00), Winnipeg, MB 152.25
Tokyo ($744.00), Rome ($719.00), Perth ($717.00), Geneva ($705.00), Sydney Kitchener-Waterloo, ON 128.24
($695.00) and Melbourne ($598.00) rounding out the top ten. 0 100 200 300 400 500 600
*Monthly unreserved median rates
COLLIERS INTERNATIONAL | P. 5