1. Guidance Automated Trading Systems
(This material is copyright & confidential…for your eyes only…you may not copy or distribute)
Company Overview and Mission:
Intuitively Interactive Guidance Systems, LLC. (IIGS), a California based Limited Liability Company, was formed by Merrill
Moses and Cort Hooper for the purpose of developing automated trading systems. Six years and nearly $3,000,000 of
the founder’s time and money to date have gone into the systems and capabilities described herein during that period.
This is on top of nearly 40 years of unique and proprietary technical financial market research by the system developer
which preceded this.
The mission is not designed to make rich people ‘Uber’ Rich... but to help a greater number of people make a better
living for themselves and for their families. Thus, the emphasis to date has been to develop low risk systems for small
accounts and to provide a variety of ways in which smaller account holders can potentially benefit. Serving larger funds
will come later.
Systems Description & Service:
‘Guidance’ is a basket of fully automated trade generation and execution systems. They are conceptually Intuitive,
highly Interactive and uniquely Structured. The systems were designed from the on-set to provide direction (guidance)
and execution of trades for use in the most actively traded (domestic and global) financial markets (equities and
futures). They may be “dialed up” for day trading systems (several trades per hour per instrument for accounts as small
as $25,000) or “dialed down” for large fund type trading systems (3-12 trades per year per instrument for multi-billion
dollar funds), or any sensible frequency or account sizes in-between. They have been consistently effective on bars
spanning 1 Min, 5 Min, 10 Min, 30 Min, 1 Hr. and daily or weekly time-frames, yet of course , subject to the
Disclaimers in the Appendix which you should read and understand.
The current systems are for the individual who has either ‘No System’ or ‘Plan’ of their own… and/or who wants an
“automated” system that is working for them at all times…or simply wants something that works better than what they
have. The company’s servers will send a single trading signal to the securities house (Interactive Brokers) holding the
client’s account whereby the Company’s “Parent” account upon receiving the trading signal, simultaneously distributes
trades to ALL “child/client accounts” (individual segregated accounts in the name and sole signatory control of each
client) underneath and attached to it. In this way, “Guidance” is an interactive System (to the existing market
conditions) and a fully hands-off automated trade signal generator.
Despite this, the program still allows the client to have complete control of their account and /or to assign their ‘Trading
Account’ to the Companies ‘Parent Account’. The client at any time, per their choice, could manually or electronically
control and instruct their account to withdraw funds, add funds, stop signals, etc.
2. System Developer:
At 14 years old, the founding developer, Cort Hooper, first studied the stock market as part of a high school math class
and saw a lifetime application of his love for research, development and of studying the use of numbers. At 16, while in
college at UCLA as a systems engineering major, he started monitoring graduate classes in finance and economics. Two
years later, he went to work for his grad school mentor at a major aerospace company (a market expert in his own right)
where Cort worked full time, while still in college, as a reliability systems and missile ‘Guidance Engineer’, later becoming a
program manager for the Hawk and Nike missile systems. There, along with being a dual math and engineering major,
he learned and developed the advanced mathematics, which have formed the stable of mathematical techniques used
in ‘Guidance’ today. After finishing his Bachelor Degree in Systems Engineering at UCLA and while finishing a graduate
degree in Business Administration and Management (and before commissioning as a US Naval Officer), he had unique
access (through work and the university) to the best computers of their day. Virtually no other trading system developers
had such computer power access for still years to come. This gave Cort a good head start. For the 4 years prior, he hand
calculated and plotted indicators and price series for nearly 4 hours per day (during which he could only finish and study
a year’s worth of daily data per day). Now, with computer capability, he could research, test and develop enough data
and experience, that he published two (2) National Advisory Newsletters (“Futures of Futures” and “Options of Options”) on the
markets. With virtually no electronic data bases available, he hand punched over 500,000 IBM punch cards with data
from the Wall Street Journal, etc.… a matchless and priceless way along with his hand plotted charts to really get a “feel”
and respect for the irregularity and nature of financial data series…one trade and price change at a time.
While being posted at the US Naval Postgraduate School in Monterrey, California, Cort had sole access to another
powerful computer and plotter for 7 hours a day on the graveyard shift, which accelerated our R&D. In the nearby
community of Carmel Valley, he was additionally fortunate to meet another market mentor (Larry Williams, one of the
acknowledged “gurus” of technical analysis still active today), where Cort traded his technical services for the priceless
experience of helping that leading newsletter publisher develop and analyze leading edge indicators (purportedly sold at
that time to a major brokerage for over $1 million dollars). A few of these indicators or their derivatives developed by
Larry Williams are still found in “trading platform” technical analysis “tool boxes” today. This was an invaluable
experience in developing “perspective and imagination” in indicator development and used as an initial foundation of
the base market perspective properties within Guidance today.
Additionally our founding engineer at this point, upon departing from the Armed Services, used his work to advise Trust
Departments of various banks on the timing of their portfolio acquisitions and allocations for the next 5 years. He did
stay active in financial markets from that point forward as he secured an investment advisor license and four (4) other securities
licenses, plus did Doctoral studies in Finance & Human Behavior along the way to support the ongoing needs of his
business clientele’s investments. Between then and 2008 he continued his research in earnest but made his primary
living in Real Estate development and financial advisory work.
Development History:
Over the last 30 years, ‘Guidance’ took advantage of the developing “Computer and Internet” technology, which
eventually needed electronic markets to mine and trade. Our system was next programmed on the first “personal
computers” to come out in the early 1980’s. Although Cort’s indicators developed to date were considered “leading
edge”, they had not departed from the traditional type of systems in terms of major concepts… they were just more
reactive with less lag and combined more effectively. As technology and databases progressed, so did the ability to be
able to develop and test true adaptability of indicators and systems to market conditions. In addition, the ability to drill
down to 1-minute bar accuracy became a reality. During this time, the developer spent one full day per week and a
concentrated 2 weeks per year in the development and testing of ‘Guidance’. As it became apparent that trading would
one day involve electronic exchanges, the goal was a FULLY AUTOMATED SYSTEM that would always be in the market ready
for the next signals.
In 2008, the FULL ‘Guidance’ Development Team came together with co-founder Merrill Moses… and started work on
‘Guidance’ THE BUSINESS, Full Time to bring these ideas and concepts to fruition. He became the other founding
3. member and the strategic advisor on the development team (having extensive ‘International’ experience in the Finance
and Banking arena as well as the financial markets). He has brought an additional layer of expertise to the development
Team including experience in discounted Financial Bank Instruments, Hard Asset funding, Secondary Financing markets
as well as Documentary & Standby Letters of Credit. The Team at that point had collectively the Financial, Foreign
Currency Exchange and Market experience for the future growth of the company. The “Guidance Team” as a whole will
be responsible for the overall project and systems development, the marketing and set-up for ‘strategic financial
management’, as well as the reporting and accountability necessary to execute proper market development.
Market Frameworks:
One needs some perspective from which to view the trading world price series and figure out how to best
base a system or systems to take advantage of that knowledge. Three basic observations are foundational for
Guidance;
1. All financial and market price series have three main behavioral characteristics:
Trending tendencies enough to profit from (directional Growth).
Oscillating motion around the trends (variable Waves).
Direction-less chop and consolidation (white Noise).
Thus, graphically a bar chart data Series = Trend + Waves + Noise
2. There is an “average” percentage of clock time across most all financial and market data series
in which their market prices fundamentally exhibit those behaviors (Market States):
Noise: 55%
Waves: 30%
Trends: 15%
Most systems do NOT take the above into account and fight the 55%! They try to throw out
the noise in their calculations…Guidance concentrates on MEASURING and profiting from it!
3. Successful systems generally fall into one of three main System Types or classifications (or
variances or combinations thereof):
Trend Following ( for sustained directional moves)
Breakouts (when the waves make new highs or lows)
Reversion-to-the Mean ( for sideways chop in a narrow range)
Thus, our System Types (orientation and Rule sets) match Market States as follows:
Market State : % Time: Trending: 15% Waves or Swings: 30% Choppy or Sideways: 55%
System Applicable: (Trend Following) (Breakout) (Reversion-to-the-Mean)
4. Guidance is a SMART ADAPTIVE HYBRID SYSTEM INTEGRATING ALL THREE TYPES. Most computer program trading by
others is oriented to be one only (usually Trend Following like the large managed funds use), since it is much harder
(near impossible?) to harness two types, let alone all three at once. Despite price series morphing in and out of various
states frequently with marked irregularity, and with any 2 or 3 occurring simultaneously, Guidance is able to deal with
and be based upon all three.
It cannot of course predict the shifting or duration of Market States…but it does ADAPT to those shifts efficiently,
much like a heat seeking missile adapts to tracking the evasion maneuvers of an enemy jet fighter. Guidance uses that
type of math. Proprietary measures of Volatility are key to how well Guidance adapts and weights the integrated use of
its System Types and refines the accuracy of that tracking.
For every System Type within Guidance, there is a corresponding Trading Framework that is used for the specific
Strategy and Tactics employed, What is Measured by the indicators, and how the Testing is evaluated.
Trading Frameworks:
A successful system MUST have three basic strengths:
A Definable, Programmable and Consistent “EDGE” in BOTH system Development & Execution.
The ability to Calculate and Measure the ODDS of tradable Trends (especially short term).
Adaptiveness of Strategy and Tactics and What is Measured (Indicators) to interactive
measures of Volatility,
The Guidance “EDGE”:
Our Definable, Programmable and Consistent EDGE is made up of 3 things:
What we Measure (genesis of our indicators): We measure what relates to the nature of price
series…others measure “averages” and the like with lots of lag and usually relevance to only
one market type ( ask any trader if they ever got killed using RSI or Stochastic when a market
started trending).
How we apply what we measure (Strategy and Tactics)…”The Rules”: We are totally adaptive
to shifting Market States like a heat seeking missile and calculate the likely odds of price
movement for the next 15 minutes and act accordingly. Addictiveness to other system
developers is usually using different look back periods (if they do that at all) for their averages.
How rigorous we conduct our Testing: Our “Best by Test” approach tests our Rules on Millions
of data series, not just a dozen or so. It gives the term “ROBUST” new meaning. The following
explanation of our “Pseudo-Series” will explain how. You will not see this anywhere else.
Thus, in the Guidance Trading Framework, Successful Trading boils down to 3 things on which we focus:
“The Rules” (being the same across all markets and consistently applied…totally automated).
Consistency of Strategy and Performance (across all Market States, Types and Time Windows).
Money Management (position sizing and risk)…risk adjusted returns adaptive to performance.
5. The success with these emanated from the keystone use of Guidance’s proprietary “Pseudo-Series”, after we
studied the failure rates and weaknesses of most all the common “tool box” indicators and decided to chuck
them all and start with a fresh “piece of paper” nearly 6 years ago. If professionally you want to “get into the
weeds” on the significance of this and how we use it, we have provided our white paper on it in the
Appendix.
In a nutshell: The genesis of all Guidance indicators comes from our measures of Growth, Variance and
Noise used in this mathematical equation which (after extraction from a data series and input into this
formula) produces a clone data series (although with a much different value range) from the original. We also
measure the correlation of the equation based output series to the original for different adaptive look-back
periods as a measure of how “in tune” our indicators are at any point in time, and time our exits
predominately at points in time when this correlation is a perfect 1.0. You won’t find that anywhere either.
Thus, the Guidance use of its Pseudo-Series, and its applications to our trading strategies and tactics, is the
“secret sauce” of our EDGE. You will not see it used in trading systems anywhere else and may find it
fascinating…it’s worth the read if you have the time, but it is not necessary to have it working for you .
Guidance Characteristics:
The rest of this overview describes what Guidance Measures, the nature of “The Rules” and how we Test.
These define the resulting nature of the Guidance systems, which are that, they:
Get in on high probability moves and stick with them when they work, exiting quickly when not.
Look at Volatility to determine if the Market State is Noise or the likely beginning of a Trend.
Lower commitment on High Volatility and vice versa.
Have highest exposures when the Trend is likely to continue.
Get out when moves become excessive.
Trade off less return for less drawdown.
Buy strength and sell weakness.
Make it hard to get knocked out.
Take into account “Risk of Ruin” in position sizing and risk per position.
Are evaluated by techniques of a systems engineer and research scientist.
What is Measured:
A basket of Proprietary indicators (designed to measure all the pertinent price behavior variables), mathematically
reflective of various phenomena and conditions with which we are familiar and measure in the scientific and physical
world, are applied with varying Addictiveness (look-back periods, other indicator values, etc.) to each Market State so
our “heat seeking” trades closely track price. These are:
Volatility
Momentum
Distortion
Elasticity
Force
Mass
Acceleration
6. Speed
Turbulence
Trendiness
Waviness
Noise
Support
Resistance
…and what is all of these calculations supposed to do?...simply calculate the ODDS of which way the price is likely to go in
the next 15 minutes and enter based upon the tick trend when the odds are right. Those two trends are all we care
about. Various Entry and Exit criteria are then constructed from these ODDS calculated ON EVERY TICK and potentially
acted upon in 15 minute intervals.
For this reason, and other factors of common sense, Guidance has two core trading systems:
A Trend System named “Evergreen”
A Tick System affectionately dubbed “The Won Second Wonder”
The former eats up Trend and Wavy movements (occurring collectively 45% of the clock time) and the latter thrives on
that pesky 55% of the clock time when the market chops up one’s trades like a food processor. Running them both
simultaneously isn’t rocket science. Other’s systems that are Trend based have only 15% of the time to make hay and
spend the rest of the 85% of the time trying not to give it all back like with slot machines in Las Vegas. Guidance by-
passes that limitation since one system benefits from the 45% and the other from the 55%, and they are run
simultaneously.
The hardest thing to do in automated trading systems is to measure and define trends in very short time periods (like 15
minute bar trends in our Trend System and 8 second tick trends in our Tick System). This is all Guidance does , as its short
trends are closer to price at the point of trade entry, thus resulting in the lowest position risk possible (being very close
to the most recent support and resistance). A live demonstration on your computer watching one of ours on buy and sell
signal generation on real-time ticks, will let you see just how well Guidance does with what eludes so many others.
Strategy & Tactics (Rules):
…and what Strategies using the above systems and indicators are employed interactively (variably) to activity (Volatility)?
Profit Targets are set for each 1 of 3 Market States as they shift back and forth
Stop Losses (fixed and trailing) are set for each 1 of 3 Market States
Break Even stops after certain initial gains are set for each 1 of 3 Market States
Selection of indicators are based upon volatility & current performance of the live Equity Curve
Entries are based upon profitability of Last Position and strength and duration of trend
Trend Projections are based upon the net of cumulative profit and loss trade strings
Trading only is with or against the Trend Projection set for each 1 of 3 Market Stages in combination with recent
profitability
…and with what trading Tactics are the above designed and implemented?
Enter LATE on “runaway freight train moves” and Exit a little EARLY
Cut Losses and let Profits on big moves Run
7. Don’t take positions in periods of LOW activity
Diversify trades through systems (timeframes, trade frequency, indicators, and rules)
Maximize Risk-Adjusted Returns, not Net Profits by focusing on drawdowns
Always be measuring the Market (since most big moves launch from sleepy activity)
Trade fully automated executions only…no discretionary input
Minimize chance of ruin by committing only a small fraction of account equity to total active positions, never
risking more than 2% of account balance per position.
The Guidance Motto: “It’s NOT how much you make when you are right… BUT how LITTLE you lose when
you’re wrong! ” …measuring and managing Risk is JOB 1.
Testing:
Guidance and its predecessors have been developed and Tested:
For over 40 years
…by: the “Old Fashioned Way” (years of charting, hand calculating, plotting, observing, etc.)
…by: the “New Fashioned Way” (terabytes of data runs, optimizations and walk-forward testing), and
…by: Guidance’s unique “Pseudo Series” construction, correlations and literally millions of tests on all manner
of “manufactured” series, therefore PROVIDING a significant edge in testing and indicator development
from the variables that make up the highly correlated (98 %+) output series.
Thus, we
1. Developed exponential based formulas which can simulate the characteristics of financial data series. Over a
number of years, our proprietary measures of Growth, Variance and Noise were able to extract three key
variables (DNA like measures) from actual price data in a series, plug those into the exponential “Pseudo-Series”
formula and create an output series which correlated over 98% to the actual price series. These variables form
part of the core (“DNA”) of the key indicators used in ‘Guidance’, and give its systems the ability to validate and
fine-tune these as real-time prices unfold. They are unlike any others and definitely “outside-of-the-box”.
2. Used the above-identified “exponential formulas” in our own unique way, combined with a random number
generator to produce millions of fabricated combined values of Growth, Variance and Noise, so that ‘Guidance’
was able to test its formularies on millions of “manufactured” series which have, on balance… had the same
characteristics (within a 0.1% variance) of the “live series” in our data bases. When the system performance
metrics of these manufactured series started to closely match those on actual series historical testing, we knew
we really had something special.
For the past 2 1/2 years, the real-time results of specific indicators have closely matched the results from the millions of
“pseudo” series randomly generated and tested. Moreover, all of this employed the “Thomas Edison Method” of finding
“10,000 ways of how NOT to make a light bulb” before he FINALLY SUCCEEDED. The extreme testing revealed endless
(literally millions) examples of how standard indicators do not consistently work well in irregular and volatile markets.
The “Pseudo Series” test, unique to ‘Guidance’, made it possible.
Most systems of others are based (at most) on tests of 10-100 data series per commodity. Guidance (due to the
Pseudo-Series) has tested over a million! How is that for ROBUST?
8. Trade Plan:
Systems developed and ready to be deployed have been tested and, across the board, have met our minimum
performance goals, which are:
Guidance(*) Verses Other Fund s? (**)
1. Profit Factor (Ratio of Total gains/Total Losses) : 2.5 1.5
2. Win Loss Ratio (Ratio of Ave Gain / Ave Loss: 2.0 1.5
3. Win % (number win trades/ total trades): 67% 45%-55%
4. Maximum Drawdown on Equity (close basis): 2% 15%
5. Maximum Return for Risk (Sharpe Ratio): 1.5 1.1
6. Ratio of Max Win trade strings to Max Loss strings: 4.0 1.0
7. Percent of trading days profitable each month 85% 60%
8. Percentage of profitable weeks and months each year: 90% 66%
*’Guidance Systems have significantly exceeded these performance goals on historical tests
**These are typical “Dream” Metrics of some of the very biggest and best long-term funds, not often achieved.
Guidance is currently undergoing live testing on simulated accounts progressing to real accounts (once profitability and
consistency are established on sufficient sampling of time and market states) to further refine the goals and
expectations (since historical testing is always overstated with significantly lower results expected in live trading on real
accounts).
The Company anticipates finishing its real account testing over the several months it will take to complete the legal
process of initial registration as a Commodity Trading Advisor (CTA) and a Commodity Pool Operator (CPO) with the
National Futures Association (NFA) and Commodities Futures Trading Commission (CTFC). At that point we can
implement the Business Plan of Guidance (you may review in the Appendix).
Demonstrations:
Please call Merrill Moses at 858-353-2001 or email him at mmoses@chowser.net to arrange a live market
demo during market hours after reading this. We have attached a recent live video for you to see a sample of
what you will be viewing…you pick the live viewing time at random and we will be happy to show you live (your
computer viewing ours in real time) what we believe you will not see anywhere else.
Thank You,
“The Guidance Team”
Intuitively Interactive Guidance Systems, LLC
2683 Via De La Valle, Suite G418, Del Mar, California 92014
Appendix (following pages):
Disclaimers: Important Read
Business Plan: Summary of the Business of Guidance
White Paper: Abnormal Profits from Lognormal Prices
FAQ’s: Questions we usually get and you may already have
9. APPENDIX
Disclaimers
We pay our lawyers a lot of money for these because it is important that you thoroughly read and understand
them:
First of all, nothing contained in this document is an offer to buy or sell anything…and second,
past performance is no guarantee of future performance. Further you should know that:
THE RISK OF LOSS IN TRADING COMMODITY FUTURES CONTRACTS (INCLUDING INTERESTS THEREIN) CAN BE
SUBSTANTIAL. YOU SHOULD THEREFORE CAREFULLY CONSIDER WHETHER SUCH TRADING IS SUITABLE FOR
YOU IN LIGHT OF YOUR FINANCIAL CONDITION. IN CONSIDERING WHETHER TO TRADE OR TO AUTHORIZE
SOMEONE ELSE TO TRADE FOR YOU, YOU SHOULD BE AWARE OF THE FOLLOWING:
IF YOU PURCHASE A COMMODITY FUTURES OPTION, YOU MAY SUSTAIN A TOTAL LOSS OF THE PREMIUM AND
OF ALL TRANSACTION COSTS.
IF YOU PURCHASE OR SELL A COMMODITY FUTURE CONTRACT OR SELL A COMMODITY FUTURES OPTION OR
ENGAGE IN OFF-EXCHANGE FOREIGN CURRENCY TRADING, YOU MAY SUSTAIN A TOTAL LOSS OF THE INITIAL
MARGIN FUNDS OR SECURITY DEPOSIT AND ANY ADDITIONAL FUNDS THAT YOU DEPOSIT WITH YOUR BROKER
TO ESTABLISH OR MAINTAIN YOUR POSITION. IF THE MARKET MOVES AGAINST YOUR POSITION, YOU MAY BE
CALLED UPON BY YOUR BROKER TO DEPOSIT A SUBSTANTIAL AMOUNT OF ADDITIONAL MARGIN FUNDS, ON
SHORT NOTICE, IN ORDER TO MAINTAIN YOUR POSITION. IF YOU DO NOT PROVIDE THE REQUESTED FUNDS
WITHIN THE PRESCRIBED TIME, YOUR POSITION MAY BE LIQUIDATED AT A LOSS, AND YOU WILL BE LIABLE FOR
ANY RESULTING DEFICIT IN YOUR ACCOUNT.
UNDER CERTAIN MARKET CONDITIONS, YOU MAY FIND IT DIFFICULT OR IMPOSSIBLE TO LIQUIDATE A
POSITION. THIS CAN OCCUR, FOR EXAMPLE, WHEN THE MARKET MAKES A “LIMIT MOVE”.
THE PLACEMENT OF CONTINGENT ORDERS BY YOU, SUCH AS A “STOP-LOSS” OR “STOP-LIMIT” ORDER, WILL
NOT NECESSARILY LIMIT YOUR LOSSES TO THE INTENDED AMOUNTS, SINCE MARKET CONDITIONS MAY MAKE
IT IMPOSSIBLE TO EXECUTE SUCH ORDERS.
A “SPREAD” POSITION MAY NOT BE LESS RISKY THAN A SIMPLE “LONG” OR “SHORT” POSITION.
THE HIGH DEGREE OF LEVERAGE THAT IS OFTEN OBTAINABLE IN COMMODITY INTEREST TRADING CAN WORK
AGAINST YOU AS WELL AS FOR YOU. THE USE OF LEVERAGE CAN LEAD TO LARGE LOSSES AS WELL AS GAINS.
YOUR ACCOUNT IS SUBJECT TO SUBSTANTIAL CHARGES FOR ADVISORY FEES AND EXPENSES. BECAUSE OF
THESE CHARGES, YOUR ACCOUNT MUST MAKE TRADING PROFITS TO AVOID DEPLETION OR EXHAUSTION OF
ITS ASSETS. THIS DISCLOSURE DOCUMENT CONTAINS, ON PAGE ELEVEN (11), A COMPLETE DESCRIPTION OF
10. EACH FEE AND EXPENSE THAT WILL BE CHARGED TO YOUR ACCOUNT BY THE ADVISOR. THIS DOES NOT
INCLUDE CHARGES FOR COMMISSIONS AND EXPENSES CHARGED BY THE BROKERAGE.
THIS BRIEF STATEMENT CANNOT COVER ALL THE RISKS AND OTHER SIGNIFICANT ASPECTS OF THE COMMODITY
TRADING MARKETS. YOU SHOULD THEREFORE CAREFULLY STUDY THIS DISCLOSURE DOCUMENT AND
COMMODITY FUTURES TRADING BEFORE YOU TRADE, INCLUDING DESCRIPTIONS OF THE PRINCIPAL RISK
FACTORS OF THIS INVESTMENT STARTING ON PAGE SEVEN (7).
THE ADVISOR IS PROHIBITED BY LAW FROM ACCEPTING FUNDS IN ITS OWN NAME FROM YOU FOR TRADING
COMMODITY FUTURES CONTRACTS. YOU MUST PLACE ALL FUNDS FOR TRADING IN THIS TRADING PROGRAM
DIRECTLY WITH A FUTURES COMMISSION MERCHANT OR RETAIL FOREIGN EXCHANGE DEALER AS APPLICABLE.
The BUSINESS PLAN is on the next page.
11. The Business Plan
Description of the Company’s “Business Plan”
Business Operational plan: The Company has a unique and revolutionary plan or approach to commercializing the
trading system and operating the Company. To “commercialize” the business plan and to operate the automated
trading system’s signals, the company’s servers will send a single trading signal to the securities house (I.B.) whereby
the Company’s “Parent” account upon receiving the trading signal, simultaneously trades to ALL “child/client accounts”
underneath and attached to it. Our Servers generate computer signals for each Commodity and send that signal to a
specific trading account for that Commodity to the online Securities Brokerage Company; “Interactive Brokers”. In this
way, “Guidance” is an interactive System (to the existing market conditions) and a fully hands-off automated trading
platform.
A). The Company will sell a “License” based on a monthly cost basis to a qualified client for each Futures contract
signed up for up to a maximum number of 5 contracts or licenses for each Commodity offered (Gold, Financial
Futures, Indices or Forex trades etc.). The Company will auto-trade each client’s account thru the Company’s Parent
account simultaneously for that Commodity. The net result to the client is his or her account is temporarily assigned
to the Companies “Parent Account” controlled by the Company’s auto trading, self-thinking, interactive system.
Moreover, the resultant fee charged by the Company is for each license (ie: $1,500) but it will be auto deducted from
his or her trading account after the months business and at the end of the Month. The total amount of the “Clients
funds” will NEVER reside with the Company. They will always be held by I.B.
B). Intuitively Interactive Guidance Systems program still allows the client to have complete control of his or hers
account and or to assign his or her ‘Trading Account’ to the Companies ‘Parent Account’. The client at any time, per
his choice, could manually manipulate his or her account via any momentary decision of the client.
C). There will be a Maximum number of “licenses” available for each Commodity as to never influence the Market.
The Company intends to keep the “Financial Influence” down as a consequence. That is why we will limit the number
of Licenses that a single person/entity can hold in each commodity to a total of Five (5) AND the number of available
licenses/contracts traded by the Company as a whole will be capped (ie 100 Gold).
Marketing
The end user/client of Guidance Systems falls into two main classifications:
1). the first is comprised of the retail/individual trader and referral/affinity networks of trading individuals. And /or
2). the 2nd
end user is comprised of market professionals such as money managers, commodity trading advisors, system
developers and, on a selective basis, professional fund managers. These groups will be targeted through a series of
proven marketing strategies such as advertising, conference displays and personal referrals. Competitive code based
safeguards will be in place should Intuitively Interactive Guidance Systems, LLC align itself in the future with a fund
manager.
12. The Guidance System makes money on the "License" fees paid by each client on a monthly basis for each financial
commodity contract traded over a month’s period of trading. The fees are moderate and are based upon a flat fee set
by the Company from time to time. Each client will be allowed to trade up to 5 Licenses/Contracts per
commodities. The number of trades and their daily trading frequency changes based on specific trading volumes and
types of activity.
The Company’s goal is hundreds of clients or more per Commodity… based on the Volume of Contracts traded each
day on the exchanges. Each client’s account and all their money is to be held by “Interactive Brokers” -- a premier on-
line financial firm -- with the ‘Guidance’ trading signals being sent directly to the Company’s Parent account at
‘Interactive Brokers’ expecting essentially instantaneous trade action.
Summary
There is a Massive need for personal FINANCIAL ASSISTANCE in this country. But without a New Practical approach
“What are people to do”? “The Company will likely create a demand for our Services like no-one has ever seen before”!
The “White Page”; “Abnormal Profits from Lognormal Prices” is on the next page.
13. Abnormal Profits from Lognormal Prices
[To be held Confidential Please]
“Thinking Outside the Black Box in Developing Automated Trading Systems”
By C. Cortland Hooper & Merrill W. Moses
Long term success in trading, as well as in business in general, often can be attributed to having a well-defined “edge”
over the competition. In technical analysis of financial market data series, such an edge is usually sought by using “tried
and true” techniques (i.e. combinations of “toolbox” type indicators such as ‘Stochastics’, ‘MACD’, ‘RSI’, ‘ADX’, etc.) and
making them more responsive, adaptive, reducing the lag, etc., or by being a microsecond faster in execution than the
program trading “herd” which uses many of these same indicators often at the same times during a trading market.
Decades can be spent by a professional market technician in trying to reduce the lag in an indicator or two (without
increasing whipsaws or numbers of trades) by a single bar…and 1 bar can be the difference in profitability or not.
Having continually conducted technical indicator research since the age of 18 (48years), I have spent blocks of 5-10 years
developing and improving indicators progressively with small incremental “edges”. About 10 years ago, I hit a wall where
the best these “edges” would provide… was an additional 10-15% in performance (i.e. increasing the winning trade
percentage from 50% to 57%), having bumped up against the limitations of the mathematics and system designs
involved. At that rate, I wasn’t going to live long enough to trade and hit my goal of having a total black box automated
trading system with a consistent accuracy of 75+% and other metrics I felt were key and requisite to long term success.
I decided to start over with a “fresh sheet of paper” to seek a different path to getting a better edge. The path I studied
was the study of the characteristics of financial price paths (data series) themselves. It may sound simplistic, but I asked
myself, “What do you REALLY know about data series in the markets”? After all, it was these price paths to which I was
applying complicated mathematical formulas in an attempt to track and capture prices like a “heat seeking missile”…
thus, I really needed to know all I could about the characteristics of the target I was chasing. Having never devoted a
moment to this question in nearly four decades, my answer to this question was, “not much”.
As I delved into this question, I came across a sophisticated book by Simon Beniga, which was focused on this question. It
basically said that prices are wiggly, irregular and increasingly have their growth and variance get larger over time. No
real enlightenment there. But, then the book had a formula I adapted which the author claimed was the mathematical
template for data series which have similar characteristics as financial price series, or any other for that matter, which
had “fat tails” (i.e. occasional “trending” data strings) on the frequency plots of daily price changes. I call it the “Pseudo
Series” formula and it is represented by the following mathematical equation:
S1=S0 * e( + Z *((t) ^1/2)
”Pseudo Series Equation”
Where in the adaptation, the definitions of the variables are:
14. ”mu”) = a measure of “Growth” or “return” (the certain component – % prices advance or decline over a period).
(”sigma”) = a measure of “Variance” or “volatility” (the uncertain component – % prices change on average, short term over a period).
Z = a measure of “Noise” (the normal deviation of prices from the Mean or projected price path over a period).
t = the look-back period in number of bars defining “short term”.
“In words, this says that today’s value of the (Calculated or “Manufactured”) series is equal to yesterday’s value
times the exponentiation of the sum of the measure of growth bar-by-bar plus the product of the measure of variance
times the measure of noise times the square root of the look-back period bar-by-bar” (try and say that 10 times in
rapid succession!).
The resultant series is “Log Normal” due to the fact that a frequency distribution of the logarithm (to the base 10) of bar-
by-bar changes of price (“return”) result in a “Normal Distribution” ( bell shaped curve centered on a Mean…with no “fat
tail” on the right side of the distribution curve). So, of what use is this knowledge? At first I wasn’t sure. Then, it dawned
on me that there were 3 main variables…”Growth, Variance and Noise”. The first two could be historically measured (say
on the S&P500) and the third could be randomly generated with a random number generator. Thus, I could generate an
unlimited number of data series which would have the same characteristics of the past S&P500 data (in terms of return
and volatility). If I was working with end of day data for periods of a year, I could not only test maybe 30 years of actual
annual data series (30 tests of anything being a minimum to have basic statistical reliability on the confidence intervals of
the results), BUT I could test 100,000 or even 1,000,000 or more “manufactured” data series which had the same
characteristics of the actual series! Now that is the definition of a ROBUST back test! This “extreme” testing was the first
and most important “edge”. Who wouldn’t have more confidence in a system tested on a million series than one tested
on just 30? After all, confidence in one’s system is a pre-requisite to trusting it and keeping your hands off of it and not
second-guessing it all (or even a little of) the time…an ironclad law for using fully automated trading systems.
The second edge and a “Eureka moment” came when I realized that this formula could provide a template for indicator
development itself…perhaps being able to extract “pure DNA” from live data series on the fly and using that as both the
basis of indicator construction and “natural adaptability”. This pure DNA would come from this proposition: “What if I
could develop calculations for “Growth, Variance and Noise” on a bar-by-bar basis which, when inserted into the formula
above on a real-time basis, would produce a data series IDENTICAL (i.e. have a correlation of 98+%) bar-by-bar to the
actual real-time data series? Would it be possible to have a mathematical formula (with no curve fit constants, but all
variables which are measured bar-by-bar) which produces or replicates (“clones”) the very data series we are tracking
and trading? It took a few years and over 10,000 hours of programming (using the Thomas Edison method of trial and
error) to be able to answer this question with a resounding YES!
Fairly early on, I came up with good proprietary measures of “Growth and Variance”. I measured the Logarithms of
Return over varying periods for Growth and variable sums and sums squared of variable look-back periods of these
measures of Growth (return) to get the indicators for Variance (volatility). That was the easy part, as the key to achieving
an exact clone of the data series lay in the calculation of the “Z” variable, which represents the Noise in the data series.
15. This “Z” variable would be the foundation for my indicator development and give me a variable component of it which
would provide a “natural adaptability” mechanism to use within those indicators and as filters.
From my early days as a missile guidance engineer and rocket scientist, I was used to calculating a projected or “ideal”
forward path and constantly measuring the difference of the actual coordinates of the vehicle (target), so that continuous
“mid-course” corrections or adjustments could be made (this genesis explains why the systems developed and explained
herein are named “Guidance”). With the advent of 1-minute data, such timely and a continuous series of short-term
corrections could be made. Therefore, the first task in constructing “Z” was to develop calculations for the projection of
the next price bar, which would “Lead” the current bar. From this lead projected value, the value (Open) of the current
bar would be subtracted to arrive at the “Z” value and the adaptive “course corrections”.
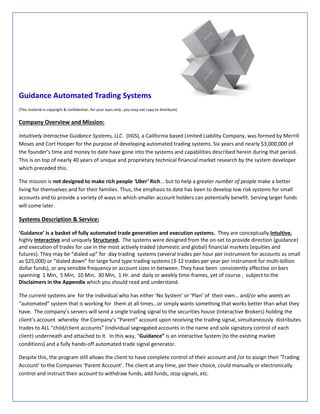
The final “Z” formula involved a measure of Growth utilizing 3 variable periods based upon the variable speed (“C”) of
the data times a measure of the “Distortion” (“amount off track” of outliers , at the extremes of the distribution)
normalized by the Fibonacci constant, and added to the previous value of the projection of the prior bar. This “C” variable
was the “adaptive” component of the “Z” value (shown in Figure 1 below). The “Z” value appears as a seismograph plot
does….wiggly values with irregular variations and high frequency around a zero value (the “Normal Deviations”). As it
turns out, the on-balance accumulation of these plus and minus “Z” values correlates 98+% with the actual price
series…an astonishing outcome and relationship to be sure.
The “c” value series, which is the driving component of the Z value, is shown in Figure 2.
It is a wavy series with values ranging from .01 to .07.
(1.50)
(1.00)
(0.50)
-
0.50
1.00
1.50
2.00
2.50
1332
1334
1336
1338
1340
1342
1344
"Z" (blue) derived from Price (pink)
Figure 1. “Z”
Price Seismograph
The “Noise”
component of the
data, being the
normal deviation of
price from its
projection. It
depends upon the
speed “c” to
establish the
amount of
correction.
16. It’s significance first , is that it has an inverse and smooth geometric relationship to the look-back period “N” values from
25 to 200 ( Figure 3). Note: the trough to trough and peak to peak periods are somewhat regular.
Measuring this “Speed” (on the x-axis) and converting it to the “N” period value (on the Y-axis) provides a smooth, logical
and effective bar-by-bar “addictiveness” to the indicators (both in look-back periods and as filters) which arise from the
“pure DNA” measures of “Growth, Variance and Noise”. The desired result from this particular “outside-the-box”
approach to indicator development was “CONSISTENCY”.
The other factor, besides the “Z” and “C” variables shown above in developing the main 9 Guidance indicators, was the
construction of the remaining 2 variables in the Pseudo Series formula, Growth and Variance. Although they are also
proprietary, their series extracted from the price series above are displayed in Figures 4 and 5. These help keep the
indicators “in tune”.
-
0.01
0.02
0.03
0.04
0.05
0.06
0.07
1326
1328
1330
1332
1334
1336
1338
1340
Speed "C" (blue) derived from smoothed Price (pink)
-
50
100
150
200
250
- 0.01 0.02 0.03 0.04 0.05 0.06 0.07 0.08
Look back Periods " N" (Y-axis) VS. Speed "C" (X-axis)
Figure 2. “C”
Price Speed
Used to calculate
the Distortion of
price from its
projected path and
equate to variable
look back period
values to be used to
provide
addictiveness as
price speeds
increase and
decrease.
Figure 3.
Periods vs. Speed
Shows smooth
inverse geometric
relationship
between the
Periods and Speed
and why the
adaptive transitions
applied to the
indicators are also
gradual.
17. Now, here is the magic. If we take the values from Figure 1 (“Z”) and the values from Figure 4 (Growth “”) and
Figure 5 (Variance “”) and plug them into the Pseudo Series formula, we get a data series shown in pink in Figure 6
below. This is a totally “manufactured” series created by a formula. And when compared to the ACTUAL data series
for the 1 minute E-Mini S&P500 (from which these measures were taken) shown in blue…they look nearly exact!
In fact, they correlate nearly 99%.
0.0000
0.0020
0.0040
0.0060
0.0080
0.0100
0.0120
1
10
19
28
37
46
55
64
73
82
91
100
109
118
127
136
145
154
163
172
181
190
199
208
217
226
235
244
253
262
271
280
289
298
307
316
325
0.00%
0.05%
0.10%
0.15%
0.20%
0.25%
0.30%
0.35%
0.40%
0.45%
1
10
19
28
37
46
55
64
73
82
91
100
109
118
127
136
145
154
163
172
181
190
199
208
217
226
235
244
253
262
271
280
289
298
307
316
325
Growth (“”) derived from Price
Variance (“”) derived from Price
Figure 4.
Growth (return)
Bar by Bar
An adaptive
variable measure of
the % prices
advance or decline
over a period.
Figure 5.
Variance (volatility)
Bar by Bar
An adaptive
variable measure of
the % prices change
on average over a
short term period
of time.
18. So, by using a random number generator for the “Z” value alone, we can generate thousands upon thousands of “test”
series for extreme and robust testing. And, when we are trading, we can calculate the actual “Z” values and generate a
companion Pseudo Series for a real-time indication that our indicators are “in tune “with the market…both an “edge” to
be sure
Comparison to Historical Testing on Real Data:.
Figure 7. Shows an excel sheet calculated 3 years ago on the E-Mini S&P500 futures contract, wherein a system based
upon these core indicators was tested with thousands of “manufactured” Pseudo Series (using a random number
generator for the Z value) , yielding a winning percentage (orange cells) of 84% and a Return over maximum Draw Down
of 400+%. Figure 8 , calculated on the NYMEX Gold futures contract, shows a results matrix of 6 different Guidance “Fund
Systems” (with low frequency trading on 1 minute bars) and 3 portfolios of different combinations of them based upon
these same core design parameters and variables, tested for the past year (August 2010 to July 2011), which also
produced the same winning percentage of 84% and a Return over Maximum Draw Down of 400+%...a first order
indication that the desired consistency is both possible and likely. This consistency and logical approach to indicator
development described herein (based not upon trend following moving averages, reversion-to-the-mean high/low
oscillators or breakout channels as a singular fundamental design approach) reduces the draw down levels built into the
“tried and true” methodologies of the past and has resulted in a quantum leap of winning trade accuracy from the mid
50% range to the mid 80+% range and similar gains on other important metrics…on an totally automated basis.
1,310
1,315
1,320
1,325
1,330
1,335
1,340
1,345
1326
1328
1330
1332
1334
1336
1338
1340
1342
1344
1346
1 22 43 64 85 106 127 148 169 190 211
Manufactured series (pink) vs. Actual series (blue) Figure 6.
Pseudo Series
The “Auto-Tuner”
As long as the
Pseudo Series
“manufactured” by
the real-time inputs
of “Z”, Growth and
Variance correlates
95+% to the actual
series we are
trading, our
indicators are “In
Tune”.
23. In the process of developing higher trade frequency “Retail Systems”, we have used the trades from the mid-range
frequency Fund Systems as a “trend”, the direction of which at any given bar, we only trade the more high frequency
retail systems. This dialing up or down of trade frequency between Fund and Retail systems is predominantly a function
of how many of the 9 core indicators are designated to be aligned at one time as a condition of a trade…the more
required, the less frequency of trades. Figure 9 shows the additional edge (based upon the past year of 1 minute bars in
NYMEX Gold futures) in utilizing lower trade frequency system trades as trend for the higher trade frequency
systems…improving the winning percentage even 10-15% higher to over 90% (orange cell) along with these other metrics
which have surpassed our design goals significantly.
These “Abnormal Profits” from the tests cited herein were truly made possible by the utilization of “Lognormal Price”
templates from the “Pseudo Series” formula above, from which the 9 core indicators were conceived from the constructs
for Growth, Variance and Noise (the major components of that formula). In the end, this “outside-the-box” approach to
indicator development used for the fully automated Guidance Systems has us measuring more of the right things (not
RSI, Stochastics, MACD, etc…which are noisy depictions of who knows what) and being able to test those on millions of
series which statistically have the same characteristics of the very price series we deal with in the markets. When our first
tests on live data produced the same accuracy (% wins) and other performance metrics as we got on the million
Pseudo-Series tests…we knew we were onto something and that the high correlation to actual series would be most
useful in entry and exit strategy, giving Guidance its desired and notable “Edge”.
Thank you for your time and your interest…
Sincerely,
“The Guidance Team”
Intuitively Interactive Guidance Systems, LLC
2683 Via De La Valle, Suite G418, Del Mar, California 92014
FAQ’S on the next page.
24. Frequently Asked Questions
1. Does Guidance do High Frequency Trading?
No. Its Tick System may make a thousand trades a day (a higher frequency than a lot of traders)
but it is not a HFT. HFTs are in stocks, we are in commodities. HFTs use special data feeds, we
use public. HFTs trades millions of trades in milliseconds, our max would be 40 trades in an hour.
HFTs are actually good for the market (providing 50% of the trades…Liquidity)…and help keep the
Bid/ask spread (cost of entry and exit) low for the average trader. It has just gotten a lot of hype
in a slow news cycle when someone published a book. It poses Guidance no perceived risk.
2. Does Guidance predict prices?
No. It simply calculates the odds of price directional movement every 15 minutes.
3. Does Guidance use fundamental data (like government reports) or allow you to define the
Direction you want to trade?
No. It is totally mechanical, technical and fully automated in its decisions and executions,
taking no outside input other than price and trading volume. It trades near equally on the long
and short side no matter which directions the trends may take.
4. Are there different systems for different commodities?
No. The built in Adaptive features are designed to track any market however it unfolds and
whether or not they are more trendy, choppy, volatile, etc. Thus, Guidance is not “curve fitted”
to any particular market or data set.
5. Once I open an account is there anything else I have to do?
We suggest you check it weekly. The signals from Guidance will make trades automatically.
6. What markets is Guidance going to trade?
Guidance cut its teeth on Gold futures, since it is the hardest for automated systems. We will
Next apply it to the S&P 500 E-Mini and crude oil where it has had some testing already.
Soon thereafter it will be applied to the most active Forex pairs and then at least one
Commodity in each of the major groups.
7. Although there are never any guarantees, is there a profit goal? Only extensive trading on live
accounts will better help formulate this, but the design goal along with watered down
expectations below the historical testing has established a goal of a daily average per one
contract of Gold at $500. There is also a complete trade plan with almost a dozen metrics of
target performance
8. Where did Guidance get its name?
The genesis of the foundational math and concepts come from the system developer’s early
Days as a missile guidance engineer.